

Objectives:
Elevated levels of interleukin-6 (IL-6), D-dimer, and C-reactive protein (hsCRP) are associated with increased incidence of comorbid disease and mortality among people living with HIV (PLWH). Prior studies suggest a genetic basis for these biomarker elevations in the general population. The study objectives are to identify the genetic basis for these biomarkers among PLWH.
Methods:
Baseline levels of hsCRP, D-dimer, and IL-6, and single nucleotide polymorphisms (SNPs) were determined for 7768 participants in three HIV treatment trials. Single variant analysis was performed for each biomarker on samples from each of three ethnic groups [African (AFR), Admixed American (AMR), European (EUR)] within each trial including covariates relevant to biomarker levels. For each ethnic group, the results were pooled across trials, then further pooled across ethnicities.
Results:
The transethnic analysis identified three, two, and one known loci associated with hsCRP, D-dimer, and IL-6 levels, respectively, and two novel loci, FGB and GCNT1, associated with D-dimer levels. Lead SNPs exhibited similar effects across ethnicities. Additionally, three novel, ethnic-specific loci were identified: CATSPERG associated with D-dimer in AFR and PROX1-AS1 and TRAPPC9 associated with IL-6 in AFR and AMR, respectively.
Conclusion:
Eleven loci associated with three biomarker levels were identified in PLWH from the three studies including six loci known in the general population and five novel loci associated with D-dimer and IL-6 levels. These findings support the hypothesis that host genetics may partially contribute to chronic inflammation in PLWH and help to identify potential targets for intervention of serious non-AIDS complications.
Keywords: cardiovascular disease, chronic inflammation, D-dimer, genome-wide association studies, HIV, high-sensitivity C-reactive protein, interleukin-6
Introduction
The advent and widespread utilization of combination antiretroviral therapy (cART) has dramatically reduced the incidence of opportunistic infectious diseases and AIDS-associated malignancies in PLWH, leading to a subsequent rise in the prevalence of serious non-AIDS complications as the primary driver of morbidity and mortality in this population [1,2]. Among PLWH, elevated levels of biomarkers associated with inflammation and coagulation including interleukin-6 (IL-6), D-dimer, and high-sensitivity C-reactive protein (hsCRP) have all been associated with an increased risk of cardiovascular disease (CVD), cancer, and all-cause mortality [3,4]. These biomarkers have also been associated with a higher risk of similar diseases and mortality in the general population [5–8]; an interesting discovery that has stimulated a field of inquiry into understanding the role of chronic inflammation as the primary driver of serious non-AIDS-related complications in PLWH [9–11].
Although the underlying mechanisms by which these biomarkers are involved in the pathogenesis of non-AIDS complications remains an active area of research, studies have shown that elevations in these biomarkers decline with cART [12]. However, despite plasma HIV RNA levels less than 50 copies/ml over long periods of time, many patients continue to exhibit persistently elevated levels relative to the general population, suggesting that viral replication alone is not the sole contributor to chronic inflammation in this population [13]. Prior studies have shown that in certain ethnic populations, elevations of these biomarkers may have a partial genetic basis [14,15], although such genetic associations have not been as clearly established or examined in the HIV-infected population.
Genome-wide association studies (GWAS) have been utilized in the HIV-infected population to assess host determinants of a variety of phenotypes including host susceptibility to infection, innate virologic control [16], and cART pharmacogenomics [17,18]. However, to our knowledge, no similar investigation has previously been conducted to investigate the potential genetic basis for inflammation in this population, although similar genomic/GWAS analyses have been attempted for a host of other diseases [19–21]. Furthermore, GWAS analyses have been used to identify loci associated with elevated levels of hsCRP, D-dimer, and IL-6 in the general population [22–26]. The CRP, HNF1A, and APOE loci have been commonly identified to be associated with levels of hsCRP [22,23,26] and blood CRP concentration is associated with colorectal cancer [26]. HNF1A is a transcription factor, which can bind to the CRP promoter [27] and APOE can attenuate unsolvable inflammation by complexing with activated C1q [28]. Interestingly, hsCRP has been used to diagnose maturity-onset diabetes of the young (MODY) as a result of HNF1A [29]. In another study, three loci, F3, F5, and FGA, were identified to be associated with D-dimer levels in healthy adults [24]. Consistently, F3, F5, and FGA belong to the Complement and Coagulation Cascades pathway. In this study, we aimed to both qualitatively and quantitatively investigate host genetic contributions to elevation of biomarkers noted to be strongly associated with serious non-AIDS-related complications using GWAS analyses of data combined from three large international HIV studies: Evaluation of Subcutaneous Proleukin in a Randomized International Trial (ESPRIT) study [30], the Strategies for Management of Antiretroviral Therapy (SMART) [31] study, and Strategic Timing of Antiretroviral Therapy (START) study [2].
Materials and methods
Participants
The participants enrolled in this GWAS were enrolled in one of three international HIV treatment trials: ESPRIT [30], SMART [31], and START [2]. Written informed consent was obtained from every participant in each study. All informed consents were reviewed and approved by participant site ethics review committees.
Genotyping and quality control
The study and analytical design are illustrated in Fig. 1. A total of 7768 participants were successfully genotyped using a custom Affymetrix Axiom SNP array at Advanced BioMedical Laboratories. The array consisted of 770 558 probe sets enriched with markers related to immune functions.
Fig. 1.
Analysis workflow.
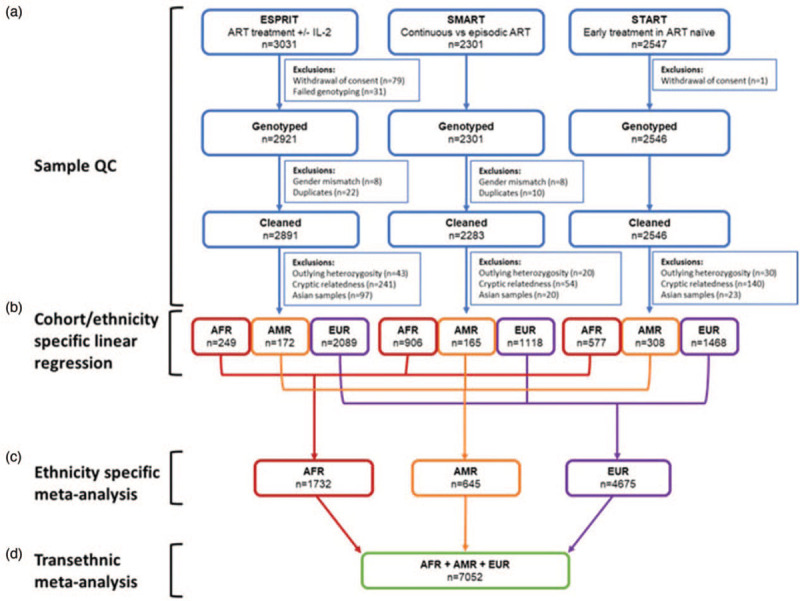
(a) Sample quality control by study. (b) Single variant analysis for samples in each ancestral group of each study using multiple linear regression with an additive model. (c) Linear regression results across the three studies were combined in a fixed-effects meta-analysis for each ancestry group. (d) Ethnicity-specific meta-analyses results were combined in a transethnic fixed-effects meta-analysis.
Genotypes were called using Axiom Analysis Suite (version 3.1.51.0, Thermo Fisher Scientific). Quality controls were performed using PLINK (version 1.9) [32]. Individuals with any of the following were excluded: sex mismatch, autosome SNP call rate less than 96%, duplicates, estimated by pairwise identity-by-descent (IBD) (pi-hat at least 0.90). These exclusions resulted in 7720 participants. For each study, individuals with any of the following were further excluded: an autosome heterozygosity rate outside three standard deviations of the mean of individuals in each assigned ancestral group: 93 participants were excluded; cryptic relatedness individuals (pi-hat >0.1875) with a lower quality: 435 participates were excluded (see Fig. 1).
ADMIXTURE (version 1.3.0) [33] was used to assign ancestry for each individual and principal component analysis (PCA) was applied to account for population stratification. The details of SNP quality control, ancestry assignment, and PCA analysis are described in detail within Supplemental Material and Methods.
Genome-wide association studies
Single variant analysis was performed for participants in each ancestral group of each study using multiple linear regression with an additive model (1 df) in PLINK, with the first 10 principal components, and the following other covariates measured at study entry: age, sex, natural log transformed CD4+ cell count, natural log transformed viral load, BMI, smoker at baseline (missing in ESPRIT), hepatitis B virus (HBV), hepatitis C virus (HCV), diabetes, and history of CVD. Most covariates were used in all biomarker association analyses except the following: HCV was only used in IL-6 and D-dimer analyses, history of CVD was only used in hsCRP and IL-6 analyses, and history of diabetes was only used in D-dimer analysis. These covariate selections were based on bidirectional step-wise variable selection using AIC on potential variables in R [34], previous literature [35–37] and biological plausibility. Since not all the potential covariates of interest were collected in each trial, models were fit on each trial separately and covariates were included if any of the three stepwise regression models selected the potential covariate of interest. The variance inflation factor was also investigated to determine collinearity among the covariates chosen via stepwise regression and collinearity did not appear to be a significant problem. The levels of hsCRP, IL6, and D-dimer were natural log transformed.
To increase statistical power, results from the linear regression analyses across the three studies were combined in a fixed-effects meta-analysis using METAL [38] with inverse variance weighting for each ancestry group: European (EUR), African (AFR), and Admixed American (AMR). The EUR, AFR, and AMR meta-analyses results were further combined in a second transethnic fixed-effects meta-analysis to identify the SNPs associated with hsCRP, D-dimer, and IL-6 levels. Genomic control adjustment was turned on in METAL to adjust for any inflation. Lambda gc (λgc) [39] and quantile--quantile (Q--Q) plots were used to assess the system bias in the GWAS results. Manhattan plots were generated to visualize GWAS results. Q--Q plots and Manhattan plots were generated with the CMPlot R package [40] (version 3.3.4). A genome-wide significance (GWS) threshold was set at P less than 5 × 10⁻⁸. A locus was defined by significant SNPs within 100 kb of each other and annotated by AVIA [41] (v3.0, http://avia-abcc.ncifcrf.gov/) with the locus name based on the closest gene to the SNP with the most significant P value (lead SNP). Locus SNPs were subjected to stepwise conditional analysis using GCTA-COJO to determine if there were any secondary association signals (SAS) [42].
Results
Study participants and quality control
After exclusion of sex mismatches and duplicates, 7720 out of 7768 genotyped participants remained from ESPRIT, SMART, and START (third row in Fig. 1). Baseline demographic, clinical, and laboratory characteristics including biomarkers of interest (D-dimer, hsCRP, and IL-6) of the remaining 7720 participants were acquired from previous studies [12,35,36] and were summarized (Supplemental Table 1). As a limitation of the data, hsCRP, D-dimer, and IL-6 measurements were not available for all 7720 participants listed in this table. The distribution of the major biomarkers in these three datasets are shown in Fig. 2. As the biomarker levels from the participants in the START study were measured before ART was initiated, median and IQR viral load values are higher than the other two studies and the viral load and CD4+ cell count distributions in START are different from those of the SMART and ESPRIT studies. Viral load and CD4+ cell count were used as covariates in the GWAS analysis to account for these differences between the studies. The meta-analysis process (see below) used in this study will further minimize the effect of the different treatment strategies between studies on biomarker levels. A total of 528 participants were excluded from further analysis after performing quality control analysis for cryptic relatedness and outlying heterozygosity (Fig. 1).
Fig. 2.
Distribution of biomarker and HIV clinic treatment relevant measurements.
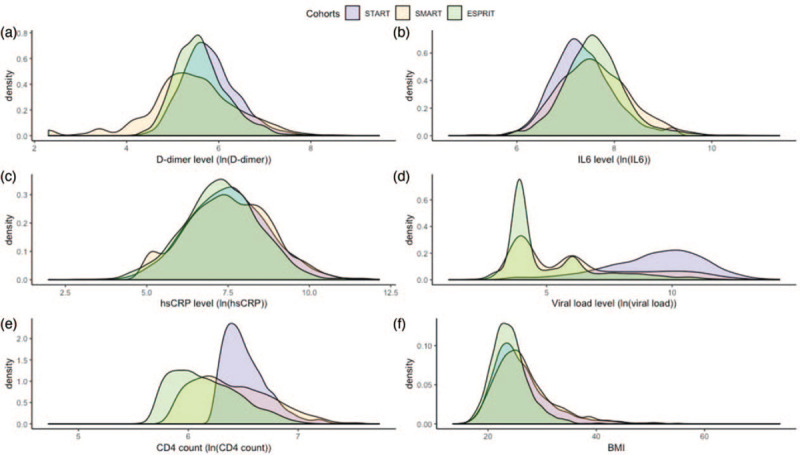
(a) D-dimer level, (b) IL-6 level, (c) high-sensitivity C-reactive protein (hsCRP) level, (d) viral load level, (e) CD4+ cell count level, (f) BMI.
Quality control and imputation of SNPs was described in Supplemental Materials and Methods and illustrated in Supplemental Figure 1).
Meta-analysis of three multiethnic studies
Participants were partitioned into the five ancestral groups based on individual ancestry assignment. AFR, AMR, and EUR groups remained for association analysis whereas South and East Asian groups were excluded because of low sample size: 140 participants (Fig. 1). The GWAS analysis of each ethnic group from the three studies were combined by meta-analysis to identify the SNPs associated with hsCRP, D-dimer, and IL-6 levels.
To assess any systematic biases that may be present in our GWAS results, Q--Q plots were generated and λgc calculated (Fig. 3). These plots show that the ethnic-specific and transethnic analysis have normal distributions of P values. All related λgc are close to 1.0, demonstrating there was no genomic inflation in the GWAS analysis results.
Fig. 3.
Quantile--quantile plot and genomic control inflation factor (λgc) for genome-wide association studies analysis of transethnic and individual ethnic group.
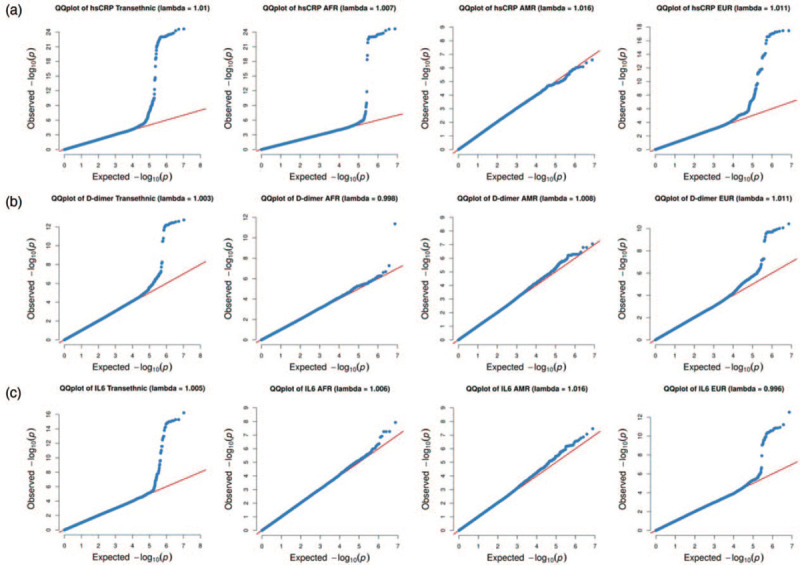
(a) Genome-wide association studies (GWAS) analysis for high-sensitivity C-reactive protein (hsCRP), (b) GWAS analysis for D-dimer, (c) GWAS analysis for interleukin-6 (IL-6).
Single nucleotide polymorphisms associated with levels of high-sensitivity C-reactive protein
Three gene loci associated with levels of hsCRP were identified for the transethnic group: CRP, HNF1 Homeobox A (HNF1A), and apolipoprotein E (APOE) (Fig. 4a, Supplemental Data 1). There was no evidence of heterogeneity across ethnicities as determined by the Cochran's Q-test for heterogeneity (HetPVal) for any of the lead SNPs at these loci (Table 1). Due to the small sample size, not all loci could be identified in all ethnic groups. However, there were SNPs in the CRP and HNF1A loci, which reached GWS in the EUR group only and exhibited heterogeneity across ethnic groups (Supplemental Data 1, Supplemental Figure 2).
Fig. 4.
Manhattan plots of transethnic meta-analyses results for genetic associations with three biomarkers.
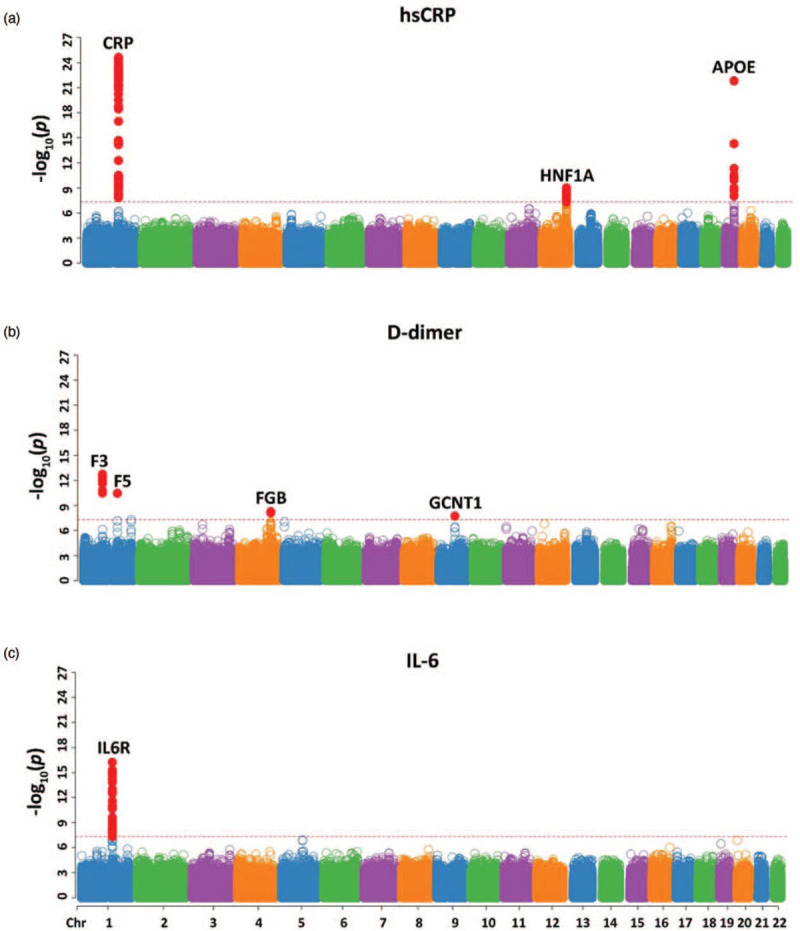
(a) High-sensitivity C-reactive protein (hsCRP) levels, (b) D-dimer levels, and (c) interleukin-6 (IL-6) levels. Loci are labelled by the closest gene. Each point represents one SNP and is plotted by chromosomal location (x-axis) and −log10(P) (y-axis). The dashed red line represents genome-wide significance (P = 5 × 10⁻⁸) and single nucleotide polymorphisms (SNPs) meeting this threshold are colored red.
Table 1.
Lead variant of loci or second associated signal identified to be associated with the level of high-sensitivity C-reactive protein, D-dimer, and interleukin-6.
| Transethnic | AFR | AMR | EUR | |||||||||||||||||
| Biomarker | Locus | Lead SNP | Number of SNPs | Chr | Build 37 position (bp) | Effect allele | Other allele | P | β | EAF | HetPval | P | β | EAF | P | β | EAF | P | β | EAF |
| hsCRP | CRP | rs6667499 | 32 | 1 | 159 677 654 | A | G | 2.38E-25 | 0.569 | 4.40% | 1.00 | 2.30E-25 | 0.569 | 16.90% | NA | NA | 1.20% | NA | NA | 0.30% |
| hsCRP | CRP | rs2794520 | 45 | 1 | 159 678 816 | T | C | 5.43E-24 | −0.224 | 30.90% | 0.88 | 3.10E-06 | −0.245 | 20.00% | 2.02E-02 | −0.197 | 35.60% | 4.21E-18 | −0.222 | 34.30% |
| hsCRP | HNF1A | rs2393776 | 34 | 12 | 121 424 406 | G | A | 9.90E-10 | −0.129 | 38.60% | 0.77 | 2.92E-02 | −0.099 | 29.60% | 8.63E-02 | −0.139 | 45.40% | 3.80E-08 | −0.137 | 40.90% |
| hsCRP | APOE | rs429358 | 11 | 19 | 45 411 941 | C | T | 1.57E-22 | −0.282 | 15.40% | 0.97 | 1.71E-08 | −0.282 | 22.90% | 1.35E-02 | −0.313 | 12.10% | 3.47E-14 | −0.279 | 13.10% |
| D-dimer | F3 | rs2022309 | 17 | 1 | 95 052 476 | T | G | 1.86E-13 | 0.092 | 23.30% | 0.98 | 2.33E-02 | 0.101 | 8.90% | 7.34E-03 | 0.091 | 26.80% | 9.81E-11 | 0.091 | 28.10% |
| D-dimer | F5 | rs6025 | 1 | 1 | 169 519 049 | T | C | 3.57E-11 | 0.257 | 1.80% | 1.00 | NA | NA | 0.30% | NA | NA | 0.70% | 3.76E-11 | 0.257 | 2.50% |
| D-dimer | FGB | rs6056 | 2 | 4 | 155 488 821 | T | C | 5.61E-09 | −0.082 | 16.30% | 0.65 | 9.30E-02 | −0.072 | 8.90% | 4.54E-03 | −0.118 | 15.40% | 9.75E-07 | −0.078 | 19.20% |
| D-dimer | GCNT1 | rs4745559 | 1 | 9 | 79 156 992 | C | T | 1.89E-08 | 0.085 | 14.60% | 0.50 | 4.80E-04 | 0.114 | 17.30% | 9.94E-03 | 0.098 | 20.40% | 1.70E-04 | 0.072 | 12.80% |
| IL-6 | IL6R | rs4133213 | 40 | 1 | 154 395 212 | A | C | 5.84E-17 | 0.100 | 39.40% | 0.07 | 1.83E-02 | 0.065 | 21.00% | 4.39E-05 | 0.187 | 41.80% | 2.94E-13 | 0.100 | 43.60% |
Effect allele is minor allele. P, β, EAF, and HetPval are P value, effect size, effect allele frequency, and Cochran's Q-test heterogeneity P value, respectively. There is no evidence of heterogeneity across ethnicities for the lead variants. Covariates included in the model: first 10 principal components, and the following measured at study entry: age, sex, natural log transformed CD4+ cell count, natural log transformed viral load, BMI, smoker baseline (missing in ESPRIT), hepatitis B virus (HBV), hepatitis C virus (HCV), diabetes and history of CVD. HCV was only used in IL-6 and D-dimer analyses, history of CVD was only used in hsCRP and IL-6 analyses, and history of diabetes was only used in D-dimer analysis. EAF, effect allele frequencies; hsCRP, high-sensitivity C-reactive protein; IL-6, interleukin-6.
The 77 identified SNPs in the CRP locus can be divided into two subsets with different effect sizes and ancestral frequencies (Supplemental Data 1, spreadsheet ‘CRP’). The most significant SNP in the first subset, rs6667499 (P value: P = 2.38 × 10⁻²⁵, effect size: β = 0.569), is located downstream of the CRP gene. Effect allele frequencies (EAF) for rs6667499 in transethnic, AFR, AMR, and EUR groups were 4.4, 16.9, 1.2, and 0.3%, respectively. Results for this SNP from AMR and EUR groups were not available because of low EAF (Table 1). The most significant SNP in the second subset was rs2794520 (P = 5.43 × 10⁻²⁴, β = −0.224), also located downstream of the CRP gene. EAF for rs2794520 in transethnic, AFR, AMR, and EUR groups were 30.9, 20, 35.6, and 34.3%, respectively (Table 1). As a result of the differences in effects and ethnic EAF, we treated the first subset of 32 SNPs as the first SAS of the CRP locus with rs6667499 as the lead SNP and the second subset of 45 SNPs as the second SAS with rs2794520 as the lead SNP. Within the second SAS, the variants can be further divided into two types: positive and negative β. The relationship between these variants were assessed by LDpair in LDlink [43] (Supplemental Figure 5A). In most cases (659 out of 664), the minor allele of rs3116635(G) (lead positive β group) commigrates with the major allele of rs2794520(C) (lead negative β group), explaining the opposite effect size associated with the minor alleles of the two variants (Supplemental Figure 5A). An additional variant, rs12093699, was identified as a EUR group-specific variant associated with hsCRP levels with P = 2.01 × 10−08 and β = 0.148 (Supplemental Data 1, Spreadsheet ‘CRP’). This variant is located downstream of the CRP gene and showed evidence of heterogeneity across ethnic groups (HetPval = 2.52 × 10−06) with AFR and AMR effect sizes equal to −0.118 and 0.037, respectively.
HNF1A intron variant, rs2393776 (P = 9.90 × 10⁻¹⁰, β = −0.129), is the lead variant of 34 SNPs at the HNF1A locus (Supplemental Data 1 Spreadsheet ‘HNF1A’). EAF for transethnic, AFR, AMR, and EUR groups were 38.6, 29.6, 45.4, and 40.9%, respectively (Table 1). Like the second SAS in the CRP locus, the HNF1A locus is made up of two sets of SNPs with opposite effects and in most cases (606 out of 619), the minor allele of rs11065394(G) (lead positive β) commigrates with the major allele of rs2393776(A) (lead negative β), explaining the difference in effect size associated with the minor alleles of the two variants (Supplemental Figure 5B). Six additional variants with a positive effect were identified within the HNF1A locus, reaching GWS in the EUR but not the transethnic analysis. The lead variant for this group, rs2264779 (P = 1.10 × 10−09, β = −0.155), exhibited heterogeneity between the ethnicities (HetPval = 1.41 × 10⁻³) with AFR and AMR effect sizes equal to −0.014 and −0.010, respectively (Supplemental Data 1 Spreadsheet ‘HNF1A’).
An APOE missense variant, rs429358 (P = 1.57 × 10⁻²², β = −0.282), was the lead variant in the APOE locus of 11 identified SNPs (Supplemental Data 1, Spreadsheet ‘APOE’). No evidence of heterogeneity was found across ethnicities. EAF for transethnic, AFR, AMR, and EUR datasets were 15.4, 22.9, 12.1, and 13.1%, respectively (Table 1).
Single nucleotide polymorphisms associated with levels of D-dimer
Twenty-one variants associated with D-dimer levels were identified at four loci for the transethnic group: Coagulation Factor III (F3), Coagulation factor V (F5), Fibrinogen Beta Chain (FGB), and Glucosaminyl (N-Acetyl) Transferase 1 (GCNT1) (Fig. 4b, Supplemental Data 2). There was no evidence of heterogeneity across ethnicities for any of the lead SNPs at these loci (Table 1). Due to the small sample size, not all loci could be identified in all ethnic groups (Supplemental Data 2, Supplemental Figure 3).
The variant, rs2022309 (P = 1.86 × 10⁻¹³, β = 0.092), upstream of the F3 gene, was the lead variant for the F3 locus of 17 SNPs. EAF for transethnic, AFR, AMR, and EUR groups were 23.3, 8.9, 26.8, and 28.1%, respectively (Table 1).
The only variant within the F5 loci, rs6025 (P = 3.57 × 10⁻¹¹, β = 0.257), is a nonsynonymous SNP in the F5 gene (Supplemental Data 2). EAF for the transethnic and EUR groups were 1.8 and 2.5%, respectively (Table 1). EAF for the AFR and AMR datasets were less than 1%. Therefore, they were not analyzed further.
A synonymous variant within the FGB gene, rs6056 (P = 5.61 × 10−09, β = −0.082), is the lead of two SNPs for the FGB locus (Supplemental Data 2). EAF of this variant in the transethnic AFR, AMR, and EUR groups were 16.3, 8.9, 15.4, and 19.2%, respectively (Table 1).
The variant, rs4745559 (P = 1.89 × 10−08, β = 0.085), downstream of the GCNT1 gene was the only variant in the GCNT1 locus to reach GWS with an EAF in the transethnic, AFR, AMR, and EUR datasets of 14.6, 17.3, 20.4 and 12.8%, respectively (Supplemental Data 2, Table 1)
In addition to these variants identified in the transethnic analysis, rs78474816, intronic to the Cation Channel Sperm Associated Auxiliary Subunit Gamma (CATSPERG) gene reached GWS in the AFR group (P = 4.22 × 10⁻¹², β = 1.379) and exhibited a high level of heterogeneity (HetPVal = 2.12 × 10⁻¹¹) across ethnicities with AMR and EUR effect sizes equal to 0.185 and −0.021, respectively (Supplemental Data 2, Supplemental Figure 3A).
Single nucleotide polymorphisms associated with interleukin-6 levels
Forty variants associated with IL-6 levels were identified within the IL6 Receptor (IL6R) locus (Fig. 4c, Supplemental Data 3). The lead SNP, rs4133213 (P = 5.84 × 10⁻¹⁷, β = 0.100), is an intronic variant in IL6R. EAF for transethnic, AFR, AMR, and EUR groups were 39.4, 21, 58.2, and 43.6, respectively (Table 1). Additionally, a subset of the variants (14 out of the 40), in strong linkage disequilibrium (LD) with each other, exhibited an opposite effect for their respective effect alleles and were in lower LD across ethnicities as compared with the lead and other variants within the locus. However, conditional analysis placed all 40 variants in the same group. LDpair revealed that in most cases (884 out of 1012), the minor allele of rs4133213(A) (top positive β) commigrates with the major allele of rs6427658(C) (top negative β), explaining the opposite effect of the minor alleles for the two variants (Supplemental Figure 5C). Due to the small sample size, IL6R could not be identified in AFR and AMR groups (Supplemental Data 3, Supplemental Figure 4).
In addition, rs76497186, downstream of noncoding RNA (ncRNA), PROX1-AS1 at chr1 : 213816733, reached GWS in the AFR group (P = 1.19 × 10−08, β = 0.823) and exhibited a high level of heterogeneity (HetPVal = 1.46 × 10−07) across ethnicities with AMR and EUR effect sizes equal to 0.0311 and −0.0086, respectively. An intronic variant in TRAPPC9, rs28368302, reached GWS in the AMR group (P = 3.43 × 10−08, β = −0.232) and also exhibited a high level of heterogeneity (HetPVal = 4.32 × 10−07) across ethnicities with AFR and EUR effect sizes equal to 0.025 and 0.004, respectively (Supplemental Data 3, Supplemental Figure 4A and B).
Discussion
In this study, multiple loci associated with hsCRP, D-dimer and IL-6 levels have been identified in PLWH. Data from three ethnically diverse HIV studies were combined to increase statistical power (Fig. 1). To mitigate the effect of confounding factors, we included age, sex, natural log transformed CD4+ cell count, natural log transformed viral load, BMI, smoker at baseline (missing in ESPRIT), hepatitis B virus (HBV), hepatitis C virus (HCV), diabetes and history of CVD as covariates in the GWAS analyses and many of these covariates have statistically significant effects on the biomarker levels of interest (Supplemental Figure 6).
A total of 183 variants within 8 loci associated with hsCRP, D-dimer, and IL-6 levels were identified. Not surprisingly, some lead variants in the transethnic group also reached GWS in EUR and/or AFR groups as EUR and AFR participants make up 66 and 25% of the total, respectively. These variants are more significant in the transethnic group than EUR/AFR groups in most cases except for the first SAS in the CRP locus associated with hsCRP level (Table 1). In addition, seven EUR group-specific variants associated with levels of hsCRP (six within HNF1A and one at the CRP locus), one AFR group-specific SNP (rs78474816) associated with D-dimer levels, as well as one AFR group-specific SNP (rs76497186) and one AMR-specific SNP (rs28368302) associated with IL-6 levels have been identified. All of these identified loci and the pathways and mechanism relevant to the regulation of biomarker levels were summarized in Supplemental Table 2.
Three loci (CRP, HNF1A, and APOE) associated with hsCRP levels in PLWH were identified. Previously, five loci (LEPR, IL6R, CRP, HNF1A, and APOE-CI-CII cluster) were identified from 17 967 participants [22] and 18 loci (metabolic related: APOC1, HNF1A, LEPR, GCKR, HNF4A, and PTPN2; immune system: CRP, IL6R, NLRP3, IL1F10, and IRF1; chronic inflammation: PPP1R3B, SALL1, PABPC4, ASCL1, RORA, and BCL7B) were identified from more than 80 000 participants [23] in the general population. Less loci have been identified in this HIV study, which could be the result of small sample size, leading to lower statistical power. HNF1A is a transcription factor, which can bind to the CRP promoter and the common coding variants of the HNF1A gene have been proven to be associated with multiple cardiovascular risk phenotypes [27,44,45]. APOE regulates CRP levels by complexing with activated C1q [28] and APOE gene variants have been shown to be related to coronary heart disease [46] (Supplemental Table 2).
In the current study, four loci (F3, F5, FGB, and GCNT1) associated with D-dimer levels were identified in PLWH. Previously, Smith et al.[24] reported that three genes (F3, F5, and FGA) were associated with D-dimer levels in healthy adults. Lange et al.[15] reported the FGG-10034C/T variant, was associated with higher plasma D-dimer levels in European-American adults. Our findings are consistent with these reports and extend them with the identification of FGB and GCNT1. FGB belongs to the same family as FGA and FGG and they are next to each other around 4q31.3. F3, F5, and FGB (FGA, FGG) belong to the complement and coagulation cascades pathway and regulate D-dimer and fibrinogen levels [24,47–50]. Another novel locus, GCNT1, is a member of the β-1,6-N-acetylglucosaminyltransferase gene family and GCNT1 knockout mice have been shown to have increased susceptibility to Mycobacterium tuberculosis infection and the complete deficiency of GCNT1 was associated with increased lung expression of the neutrophil chemoattractant CXCL2 [51]. Moreover, Notch signaling regulates Gcnt1-mediated core-2 O-glycosylation in activated T cells and the core-2 O-glycoform of CD43 could be a sensitive indicator of Notch signaling [52]. Furthermore, GCNT1 expression in prostate cancer positively correlates with cancer progression and prostate-specific antigen recurrence [53] (Supplemental Table 2). In addition, rs78474816 within CATSPERG was associated with D-dimer levels in the AFR but not the transethnic group. Although this variant was detected in a limited number of participants, it still reached GWS because of its strong effect. Although CATSPERG is associated with CATSPER1 channel protein, only expressed in testis [54], seems irrelevant to D-dimer levels, rs78474816 is also located upstream of PSMD8 (Proteasome 26S Subunit, non-ATPase 8), which encodes a non-ATPase subunit of the 19S regulator. As the proteasome participates in the protein degradation process [55] and HIV can interact with proteasome via Tat [56–58], vif [59–62] and integrase [63], this variant might play an important role in regulation of D-dimer in PLWH.
Forty variants, led by rs4133213, within the IL6R locus were associated with IL-6 levels in the transethnic group. The variant rs4133213 has previously been identified associated with plasma sIL-6R levels with rs2228145 as the lead variant [64]. Interestingly, we found that variant rs2228145 was in high LD with the lead SNP, rs4133213 (Supplemental Figure 7) and also highly significant in our study. SNP rs2228145 is a missense variant (p.ASP358Ala) within IL6R. It has been reported to modulate IL-6 levels using a total of 1979 older Chinese individuals aged 50–92 years [25], associated with IL-6 levels and sIL-6R in both African Americans and European Americans [65] and in a study of 1273 participants from the InCHIANTI Italian cohort [66]. The increased level of IL-6 could be the result of increased levels of sIL-6R as the binding of IL-6 by sIL-6R could protect IL-6 from degradation. When IL-6 binds to sIL-6R, it can trigger the trans-signaling pathway, which is responsible for the pro-inflammatory action of IL-6 [67]. Blockade of the IL6R signaling seems to have a causal role in the development of coronary heart disease in the general population and inhibition of IL6R is proposed as a target for prevention of CHD [68,69]. In addition to the IL6R locus identified in the transethnic group, two novel ethnic-specific loci associated with IL-6 levels have been identified: one variant (rs76497186) downstream of a ncRNA, PROX1-AS1, in the AFR group and one intronic variant (rs28368302) within TRAPPC9 in the AMR group. PROX1_AS1 is located upstream of PROX1, which is a homeodomain transcription factor expressed in various tissues during mouse development including young neurons of the subventricular region of the CNS, developing eye lens, pancreas, liver, heart, and transiently in the skeletal muscles [70]. Prox1 and vascular endothelial growth factor receptor-3 (VEGFR-3) are two primary mediators of lymphangiogenesis. Prox1 can be activated by NF-kB pathway, which is induced by inflammatory stimuli. Prox1 can then increase the expression of the VEGFR-3 in lymphatic endothelial cells, leading to the enhanced responsiveness of preexisting lymphatic endothelium to VEGFR-3-specific VEGF (VEGF-C and VEGF-D) [71]. TRAPPC9 has been shown to enhance the NF-kB signaling pathway [72–74] and IL-6 gene expression can be activated through the NF-kB transcription factor [75]. IL-6 was previously found to be correlated with blood pressure in male individuals with essential hypertension [76] and hypomethylation of IL-6 promoter was associated with prehypertension in young adults [77]. Consistently, two intronic SNPs within TRAPPC9 (rs10088725 and rs6578061) were identified to be associated with blood pressure within 750 000 trans-ethnic subjects [78]. It is possible that TRAPPC9 regulates blood pressure via regulation of IL-6 expression. In addition, the variant rs11166927 in the TRAPPC9 region has also been identified to be associated with nonalcoholic fatty liver disease in Hispanic boys [79]. This could be caused by the effect of TRAPPC9 on IL-6 via NF-κB.
In conclusion, multiple SNPs were associated with levels of hsCRP, D-dimer, and IL-6 in PLWH from three ethnically diverse studies. Most loci have been identified in the general population. However, five novel loci have also been found to be associated with D-dimer levels (FGB and GCNT1 in the transethnic group, and CATSPERG in the AFR group) and IL-6 levels (PROX1-AS1 in the AFR group and TRAPPC9 in the AMR group). These findings support the hypothesis that host genetics may partially contribute to chronic inflammation in HIV+ individuals. Given the link between these biomarkers and serious non-AIDS complications, further exploration of the relationship between these 11 loci and the events may help to identify potential targets for intervention.
Acknowledgements
We thank Ms Ju Qiu and Dr Xiaoli Jiao in LHRI for scientific discussion, Dr Norman Gerry in Advanced BioMedical Laboratory for generation of genotyping data, and Ms Shweta Sharma Mistry, Ms Jacqueline Nordwall, Ms Deborah Wentworth and Mr Greg Thompson at the University of Minnesota for providing participant biomarker and other clinically relevant data.
This project was funded in whole or in part with federal funds from the National Cancer Institute, NIH under contract no. HHSN261200800001E. The project is also supported in part by other NIH grants UM1-AI068641, UM1-AI120197, 1U01-AI36780, U01-AI046362, U01-AI042170 and U01-AI46957.
The content of this publication does not necessarily reflect the views or policies of the US Department of Health and Human Services nor does mention of trade names, commercial products, or organizations imply endorsement by the US government. This research was supported in part by the National Institute of Allergy and Infectious Disease.
B.S. and X.H. analyzed data and wrote manuscript draft, K.S. intellectually involved in the project design and wrote manuscript draft, J.N. and J.L. intellectually involved in the project design, L.H. analyzed data and wrote the draft manuscript, A.W.R. measured biomarker levels, T.I. was intellectually involved in the project and reviewed the manuscript, W.C. oversaw data analysis and wrote the manuscript, H.C.L. designed, oversaw the project and wrote the manuscript. We are grateful to all study participants and all investigators of the ESPRIT, SMART and START Study groups. Please see N Engl J Med 2009; 361 : 1548-59 for the complete list of ESPRIT investigators; N Engl J Med 2006; 355 : 2283-96 for the complete list of SMART investigators; and N Engl J Med 2015; 373 : 795-807 for the complete list of START investigators.
Conflicts of interest
There are no conflicts of interest.
Supplementary Material
Supplementary Material
Supplementary Material
Supplementary Material
Footnotes
Brad T. Sherman and Xiaojun Hu contributed equally in this project.
Current affiliation: Plant Germplasm Quarantine Program, United States Department of Agriculture, Beltsville, Maryland, USA.
References
- 1.Antiretroviral Therapy Cohort Collaboration. Causes of death in HIV-1-infected patients treated with antiretroviral therapy, 1996–2006: collaborative analysis of 13 HIV cohort studies. Clin Infect Dis 2010; 50:1387–1396. [DOI] [PMC free article] [PubMed] [Google Scholar]
- 2.Lundgren JD, Babiker AG, Gordin F, Emery S, Grund B, et al. INSIGHT START Study Group. Initiation of antiretroviral therapy in early asymptomatic HIV infection. N Engl J Med 2015; 373:795–807. [DOI] [PMC free article] [PubMed] [Google Scholar]
- 3.Kuller LH, Tracy R, Belloso W, De Wit S, Drummond F, Lane HC, et al. INSIGHT SMART Study Group. Inflammatory and coagulation biomarkers and mortality in patients with HIV infection. PLoS Med 2008; 5:e203. [DOI] [PMC free article] [PubMed] [Google Scholar]
- 4.Grund B, Baker JV, Deeks SG, Wolfson J, Wentworth D, Cozzi-Lepri A, et al. INSIGHT SMART/ESPRIT/SILCAAT Study Group. Relevance of interleukin-6 and d-dimer for serious non-AIDS morbidity and death among HIV-positive adults on suppressive antiretroviral therapy. PLoS One 2016; 11:e0155100. [DOI] [PMC free article] [PubMed] [Google Scholar]
- 5.Danesh J, Kaptoge S, Mann AG, Sarwar N, Wood A, Angleman SB, et al. Long-term interleukin-6 levels and subsequent risk of coronary heart disease: two new prospective studies and a systematic review. PLoS Med 2008; 5:e78. [DOI] [PMC free article] [PubMed] [Google Scholar]
- 6.Danesh J, Whincup P, Walker M, Lennon L, Thomson A, Appleby P, et al. Fibrin D-dimer and coronary heart disease: prospective study and meta-analysis. Circulation 2001; 103:2323–2327. [DOI] [PubMed] [Google Scholar]
- 7.Kaptoge S, Di Angelantonio E, Lowe G, Pepys MB, Thompson SG, et al. The Emerging Risk Factors Collaboration. C-reactive protein concentration and risk of coronary heart disease, stroke, and mortality: an individual participant meta-analysis. Lancet 2010; 375:132–140. [DOI] [PMC free article] [PubMed] [Google Scholar]
- 8.Li Y, Zhong X, Cheng G, Zhao C, Zhang L, Hong Y, et al. Hs-CRP and all-cause, cardiovascular, and cancer mortality risk: a meta-analysis. Atherosclerosis 2017; 259:75–82. [DOI] [PubMed] [Google Scholar]
- 9.Gilotra TS, Geraci SA. C-reactive protein as an independent cardiovascular risk predictor in HIV+ patients: a focused review of published studies. J Clin Med Res 2017; 9:891–899. [DOI] [PMC free article] [PubMed] [Google Scholar]
- 10.Savvoulidis P, Butler J, Kalogeropoulos A. Cardiomyopathy and heart failure in patients with HIV infection. Can J Cardiol 2019; 35:299–309. [DOI] [PubMed] [Google Scholar]
- 11.Nasi M, De Biasi S, Gibellini L, Bianchini E, Pecorini S, Bacca V, et al. Ageing and inflammation in patients with HIV infection. Clin Exp Immunol 2017; 187:44–52. [DOI] [PMC free article] [PubMed] [Google Scholar]
- 12.Baker JV, Sharma S, Grund B, Rupert A, Metcalf JA, Schechter M, et al. Systemic inflammation, coagulation, and clinical risk in the START Trial. Open Forum Infect Dis 2017; 4:ofx262. [DOI] [PMC free article] [PubMed] [Google Scholar]
- 13.Neuhaus J, Jacobs DR, Jr, Baker JV, Calmy A, Duprez D, La Rosa A, et al. Markers of inflammation, coagulation, and renal function are elevated in adults with HIV infection. J Infect Dis 2010; 201:1788–1795. [DOI] [PMC free article] [PubMed] [Google Scholar]
- 14.Bennermo M, Held C, Ericsson CG, Silveira A, Hamsten A, Tornvall P. Genotype-specific increase in plasma concentrations of activated coagulation factor VII in response to experimental inflammation. A link between infection and acute myocardial infarction?. Thromb Haemost 2005; 94:427–431. [DOI] [PubMed] [Google Scholar]
- 15.Lange LA, Reiner AP, Carty CL, Jenny NS, Cushman M, Lange EM. Common genetic variants associated with plasma fibrin D-dimer concentration in older European- and African-American adults. J Thromb Haemost 2008; 6:654–659. [DOI] [PubMed] [Google Scholar]
- 16.Ekenberg C, Tang MH, Zucco AG, Murray DD, MacPherson CR, Hu X, et al. Association between single-nucleotide polymorphisms in HLA alleles and human immunodeficiency virus type 1 viral load in demographically diverse, antiretroviral therapy-naive participants from the Strategic Timing of AntiRetroviral Treatment Trial. J Infect Dis 2019; 220:1325–1334. [DOI] [PMC free article] [PubMed] [Google Scholar]
- 17.McLaren PJ, Coulonges C, Bartha I, Lenz TL, Deutsch AJ, Bashirova A, et al. Polymorphisms of large effect explain the majority of the host genetic contribution to variation of HIV-1 virus load. Proc Natl Acad Sci U S A 2015; 112:14658–14663. [DOI] [PMC free article] [PubMed] [Google Scholar]
- 18.van Manen D, van ’t Wout AB, Schuitemaker H. Genome-wide association studies on HIV susceptibility, pathogenesis and pharmacogenomics. Retrovirology 2012; 9:70. [DOI] [PMC free article] [PubMed] [Google Scholar]
- 19.Mayerle J, den Hoed CM, Schurmann C, Stolk L, Homuth G, Peters MJ, et al. Identification of genetic loci associated with Helicobacter pylori serologic status. JAMA 2013; 309:1912–1920. [DOI] [PubMed] [Google Scholar]
- 20.Wojcik GL, Marie C, Abhyankar MM, Yoshida N, Watanabe K, Mentzer AJ, et al. Genome-wide association study reveals genetic link between diarrhea-associated entamoeba histolytica infection and inflammatory bowel disease. mBio 2018; 9:e01668-18. [DOI] [PMC free article] [PubMed] [Google Scholar]
- 21.Nagao Y, Nishida N, Toyo-Oka L, Kawaguchi A, Amoroso A, Carrozzo M, et al. Genome-wide association study identifies risk variants for Lichen Planus in patients with hepatitis C virus infection. Clin Gastroenterol Hepatol 2017; 15:937.e5–944.e5. [DOI] [PubMed] [Google Scholar]
- 22.Elliott P, Chambers JC, Zhang W, Clarke R, Hopewell JC, Peden JF, et al. Genetic Loci associated with C-reactive protein levels and risk of coronary heart disease. JAMA 2009; 302:37–48. [DOI] [PMC free article] [PubMed] [Google Scholar]
- 23.Dehghan A, Dupuis J, Barbalic M, Bis JC, Eiriksdottir G, Lu C, et al. Meta-analysis of genome-wide association studies in >80 000 subjects identifies multiple loci for C-reactive protein levels. Circulation 2011; 123:731–738. [DOI] [PMC free article] [PubMed] [Google Scholar]
- 24.Smith NL, Huffman JE, Strachan DP, Huang J, Dehghan A, Trompet S, et al. Genetic predictors of fibrin D-dimer levels in healthy adults. Circulation 2011; 123:1864–1872. [DOI] [PMC free article] [PubMed] [Google Scholar]
- 25.Jiang CQ, Lam TH, Liu B, Lin JM, Yue XJ, Jin YL, et al. Interleukin-6 receptor gene polymorphism modulates interleukin-6 levels and the metabolic syndrome: GBCS-CVD. Obesity (Silver Spring) 2010; 18:1969–1974. [DOI] [PubMed] [Google Scholar]
- 26.Nimptsch K, Aleksandrova K, Boeing H, Janke J, Lee YA, Jenab M, et al. Association of CRP genetic variants with blood concentrations of C-reactive protein and colorectal cancer risk. Int J Cancer 2015; 136:1181–1192. [DOI] [PMC free article] [PubMed] [Google Scholar]
- 27.Odom DT, Zizlsperger N, Gordon DB, Bell GW, Rinaldi NJ, Murray HL, et al. Control of pancreas and liver gene expression by HNF transcription factors. Science 2004; 303:1378–1381. [DOI] [PMC free article] [PubMed] [Google Scholar]
- 28.Yin C, Ackermann S, Ma Z, Mohanta SK, Zhang C, Li Y, et al. ApoE attenuates unresolvable inflammation by complex formation with activated C1q. Nat Med 2019; 25:496–506. [DOI] [PMC free article] [PubMed] [Google Scholar]
- 29.Besser REJ, Jones J, McDonald TJ, Smith R, Shepherd MH, Hattersley AT. Using highly sensitive C-reactive protein measurement to diagnose MODY in a family with suspected type 2 diabetes. BMJ Case Rep 2012; bcr0120125612. [DOI] [PMC free article] [PubMed] [Google Scholar]
- 30.INSIGHT-ESPRIT Study Group, SILCAAT Scientific Committee, Abrams D, Levy Y, Losso MH, Babiker A, et al. Interleukin-2 therapy in patients with HIV infection. N Engl J Med 2009; 361:1548–1559. [DOI] [PMC free article] [PubMed] [Google Scholar]
- 31.El-Sadr WM, Lundgren J, Neaton JD, Gordin F, Abrams D, et al. Strategies for Management of Antiretroviral Therapy (SMART) Study Group. CD4+ count-guided interruption of antiretroviral treatment. N Engl J Med 2006; 355:2283–2296. [DOI] [PubMed] [Google Scholar]
- 32.Purcell S, Neale B, Todd-Brown K, Thomas L, Ferreira MA, Bender D, et al. PLINK: a tool set for whole-genome association and population-based linkage analyses. Am J Hum Genet 2007; 81:559–575. [DOI] [PMC free article] [PubMed] [Google Scholar]
- 33.Alexander DH, Novembre J, Lange K. Fast model-based estimation of ancestry in unrelated individuals. Genome Res 2009; 19:1655–1664. [DOI] [PMC free article] [PubMed] [Google Scholar]
- 34.Ihaka R, Gentleman R. R: a language for data analysis and graphics. J Comput Graph Stat 1996; 5:299–314. [Google Scholar]
- 35.Borges AH, O’Connor JL, Phillips AN, Baker JV, Vjecha MJ, Losso MH, et al. Factors associated with D-dimer levels in HIV-infected individuals. PLoS One 2014; 9:e90978. [DOI] [PMC free article] [PubMed] [Google Scholar]
- 36.Borges AH, O’Connor JL, Phillips AN, Ronsholt FF, Pett S, Vjecha MJ, et al. Factors associated with plasma IL-6 levels during HIV infection. J Infect Dis 2015; 212:585–595. [DOI] [PMC free article] [PubMed] [Google Scholar]
- 37.De Luca A, de Gaetano Donati K, Colafigli M, Cozzi-Lepri A, De Curtis A, Gori A, et al. The association of high-sensitivity c-reactive protein and other biomarkers with cardiovascular disease in patients treated for HIV: a nested case-control study. BMC Infect Dis 2013; 13:414. [DOI] [PMC free article] [PubMed] [Google Scholar]
- 38.Willer CJ, Li Y, Abecasis GR. METAL: fast and efficient meta-analysis of genomewide association scans. Bioinformatics 2010; 26:2190–2191. [DOI] [PMC free article] [PubMed] [Google Scholar]
- 39.Yang J, Weedon MN, Purcell S, Lettre G, Estrada K, Willer CJ, et al. GIANT Consortium. Genomic inflation factors under polygenic inheritance. Eur J Hum Genet 2011; 19:807–812. [DOI] [PMC free article] [PubMed] [Google Scholar]
- 40.Yin L, Kant DH. [[Accessed 26 April 2019]]. Available at: https://github.com/YinLiLin/R-CMplot. [Google Scholar]
- 41.Vuong H, Che A, Ravichandran S, Luke BT, Collins JR, Mudunuri US. AVIA v2.0: annotation, visualization and impact analysis of genomic variants and genes. Bioinformatics 2015; 31:2748–2750. [DOI] [PMC free article] [PubMed] [Google Scholar]
- 42.Ning Z, Lee Y, Joshi PK, Wilson JF, Pawitan Y, Shen X. A selection operator for summary association statistics reveals allelic heterogeneity of complex traits. Am J Hum Genet 2017; 101:903–912. [DOI] [PMC free article] [PubMed] [Google Scholar]
- 43.Machiela MJ, Chanock SJ. LDlink: a web-based application for exploring population-specific haplotype structure and linking correlated alleles of possible functional variants. Bioinformatics 2015; 31:3555–3557. [DOI] [PMC free article] [PubMed] [Google Scholar]
- 44.Reiner AP, Gross MD, Carlson CS, Bielinski SJ, Lange LA, Fornage M, et al. Common coding variants of the HNF1A gene are associated with multiple cardiovascular risk phenotypes in community-based samples of younger and older European-American adults: the Coronary Artery Risk Development in Young Adults Study and The Cardiovascular Health Study. Circ Cardiovasc Genet 2009; 2:244–254. [DOI] [PMC free article] [PubMed] [Google Scholar]
- 45.Armendariz AD, Krauss RM. Hepatic nuclear factor 1-alpha: inflammation, genetics, and atherosclerosis. Curr Opin Lipidol 2009; 20:106–111. [DOI] [PubMed] [Google Scholar]
- 46.Xu M, Zhao J, Zhang Y, Ma X, Dai Q, Zhi H, et al. Apolipoprotein E gene variants and risk of coronary heart disease: a meta-analysis. Biomed Res Int 2016; 2016:3912175. [DOI] [PMC free article] [PubMed] [Google Scholar]
- 47.Raffield LM, Zakai NA, Duan Q, Laurie C, Smith JD, Irvin MR, et al. NHLBI Trans-Omics for Precision Medicine (TOPMed) Consortium, Hematology & Hemostasis TOPMed Working Group∗. D-Dimer in African Americans: whole genome sequence analysis and relationship to cardiovascular disease risk in the Jackson Heart Study. Arterioscler Thromb Vasc Biol 2017; 37:2220–2227. [DOI] [PMC free article] [PubMed] [Google Scholar]
- 48.Zaleski AL, Pescatello LS, Thompson PD, Taylor BA. Protective effect of compression socks in a marathon runner with a genetic predisposition to thrombophilia due to Factor V Leiden. Phys Sportsmed 2015; 43:324–327. [DOI] [PubMed] [Google Scholar]
- 49.de Moerloose P, Casini A, Neerman-Arbez M. Congenital fibrinogen disorders: an update. Semin Thromb Hemost 2013; 39:585–595. [DOI] [PubMed] [Google Scholar]
- 50.Danik JS, Pare G, Chasman DI, Zee RY, Kwiatkowski DJ, Parker A, et al. Novel loci, including those related to Crohn disease, psoriasis, and inflammation, identified in a genome-wide association study of fibrinogen in 17 686 women: the Women's Genome Health Study. Circ Cardiovasc Genet 2009; 2:134–141. [DOI] [PMC free article] [PubMed] [Google Scholar]
- 51.Fonseca KL, Maceiras AR, Matos R, Simoes-Costa L, Sousa J, Cá B, et al. Deficiency in the glycosyltransferase Gcnt1 increases susceptibility to tuberculosis through a mechanism involving neutrophils. Mucosal Immunol 2020; 13:836–848. [DOI] [PMC free article] [PubMed] [Google Scholar]
- 52.Perkey E, Maurice De Sousa D, Carrington L, Chung J, Dils A, Granadier D, et al. GCNT1-mediated O-glycosylation of the Sialomucin CD43 is a sensitive indicator of notch signaling in activated T cells. J Immunol 2020; 204:1674–1688. [DOI] [PMC free article] [PubMed] [Google Scholar]
- 53.Kojima Y, Yoneyama T, Hatakeyama S, Mikami J, Sato T, Mori K, et al. Detection of Core2 beta-1,6-N-acetylglucosaminyltransferase in post-digital rectal examination urine is a reliable indicator for extracapsular extension of prostate cancer. PLoS One 2015; 10:e0138520. [DOI] [PMC free article] [PubMed] [Google Scholar]
- 54.Wang H, Liu J, Cho KH, Ren D. A novel, single, transmembrane protein CATSPERG is associated with CATSPER1 channel protein. Biol Reprod 2009; 81:539–544. [DOI] [PMC free article] [PubMed] [Google Scholar]
- 55.Driscoll J, Finley D. A controlled breakdown: antigen processing and the turnover of viral proteins. Cell 1992; 68:823–825. [DOI] [PubMed] [Google Scholar]
- 56.Seeger M, Ferrell K, Frank R, Dubiel W. HIV-1 tat inhibits the 20 S proteasome and its 11 S regulator-mediated activation. J Biol Chem 1997; 272:8145–8148. [DOI] [PubMed] [Google Scholar]
- 57.Huang X, Seifert U, Salzmann U, Henklein P, Preissner R, Henke W, et al. The RTP site shared by the HIV-1 Tat protein and the 11S regulator subunit alpha is crucial for their effects on proteasome function including antigen processing. J Mol Biol 2002; 323:771–782. [DOI] [PubMed] [Google Scholar]
- 58.Apcher GS, Heink S, Zantopf D, Kloetzel PM, Schmid HP, Mayer RJ, et al. Human immunodeficiency virus-1 Tat protein interacts with distinct proteasomal alpha and beta subunits. FEBS Lett 2003; 553:200–204. [DOI] [PubMed] [Google Scholar]
- 59.Conticello SG, Harris RS, Neuberger MS. The Vif protein of HIV triggers degradation of the human antiretroviral DNA deaminase APOBEC3G. Curr Biol 2003; 13:2009–2013. [DOI] [PubMed] [Google Scholar]
- 60.Lecossier D, Bouchonnet F, Clavel F, Hance AJ. Hypermutation of HIV-1 DNA in the absence of the Vif protein. Science 2003; 300:1112. [DOI] [PubMed] [Google Scholar]
- 61.Madani N, Kabat D. An endogenous inhibitor of human immunodeficiency virus in human lymphocytes is overcome by the viral Vif protein. J Virol 1998; 72:10251–10255. [DOI] [PMC free article] [PubMed] [Google Scholar]
- 62.Simon JH, Gaddis NC, Fouchier RA, Malim MH. Evidence for a newly discovered cellular anti-HIV-1 phenotype. Nat Med 1998; 4:1397–1400. [DOI] [PubMed] [Google Scholar]
- 63.Mulder LC, Muesing MA. Degradation of HIV-1 integrase by the N-end rule pathway. J Biol Chem 2000; 275:29749–29753. [DOI] [PubMed] [Google Scholar]
- 64.van Dongen J, Jansen R, Smit D, Hottenga JJ, Mbarek H, Willemsen G, et al. The contribution of the functional IL6R polymorphism rs2228145, eQTLs and other genome-wide SNPs to the heritability of plasma sIL-6R levels. Behav Genet 2014; 44:368–382. [DOI] [PMC free article] [PubMed] [Google Scholar]
- 65.Reich D, Patterson N, Ramesh V, De Jager PL, McDonald GJ, Tandon A, et al. Health, Aging and Body Composition (Health ABC) Study. Admixture mapping of an allele affecting interleukin 6 soluble receptor and interleukin 6 levels. Am J Hum Genet 2007; 80:716–726. [DOI] [PMC free article] [PubMed] [Google Scholar]
- 66.Rafiq S, Frayling TM, Murray A, Hurst A, Stevens K, Weedon MN, et al. A common variant of the interleukin 6 receptor (IL-6r) gene increases IL-6r and IL-6 levels, without other inflammatory effects. Genes Immun 2007; 8:552–559. [DOI] [PMC free article] [PubMed] [Google Scholar]
- 67.Schett G. Physiological effects of modulating the interleukin-6 axis. Rheumatology (Oxford) 2018; 57: Suppl_2: ii43–ii50. [DOI] [PubMed] [Google Scholar]
- 68.Sarwar N, Butterworth AS, Freitag DF, Gregson J, Willeit P, et al. IL6R Genetics Consortium Emerging Risk Factors Collaboration. Interleukin-6 receptor pathways in coronary heart disease: a collaborative meta-analysis of 82 studies. Lancet 2012; 379:1205–1213. [DOI] [PMC free article] [PubMed] [Google Scholar]
- 69.Swerdlow DI, Holmes MV, Kuchenbaecker KB, Engmann JE, Shah T, Sofat R, et al. Interleukin-6 Receptor Mendelian Randomisation Analysis (IL6R MR) Consortium. The interleukin-6 receptor as a target for prevention of coronary heart disease: a mendelian randomisation analysis. Lancet 2012; 379:1214–1224. [DOI] [PMC free article] [PubMed] [Google Scholar]
- 70.Oliver G, Sosa-Pineda B, Geisendorf S, Spana EP, Doe CQ, Gruss P. Prox 1, a prospero-related homeobox gene expressed during mouse development. Mech Dev 1993; 44:3–16. [DOI] [PubMed] [Google Scholar]
- 71.Flister MJ, Wilber A, Hall KL, Iwata C, Miyazono K, Nisato RE, et al. Inflammation induces lymphangiogenesis through up-regulation of VEGFR-3 mediated by NF-kappaB and Prox1. Blood 2010; 115:418–429. [DOI] [PMC free article] [PubMed] [Google Scholar]
- 72.Zhang Y, Liu S, Wang H, Yang W, Li F, Yang F, et al. Elevated NIBP/TRAPPC9 mediates tumorigenesis of cancer cells through NF(B signaling. Oncotarget 2015; 6:6160–6178. [DOI] [PMC free article] [PubMed] [Google Scholar]
- 73.Qin M, Zhang J, Xu C, Peng P, Tan L, Liu S, et al. Knockdown of NIK and IKKβ0-binding protein (NIBP) reduces colorectal cancer metastasis through down-regulation of the canonical NF-κB signaling pathway and suppression of MAPK signaling mediated through ERK and JNK. PLoS One 2017; 12:e0170595. [DOI] [PMC free article] [PubMed] [Google Scholar]
- 74.Hu WH, Pendergast JS, Mo XM, Brambilla R, Bracchi-Ricard V, Li F, et al. NIBP, a novel NIK and IKK(beta)-binding protein that enhances NF-(kappa)B activation. J Biol Chem 2005; 280:29233–29241. [DOI] [PMC free article] [PubMed] [Google Scholar]
- 75.Libermann TA, Baltimore D. Activation of interleukin-6 gene expression through the NF-kappa B transcription factor. Mol Cell Biol 1990; 10:2327–2334. [DOI] [PMC free article] [PubMed] [Google Scholar]
- 76.Gibas-Dorna M, Nowak D, Piatek J, Pupek-Musialik D, Krauss H, Kopczynski P. Plasma ghrelin and interleukin-6 levels correlate with body mass index and arterial blood pressure in males with essential hypertension. J Physiol Pharmacol 2015; 66:367–372. [PubMed] [Google Scholar]
- 77.Omar W, Abdullah A, Talib NA, Shah ASM, Rahman JA. Leucocytic DNA methylation of interleukin-6 promoter reduction in pre-hypertensive young adults. Malays J Med Sci 2019; 26:46–54. [DOI] [PMC free article] [PubMed] [Google Scholar]
- 78.Giri A, Hellwege JN, Keaton JM, Park J, Qiu C, Warren HR, et al. Trans-ethnic association study of blood pressure determinants in over 750,000 individuals. Nat Genet 2019; 51:51–62. [DOI] [PMC free article] [PubMed] [Google Scholar]
- 79.Wattacheril J, Lavine JE, Chalasani NP, Guo X, Kwon S, Schwimmer J, et al. Genome-wide associations related to hepatic histology in nonalcoholic fatty liver disease in Hispanic boys. J Pediatr 2017; 190:100.e2–107.e2. [DOI] [PMC free article] [PubMed] [Google Scholar]
Associated Data
This section collects any data citations, data availability statements, or supplementary materials included in this article.