

Abstract
Single-cell RNA sequencing (scRNASeq) has advanced our understanding of lung biology, but its utility is limited by the need for fresh samples, loss of cell types by death or inadequate dissociation, and transcriptional stress responses induced during tissue digestion. Single-nucleus RNA sequencing (snRNASeq) has addressed these deficiencies in other tissues, but no protocol exists for lung tissue. We present a snRNASeq protocol and compare its results with those of scRNASeq. Two nuclear suspensions were prepared in lysis buffer on ice while one cell suspension was generated using enzymatic and mechanical dissociation. Cells and nuclei were processed using the 10× Genomics platform, and sequencing data were analyzed by Seurat. A total of 16,110 single-nucleus and 11,934 single-cell transcriptomes were generated. Gene detection rates were equivalent in snRNASeq and scRNASeq (∼1,700 genes and 3,000 unique molecular identifiers per cell) when mapping intronic and exonic reads. In the combined data, 89% of epithelial cells were identified by snRNASeq versus 22.2% of immune cells. snRNASeq transcriptomes are enriched for transcription factors and signaling proteins, with reduction in mitochondrial and stress-response genes. Both techniques improved mesenchymal cell detection over previous studies. Homeostatic signaling relationships among alveolar cell types were defined by receptor–ligand mapping using snRNASeq data, revealing interplay among epithelial, mesenchymal, and capillary endothelial cells. snRNASeq can be applied to archival murine lung samples, improves dissociation bias, eliminates artifactual gene expression, and provides similar gene detection compared with scRNASeq.
Keywords: transcriptomics, single cell, bioinformatics
The emergence of single-cell RNA-sequencing (scRNASeq) technologies in the last decade has led to a rapid phase of discovery in lung research, including the identification of ionocytes in airway epithelium and the characterization of profibrotic macrophages and aberrant basaloid cells in idiopathic pulmonary fibrosis (1–3). An emerging alternative to scRNASeq is single-nucleus RNA sequencing (snRNASeq), which generates transcriptomic information from isolated nuclei. This approach has previously been reported in brain (4–6) and kidney (7), and unlike scRNASeq, it can be readily applied to cryopreserved, archival samples.
Notably, there are additional potential advantages to snRNASeq. Depending on conditions, dissociation protocols used to generate single-cell suspensions in adult tissues can underrepresent fragile cell types or fail to liberate matrix-embedded mesenchymal cells. Indeed, scRNASeq data from prior studies in mouse and human lung have shown bias toward immune cell types, with underrepresentation of airway/alveolar epithelial cells and fibroblasts (8, 9), populations that are key drivers of pathologies such as fibrosis (10). In addition, snRNASeq reduces sequencing of housekeeping and mitochondrial genes in favor of cell identity–relevant genes such as transcription factors and long noncoding RNA, which may improve cell-type differentiation versus scRNASeq at a given read depth (6, 7). Although mRNA in the nucleus is often incompletely processed and gene detection rates in snRNASeq are poor when mapped to exons alone, previous studies suggest that its performance matches that of scRNASeq when intronic reads are included during alignment (6, 7).
Here, we modified an existing protocol for the isolation of human lung nuclei, which was developed for the Human Cell Atlas (11), for cryopreserved mouse lung, such that a FACS purification step was unnecessary. In parallel, we generated single-cell suspensions from healthy mouse lung. We compared results head to head in terms of sensitivity, cell representation, transcriptional stress response, and differential gene exp‐ression and characterized fibroblast diversity and intercellular receptor–ligand signaling in our data.
Some of the results of these studies have been previously reported in the form of a preprint (bioRxiv, 07 March 2020 https://doi.org/10.1101/2020.03.06.981407).
Methods
Single-Cell Preparation from Fresh Mouse Lung
Single-cell suspensions were obtained from the lungs of one wild-type adult C57Bl/6J mouse by combined enzymatic and mechanical dissociation (GentleMacs; Miltenyibiotec), essentially as described (12). To clear debris, red blood cells (RBCs), and dead cells, the cell suspension was applied to an OptiPrep density gradient with 12%, 18%, and 30% layers and centrifuged for 15 min at 600 × g. All cells above the RBC layer were removed, diluted in 50 ml PBS, centrifuged again at 1,000 × g for 20 min, washed in 50 ml PBS + 0.1% BSA, counted, and diluted to 10,000 cells/μl. For 10× Chromium, 10,000 cells were loaded per lane.
Single-Nucleus Preparation from Frozen Mouse Lung
Lung tissue from two wild-type adult C57Bl/6J mice was isolated at death, snap-frozen in liquid nitrogen, and stored at −80°C. Nuclei were prepared from frozen tissue under RNAse-free conditions by a method adapted from an existing protocol (11). Briefly, samples were cut to ∼7 mm pieces, injected (26G needle) with 1 ml ice-cold Nuclei EZ Lysis buffer (NUC-101; Sigma-Aldrich) supplemented with protease (589279100; Roche) and ribonuclease (RNase) (N2615; Promega and AM2696; Life Technologies) inhibitors (250 U/ml RNasein Plus and 125 U/ml SUPERaseIN), minced to 1–2 mm pieces with scissors in a weigh boat with 1 ml additional supplemented lysis buffer, then transferred to a GentleMacs C tube. The GentleMacs lung1 and lung2 programs were run in sequence, and the latter stopped after 20 seconds. Foam was spun down for 1 minute at 750 × g. The suspension was passed through a 40-μm cell strainer and washed with 4 ml cold PBS with 0.1% BSA, 125 U/ml RNasein Plus, and 62.5 U/ml SUPERaseIN and then passed through a 5-μm filter (pluriSelect). Nuclei were pelleted at 500 × g; resuspended in 1 × PBS with 0.1% BSA, 250 U/ml RNasein Plus, and 125 U/ml SUPERaseIN; counted by hemocytometer; and diluted to 10,000 nuclei/μl. For 10× Chromium, 10,000 nuclei were loaded per lane.
Library Preparation and Sequencing
The 10× Chromium libraries were prepared according to manufacturer protocol (10× Genomics) using 3′V3 kits and were submitted for sequencing through the Washington University Genome Technology Access Center on a NovaSeq S4 flow cell to a depth of 50,000 reads/cell. Raw sequencing data were processed using the zUMIs pipeline (13), with removal of low-quality barcodes followed by mapping of the remaining barcodes to the mouse genome (mm10) using STAR 2.5.3a. Expression matrices containing intronic, exonic, and intronic+exonic reads were generated for both scRNASeq and snRNASeq data. Further informatics analyses are detailed in the data supplement.
Data Availability
The accession number for the RNA-sequencing data reported in this paper is National Center for Biotechnology Information Gene Expression Omnibus GSE145998.
Results
snRNASeq and scRNASeq Have Similar Gene Detection Rates and Dissociation Bias Is Reduced in snRNASeq
Initial attempts at snRNASeq in lung were made using a previously described protocol for mouse and human kidney (7), but no cDNA libraries were obtained. Hypothesizing that this preparation was excessively harsh, we adapted an existing protocol for human lung nuclear isolation that eliminated Dounce homogenization and reduced incubation time in detergent-containing lysis buffer (11). Furthermore, we eliminated staining and flow sorting of nuclei, which reduced the total isolation time to less than 30 minutes (Figure E1 in the data supplement). Given the incomplete processing of nuclear mRNA, we compared gene detection when mapping to exons, introns, or both in snRNASeq and scRNASeq. Gene detection per nucleus was similar to gene detection per cell provided that both intronic and exonic reads were included during genome mapping (Figure 1A). Surprisingly, and contrary to previous reports (6, 7), the inclusion of intronic reads also improved gene detection in scRNASeq, though to a lesser extent (Figure 1A).
Figure 1.
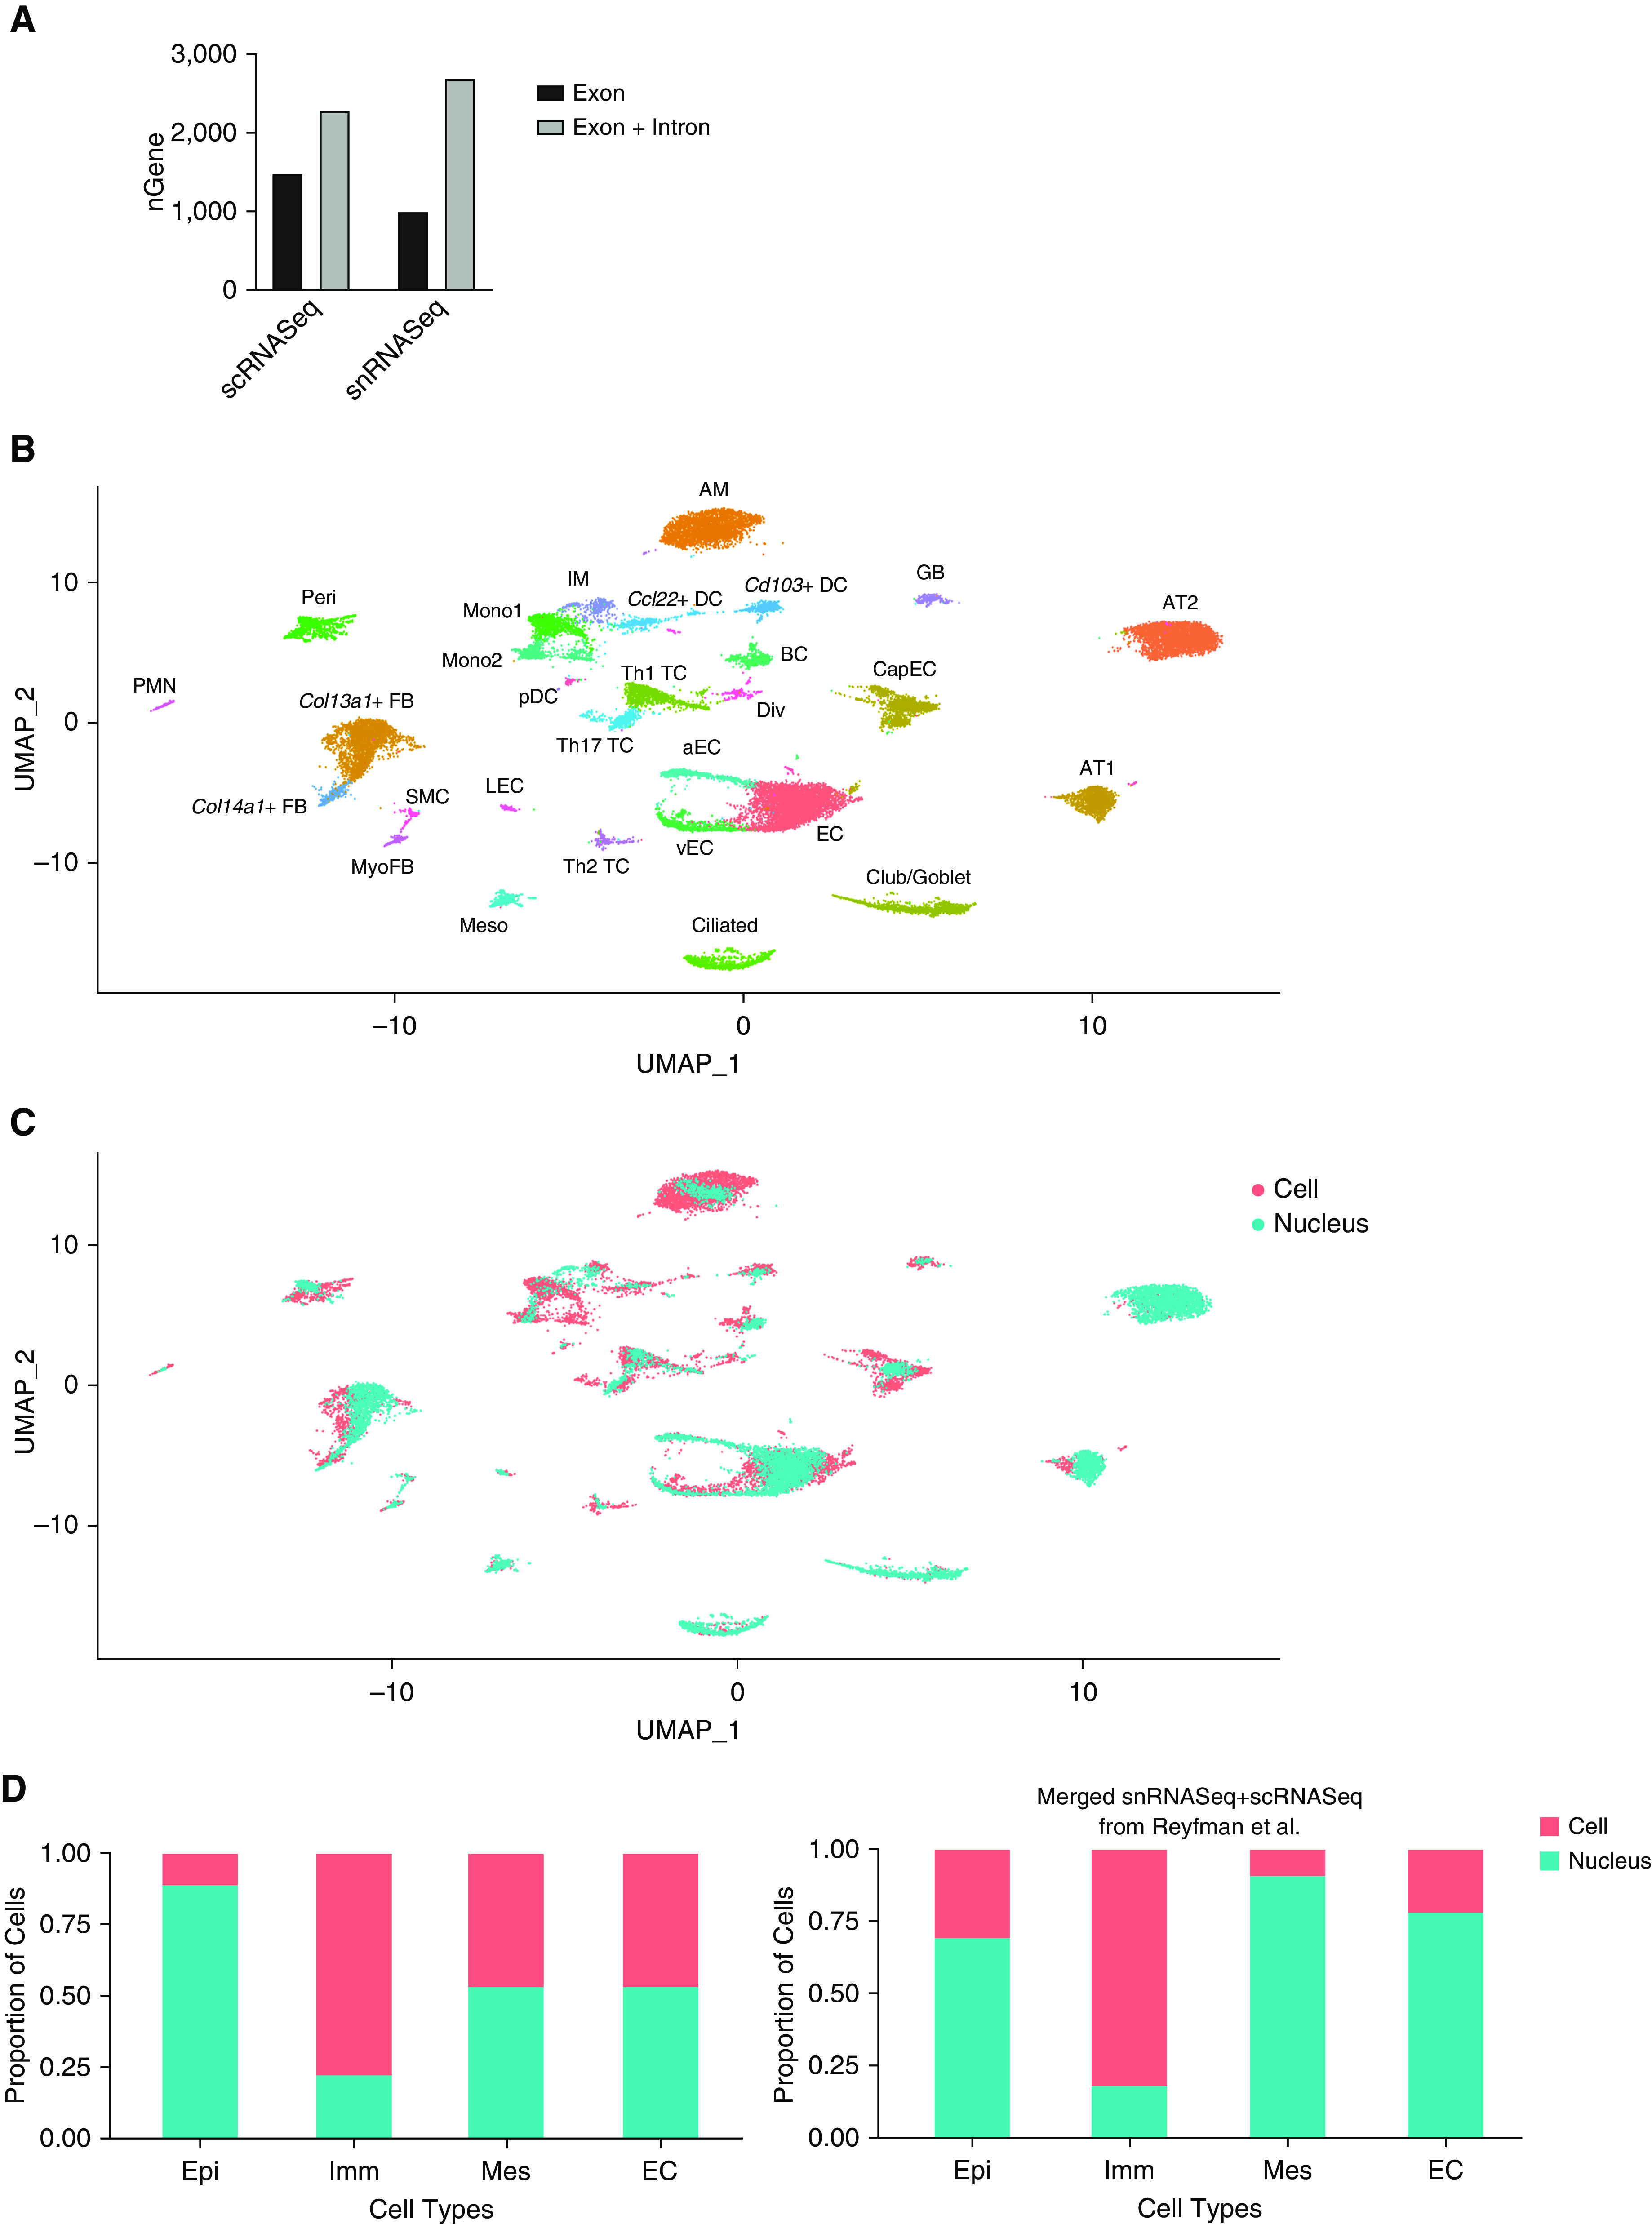
Single-nucleus RNA sequencing (snRNASeq) offers similar gene detection and improves dissociation bias compared with single-cell RNA sequencing (scRNASeq). (A) Genes detected per cell when exonic reads alone or exonic and intronic reads are used in mapping. (B) Uniform manifold approximation and projection plot of 27,978 nuclei and cells from merged snRNAseq and scRNASeq data (combined from three mice) with annotation of cell types. (C) Labeling cells from snRNASeq and scRNASeq shows minimal batch effect after Harmony. (D) Percentage contributions of snRNASeq and scRNASeq to cell categories after random downsampling to equalize numbers of cells and nuclei. Results from the present study (left) and after merge with a previously published scRNASeq dataset (right). aEC = arterial endothelial cells; AM = alveolar macrophages; AT1 = alveolar type 1 epithelial cells; AT2 = alveolar type 2 epithelial cells; BC = B cells; CapEC = capillary endothelial cells; Col13a1 = collagen type XIII α 1 chain; Col14a1 = collagen type XIV α1 chain; DC = dendritic cells; Div = dividing cells, EC = endothelial cells; Epi = epithelial; FB = fibroblasts; GB = germinal B cells, IM = interstitial macrophages; Imm = Immune; LEC = lymphatic endothelial cells; Mes = mesothelial cells; Meso = mesothelial cells; Mono = monocytes; MyoFB = myofibroblasts; NK = natural killer cells; pDC = plasmacytoid dendritic cells; Peri = pericytes; PMN = neutrophils; SMC = smooth muscle cells; TC = T cells; uMAP = uniform manifold approximation and projection; vEC = venous endothelial cells.
A total of 16,110 single-nucleus libraries were generated from snap-frozen lungs of two wild-type mice in parallel with 11,934 single-cell libraries from one additional mouse. Unsupervised clustering of single-nucleus data resulted in 25 clusters after dimensional reduction using Seurat version 3 (Figure E2). Epithelial cell types in snRNASeq included basal cells and neuroendocrine cells (in one dataset, Figure E3), which were not seen in scRNASeq (Figure E2). To compare cell-type ratios in snRNASeq and scRNASeq, we merged all datasets and reclustered, with minimal batch effect after correction with the R package Harmony (Figures 1B and 1C). After downsampling to an equal total number of cells, we analyzed the relative contributions of each technique to cell types and clusters. Overall, scRNASeq showed bias toward immune populations, contributing 77.8% of these cells in the merged data, whereas snRNASeq had more robust detection of epithelial cells (88.7%) (Figure 1D). To further validate these differences, we merged our single-nucleus data with two previous mouse 10× single-cell transcriptomes from Reyfman and colleagues (8), and observed similar bias toward immune cells in scRNASeq (Figure 1D). Although in this case alveolar type 2 cell detection was equivalent, all other epithelial cell types were predominantly seen in snRNASeq (Figure E4), and subclustering of snRNASeq data resolved basal and goblet cells (Figure E5). Subclustering of immune cells from the snRNASeq dataset resolved additional cell types, including classical and nonclassical monocytes, interstitial macrophages, natural killer cells, and rare Il12b/Ccl22+ dendritic cells (Figure E6). Finally, arterial, venous, capillary, and lymphatic endothelial cells were differentiated by snRNASeq (Figure E7). The combined dataset can be queried and visualized online (http://humphreyslab.com/SingleCell/) (Figure E8).
To determine whether observed cell-type ratios in snRNASeq were more representative of actual ratios in the lung, we performed a deconvolution analysis of an available bulk RNASeq dataset (14) using a previously described approach (15). Compared with a previously published deconvolution of bulk lung RNASeq data (16), we observed similar alveolar type 2 (AT2), alveolar type 1 (AT1), and alveolar macrophage fractions in snRNASeq (Figure E9). Moreover, the proportions of alveolar epithelial cells observed in snRNASeq approximate those reported by Weibel, with ∼2:1 AT2:AT1 cells (17). Finally, a recent publication found equal proportions of alveolar and interstitial macrophages in human explants, a ratio that was more closely approximated by snRNASeq (Figure E9) (18).
Combined snRNASeq and scRNASeq Data: Coclustering of Mesenchymal Cell Types and Differences in Gene Expression Profiles
Because our scRNASeq and snRNASeq studies detected mesenchymal populations in similar proportion (Figure 1D), we selected these cells for further comparison. In the merged dataset, mesenchymal cells formed six subclusters, including three populations of matrix fibroblasts, myofibroblasts, pericytes, and smooth muscle cells (Figure 2A). All populations contained data from nuclei and cells (Figure 2B), further supporting the use of these cell types for gene expression comparisons between snRNASeq and scRNASeq. We next asked how gene detection differed between cells and nuclei. We found that a large majority of genes (96.5%) had less than 20% difference in expression between cells and nuclei. A total of 329 genes (1.6%) were detected in 25% more cells than nuclei, and 122 genes (0.6%) were detected in 25% more nuclei than cells. Screening all detected genes (21,033) by log fold change (>0.5; adjusted P value <0.05) revealed that 3.0% (632) were enriched in cells and 1.4% (302) were enriched in nuclei (Figure 2D). We next performed gene ontology enrichment analysis on the cell versus nucleus-enriched genes. Unsurprisingly, genes associated with scRNASeq were related to ribosomal assembly, translation, stress responses, and apoptotic signaling, with the latter potentially reflecting cell stress during dissociation (Table 1). snRNASeq-predominant genes were highly enriched for calcium transport, membrane depolarization, Slit/Robo signaling, and cAMP metabolism (Table 2).
Figure 2.
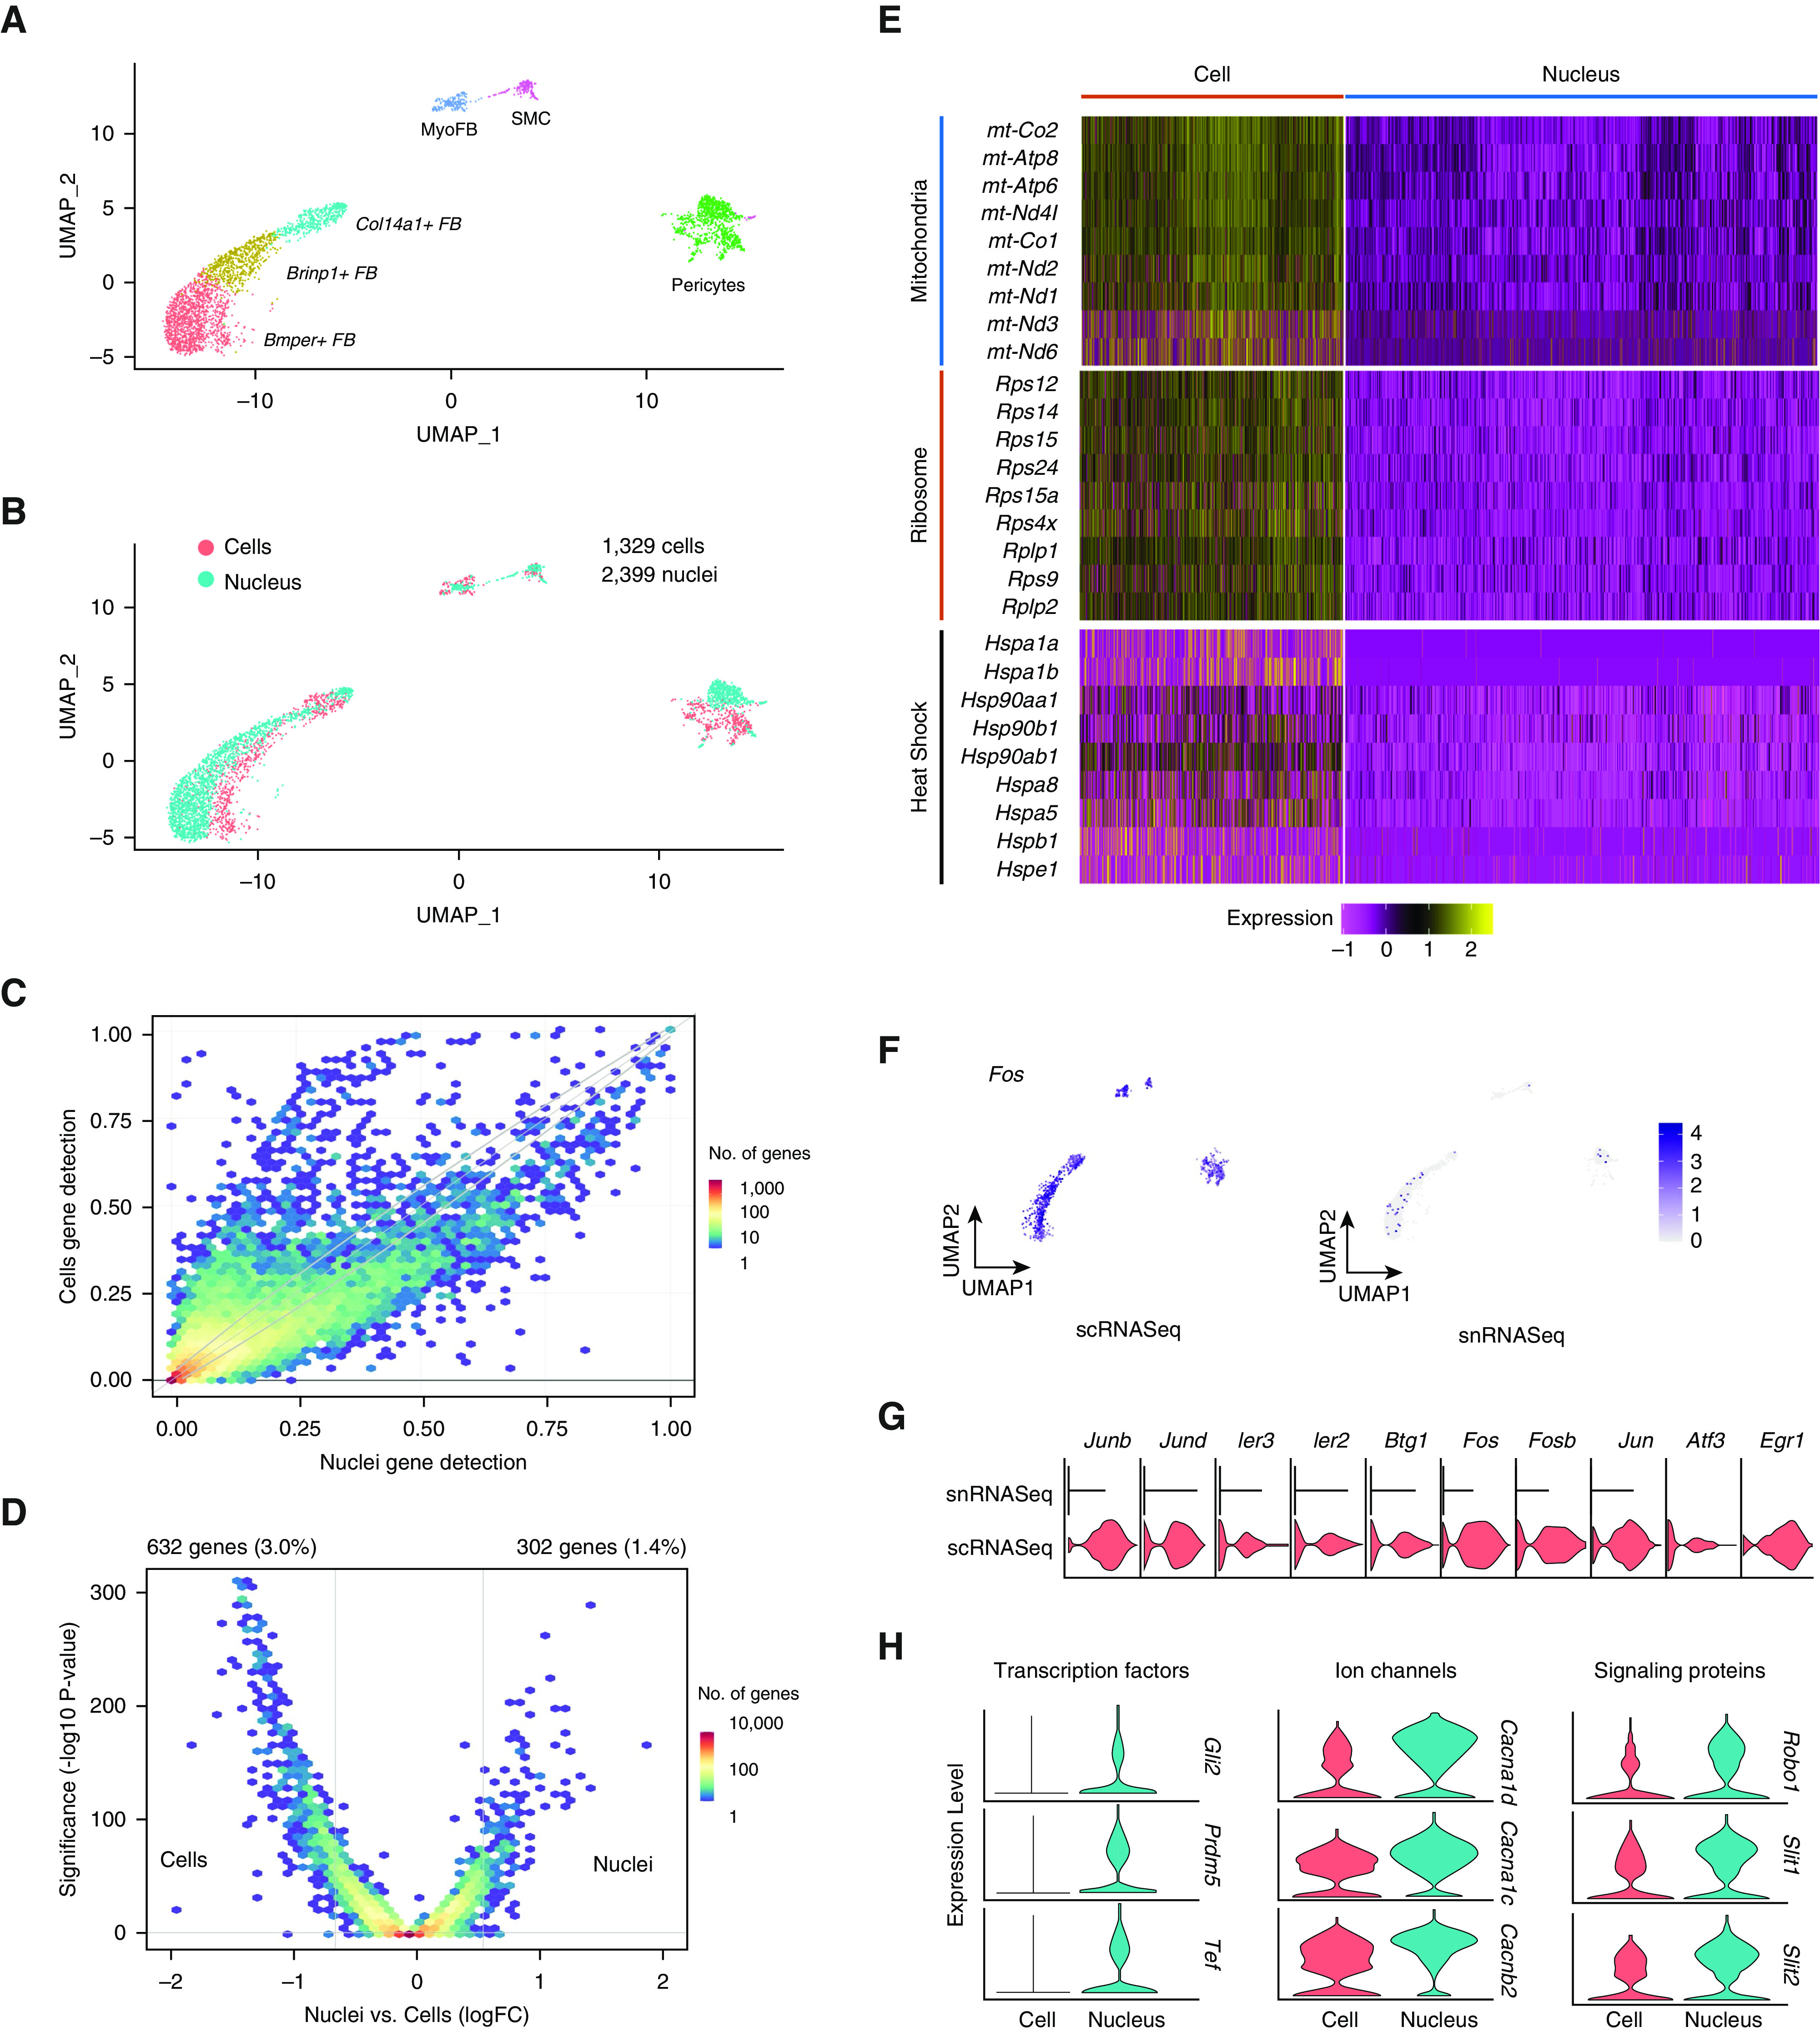
Merged single-cell and single-nucleus mesenchymal cells and differential expression between techniques. (A) Uniform manifold approximation and projection plot of cell types after isolating mesenchymal subsets. (B) Overlap of transcriptomes from cells and nuclei after subclustering. (C) Binned scatterplot illustrating genes detected more reliably in cells versus nuclei, with gray lines marking the 95% confidence interval of variation detected by chance. (D) Volcano plot showing that 3.0% of genes are more highly expressed in cells (log fold change > 0.5; adjusted P value < 0.05), whereas 1.4% of genes are more highly expressed in nuclei. (E) Increased single-cell RNA-sequencing expression of mitochondrial, ribosomal, and heat shock–response genes shown by heatmap. (F) Stress-response markers are distributed equally among cell types and are enriched in single-cell data (G). (H) Select genes with increased expression in single-nucleus RNA-sequencing data, including ion channels, signal transduction proteins, and transcription factors. Bmper = BMP binding endothelial regulator; Brinp1 = BMP/retinoic acid inducible neural specific 1; Cacna1d = Calcium voltage-gated channel subunit alpha 1d; Cacna1c = Calcium voltage-gated channel 1c; Cacnb2 = Calcium voltage-gated channel subunit beta 2; Fos = Fos proto-oncogene, AP-1 transcription factor subunit; Gli2 = Gli family zinc finger 2; Prdm5 = PR/SET domain 5; Robo1 = Roundabout guidance receptor 1; Slit1 = Slit guidance ligand 1; Slit2 = Slit guidance ligand 2.
Table 1.
GO Analysis of Enriched Genes from scRNASeq by Fold Enrichment
| GO Biological Process | Fold Enrichment | P Value |
|---|---|---|
| Cellular response to corticotropin-releasing hormone stimulus (GO: 0071376) | 27.23 | 6.19 × 10⁻⁴ |
| Response to corticotropin-releasing hormone (GO: 0043435) | 27.23 | 6.19 × 10⁻⁴ |
| Ribosomal small subunit assembly (GO: 0000028) | 24.21 | 6.87 × 10⁻¹² |
| Response to selenium ion (GO: 0010269) | 21.79 | 9.70 × 10⁻⁴ |
| Positive regulation of intrinsic apoptotic signaling pathway by p53 class mediator (GO: 1902255) | 18.16 | 2.13 × 10⁻⁴ |
| Cytoplasmic translation (GO: 0002181) | 16.8 | 5.21 × 10⁻²⁵ |
| Amyloid fibril formation (GO: 1990000) | 16.51 | 4.65 × 10⁻⁵ |
| Positive regulation of cell–cell adhesion mediated by integrin (GO: 0033634) | 15.56 | 2.00 × 10⁻³ |
| Blood vessel maturation (GO: 0001955) | 15.56 | 2.00 × 10⁻³ |
| Regulation of keratinocyte apoptotic process (GO: 1902172) | 15.56 | 2.00 × 10⁻³ |
| Positive regulation of B-cell receptor signaling pathway (GO: 0050861) | 15.56 | 2.00 × 10⁻³ |
| Regulation of endodeoxyRNase activity (GO: 0032071) | 15.56 | 2.00 × 10⁻³ |
| Negative regulation of ubiquitin protein ligase activity (GO: 1904667) | 14.53 | 4.13 × 10⁻⁴ |
| Positive regulation of endothelial cell differentiation (GO: 0045603) | 14.12 | 3.03 × 10⁻⁶ |
| Cellular response to UV-B (GO: 0071493) | 13.62 | 2.69 × 10⁻³ |
| Positive regulation of necrotic cell death (GO: 0010940) | 13.62 | 2.69 × 10⁻³ |
Definition of abbreviations: GO = gene ontology; scRNASeq = single-cell RNA sequencing; UV-B = ultraviolet B light.
Table 2.
GO Analysis of Enriched Genes from snRNASeq by Fold Enrichment
| GO Biological Process | Fold enrichment | P Value |
|---|---|---|
| Regulation of negative chemotaxis (GO: 0050923) | 56.49 | 7.49 × 10⁻⁵ |
| Positive regulation of calcium ion transmembrane transport via high voltage-gated calcium channel (GO: 1904879) | 56.49 | 7.49 × 10⁻⁵ |
| Negative regulation of chemokine-mediated signaling pathway (GO: 0070100) | 37.66 | 1.76 × 10⁻⁴ |
| Roundabout signaling pathway (GO: 0035385) | 37.66 | 1.76 × 10⁻⁴ |
| Regulation of calcium ion transmembrane transport via high voltage-gated calcium channel (GO: 1902514) | 34.24 | 1.45 × 10⁻⁴ |
| Regulation of systemic arterial blood pressure by baroreceptor feedback (GO: 0003025) | 32.28 | 2.50 × 10⁻⁴ |
| Regulation of chemokine-mediated signaling pathway (GO: 0070099) | 32.28 | 2.50 × 10⁻⁴ |
| Peptidyl-serine autophosphorylation (GO: 0036289) | 28.25 | 3.40 × 10⁻⁴ |
| Membrane depolarization during cardiac muscle cell action potential (GO: 0086012) | 25.11 | 4.64 × 10⁻⁵ |
| Olfactory bulb interneuron development (GO: 0021891) | 25.11 | 4.49 × 10⁻⁴ |
| cAMP metabolic process (GO: 0046058) | 21.52 | 7.64 × 10⁻⁵ |
| Micturition (GO: 0060073) | 20.54 | 7.28 × 10⁻⁴ |
| cAMP biosynthetic process (GO: 0006171) | 20.54 | 7.28 × 10⁻⁴ |
| Aortic valve morphogenesis (GO: 0003180) | 15.86 | 2.10 × 10⁻⁴ |
| Cell–cell signaling involved in cardiac conduction (GO: 0086019) | 13.7 | 3.44 × 10⁻⁴ |
| Positive regulation of chondrocyte differentiation (GO: 0032332) | 13.1 | 4.00 × 10⁻⁴ |
The scRNA-seq dataset was enriched for genes encoding mitochondrial, ribosomal, and heat shock proteins (Figure 2E). An advantage of snRNASeq over scRNASeq in other tissues has been reduced artifactual expression of stress-response genes, which are known to be induced during proteolysis at 37°C (19). We detected strong expression of the immediate early gene Fos in all cell types from scRNASeq but not snRNASeq (Figure 2F). A panel of stress-induced genes, including AP1 (activator protein-1) transcription factor component Jun, immediate early genes Ier2 and Ier3, and stress sensor Atf3, showed expression primarily in the single-cell dataset (Figure 2G). Genes more readily detected in nuclei included multiple transcription factors, ion channels, and signaling proteins (Figure 2H).
Contamination from highly expressed genes in abundant cells (e.g., airway and alveolar epithelium) is a well-described phenomenon in single-cell and single-nucleus transcriptomics. Although both mesenchymal populations from snRNASeq and scRNASeq showed contamination with epithelial genes, likely reflecting ambient mRNA, this was more significant in snRNASeq (Figure E10), contrary to previous results in the kidney (7). To address the presence of contaminant genes, we employed the R package SoupX, which estimates the content of background contamination and removes counts according to an estimated contamination fraction (20). Although many genes showed improved cell type restriction after SoupX using 10% or 20% assigned contamination, there was minimal effect on epithelial background genes such as Sftpc, and gene counts per cell were reduced in proportion to assigned contamination fraction (Figure E11).
Defining Mesenchymal Cell Subpopulations
Previous lung scRNASeq analyses in mice and humans have underrepresented matrix-embedded mesenchymal populations such as fibroblasts (8, 9), which are less easily liberated during enzymatic digestion. We identified six mesenchymal subpopulations in our merged dataset (Figure 2A), including three distinct populations of Pdgfra+ fibroblasts (Figures 3A and 3B). Although prior analyses have distingui‐shed Col14a1- and Col13a1-expressing fibroblasts, the Col13a1+ population in our data contained two cell subtypes, with the first characterized by the expression of Bmper, Fat3, and Fgfr4 and the second by Brinp1 and Nalcn (Figures 3B and 3C). Col14a1+ fibroblasts additionally express Dcn and transcription factor–encoding Ebf2 (Figure 3C). Pericytes were defined by the expression of Pdgfrb and expressed Notch3 and Pde5a (Figure 3C). Smooth muscle cells and myofibroblasts were also detected by snRNASeq and scRNASeq. Myofibroblasts were Aspn, Grem2, and Hhip+, and they also expressed Mapk4, which encodes atypical mitogen activated protein (MAP) kinase Erk4 and has not previously been described as a myofibroblast marker (Figure 3C). Smooth muscle cells were marked by Acta2, Myh11, and Myocd (Figure 3C).
Figure 3.
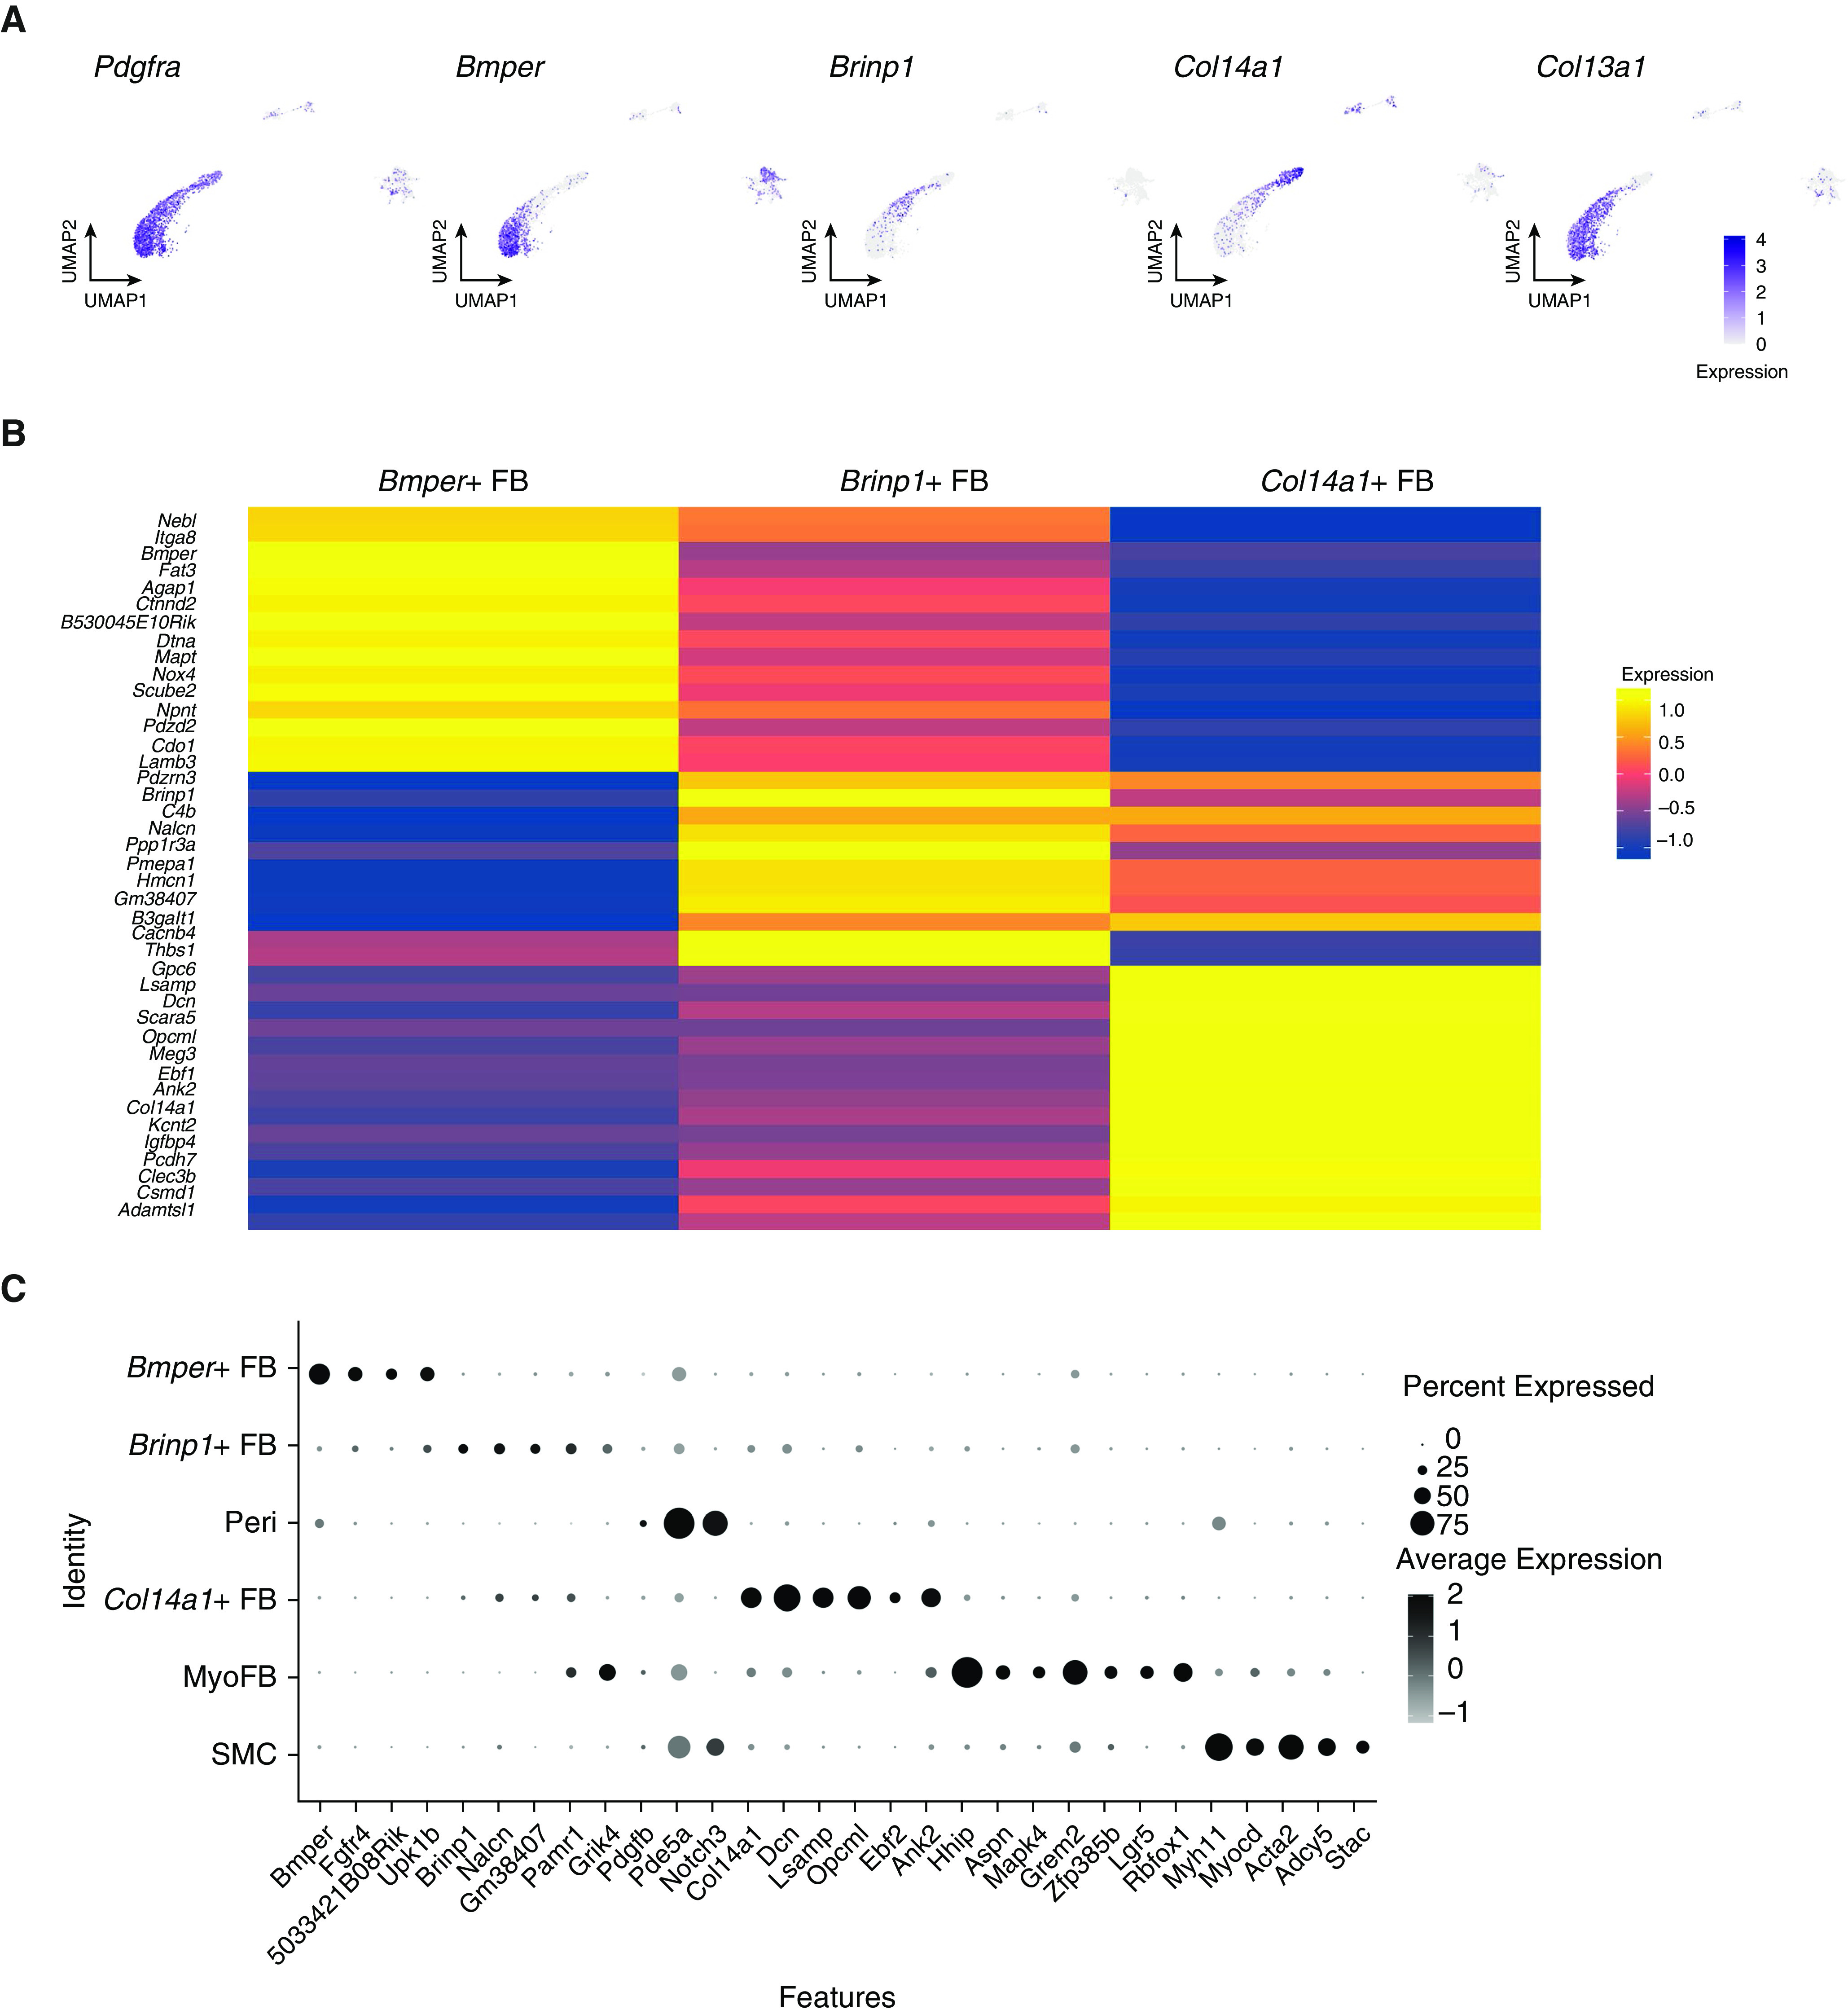
Characterization of mesenchymal cell types from combined single-cell RNA-sequencing and single-nucleus RNA-sequencing data. (A) Among Pdgfra+ fibroblasts, Bmper+ and Brinp1+ cells are Col13a1+ and do not express Col14a1. (B) Average gene expression heatmap showing distinct expression profiles of three fibroblast subtypes. (C) Dot plot with additional marker genes for mesenchymal cell subtypes. Pdgfra = platelet-derived growth factor receptor α.
Receptor–Ligand Interactome for the Alveolar Compartment Based on snRNASeq Data
Cell type–specific transcriptomic data allow mapping of potential receptor–ligand interactions among cell types in anatomic proximity. Because alveolar cell types were well represented in snRNASeq, we sought to define these signaling interactions in the alveolar compartment under control conditions by cross-referencing our differentially expressed gene lists against an available receptor–ligand interaction database (21). AT1 cells encode multiple signaling proteins, including Vegfa and Pdgf, whose corresponding receptors are found in endothelial cells and fibroblasts (Figure E12), whereas additional Pdgf isoforms were produced by alveolar macrophages and capillary endothelial cells. Fibroblast signaling to epithelial cells occurs via Wnt5a and Igf1.
Discussion
Although scRNASeq has led to important discoveries in the lung, the application of this technology has practical limitations, perhaps the most important of which is the need for fresh tissue. Nuclear dissociation can be performed on cryopreserved samples, and we adapted the current protocol from an existing method available for human lung nuclear isolation for snRNASeq (11). Nuclear RNA quality is difficult to assess, and which aspects of the kidney protocol led to poor RNA quality are uncertain. RNase activity is reportedly orders of magnitude higher in the lung than in the kidney (22), and although we used similar RNase inhibitor concentrations in both protocols, there may be benefits to higher inhibitor concentrations in the lung. We also reduced the total preparation time (eliminating nuclear staining and flow sorting), which should reduce RNA degradation. Finally, removing incubation steps that prolong exposure to detergent and dissociating tissue with GentleMacs rather than Dounce homogenization may protect nuclear membrane integrity. It is a significant limitation of the present study that the above variables (RNase inhibitor concentrations, incubation times, dissociation methods, etc.) were not systematically optimized, leaving room for additional improvements to our protocol. An additional limitation is that we did not attempt our protocol on human samples, though our experience in kidney suggests that generation of high-quality snRNASeq data from cryopreserved human tissue is possible without flow sorting (23).
The inclusion of intronic and exonic reads when mapping snRNASeq reads is known to improve gene detection, as confirmed in our data. Less expected was the effect of intron inclusion on scRNASeq data, which was substantial, though smaller in magnitude than for snRNASeq, and has not been observed in previous snRNASeq/scRNASeq comparisons (6, 7). This phenomenon may relate to tissue- or cell type–specific differences in RNA processing or to proprietary chemistry changes in newer 10× Genomics 3′v3 kits (e.g., harsher in-droplet lysis conditions leading to nuclear membrane disruption and the release of nuclear mRNAs).
We observed bias toward the detection of immune cell types with scRNASeq. Although our cell isolation protocol differs from previously published approaches in its use of mechanical dissociation with GentleMacs and use of an OptiPrep gradient to exclude RBCs and remove dead cells and degraded nucleotides (in lieu of RBC lysis and annexin V–based dead cell removal steps), we observed similar disparities when comparing snRNASeq data with published scRNASeq data. Rare epithelial populations including neuroendocrine cells and basal cells were seen exclusively in snRNASeq, and club cells, ciliated cells, and AT1 cells were also predominantly found in snRNASeq data.
Contamination with ambient RNA was more significant in single-nucleus data, particularly with highly expressed epithelial genes such as Scgb1a1. Further nuclear isolation protocol modifications (e.g., additional pellet washes) might address this limitation. Many genes in snRNASeq (and scRNASeq) showed reduced “off-target” expression with SoupX decontamination, although the epithelial genes that appear to be major sources of contamination were minimally affected. We did not incorporate this approach into our workflow given the reduction in gene detection rate at high contamination fractions and concern for information loss. As previously reported, scRNASeq was also associated with off-target gene detection in the form of stress-response/apoptotic genes and mitochondrial/ribosomal genes, which may not be of interest in defining cell types or states (6, 7).
Previous studies have specifically explored the diversity of lung mesenchymal cells through lineage tracing and microarray (24) or scRNASeq (25), generally selecting cells by flow cytometry before expression profiling. Through an unbiased whole organ approach using snRNASeq, we identified several mesenchymal cell types, including previously undescribed heterogeneity among Pdgfra+/Col13a1+ fibroblasts. In addition, resting myofibroblasts with relatively low Acta2 and high Hhip/Lgr5 expression were identified, similar to previous reports (25, 26).
We also interrogated the data for ligand–receptor interactions in the alveolar compartment. AT1 cells are a robust source of signaling ligands in the alveolus at homeostasis, such as Bdnf, Pdgfa, Vegfa, and Wnt3a, consistent with prior reports in mice and a large human single-cell dataset (3, 27, 28). Wnt5a, which maintains stemness in AT2 cells via Ror1, and Slit2, whose loss of expression in fibrosis may drive fibrocyte differentiation, were among the ligands produced by mesenchymal cells (29, 30).
Conclusions
snRNASeq is feasible from cryopreserved lung, and our simplified protocol eliminates the need for FACS purification. In comparison with scRNASeq, our protocol offers equivalent gene detection, eliminates artifactual transcriptional stress responses, and delivers a much higher proportion of epithelial cells.
Supplementary Material
Footnotes
Supported by U.S. National Institutes of Health/NIDDK grants DK103740 and DK107374 (B.D.H).
This article has a data supplement, which is accessible from this issue’s table of contents at www.atsjournals.org.
Originally Published in Press as DOI: 10.1165/rcmb.2020-0095MA on August 17, 2020
Author disclosures are available with the text of this article at www.atsjournals.org.
References
- 1.Plasschaert LW, Žilionis R, Choo-Wing R, Savova V, Knehr J, Roma G, et al. A single-cell atlas of the airway epithelium reveals the CFTR-rich pulmonary ionocyte. Nature. 2018;560:377–381. doi: 10.1038/s41586-018-0394-6. [DOI] [PMC free article] [PubMed] [Google Scholar]
- 2.Joshi N, Watanabe S, Verma R, Jablonski RP, Chen C-I, Cheresh P, et al. A spatially restricted fibrotic niche in pulmonary fibrosis is sustained by M-CSF/M-CSFR signalling in monocyte-derived alveolar macrophages. Eur Respir J. 2020;55:1900646. doi: 10.1183/13993003.00646-2019. [DOI] [PMC free article] [PubMed] [Google Scholar]
- 3.Adams TS, Schupp JC, Poli S, Ayaub EA, Neumark N, Ahangari F, et al. Single cell RNA-seq reveals ectopic and aberrant lung resident cell populations in idiopathic pulmonary fibrosis. Sci Adv. 2020;6:eaba1983. doi: 10.1126/sciadv.aba1983. [DOI] [PMC free article] [PubMed] [Google Scholar]
- 4.Krishnaswami SR, Grindberg RV, Novotny M, Venepally P, Lacar B, Bhutani K, et al. Using single nuclei for RNA-seq to capture the transcriptome of postmortem neurons. Nat Protoc. 2016;11:499–524. doi: 10.1038/nprot.2016.015. [DOI] [PMC free article] [PubMed] [Google Scholar]
- 5.Lake BB, Ai R, Kaeser GE, Salathia NS, Yung YC, Liu R, et al. Neuronal subtypes and diversity revealed by single-nucleus RNA sequencing of the human brain. Science. 2016;352:1586–1590. doi: 10.1126/science.aaf1204. [DOI] [PMC free article] [PubMed] [Google Scholar]
- 6.Bakken TE, Hodge RD, Miller JA, Yao Z, Nguyen TN, Aevermann B, et al. Single-nucleus and single-cell transcriptomes compared in matched cortical cell types. PLoS One. 2018;13:e0209648. doi: 10.1371/journal.pone.0209648. [DOI] [PMC free article] [PubMed] [Google Scholar]
- 7.Wu H, Kirita Y, Donnelly EL, Humphreys BD. Advantages of single-nucleus over single-cell RNA sequencing of adult kidney: rare cell types and novel cell states revealed in fibrosis. J Am Soc Nephrol. 2019;30:23–32. doi: 10.1681/ASN.2018090912. [DOI] [PMC free article] [PubMed] [Google Scholar]
- 8.Reyfman PA, Walter JM, Joshi N, Anekalla KR, McQuattie-Pimentel AC, Chiu S, et al. Single-cell transcriptomic analysis of human lung provides insights into the pathobiology of pulmonary fibrosis. Am J Respir Crit Care Med. 2019;199:1517–1536. doi: 10.1164/rccm.201712-2410OC. [DOI] [PMC free article] [PubMed] [Google Scholar]
- 9.Raredon MSB, Adams TS, Suhail Y, Schupp JC, Poli S, Neumark N, et al. Single-cell connectomic analysis of adult mammalian lungs. Sci Adv. 2019;5:eaaw3851. doi: 10.1126/sciadv.aaw3851. [DOI] [PMC free article] [PubMed] [Google Scholar]
- 10.King TE, Jr, Pardo A, Selman M. Idiopathic pulmonary fibrosis. Lancet. 2011;378:1949–1961. doi: 10.1016/S0140-6736(11)60052-4. [DOI] [PubMed] [Google Scholar]
- 11.Joshi N, Misharin A. Single-nucleus isolation from frozen human lung tissue for single-nucleus RNA-seq. 2019 Available from: https://www.protocols.io/view/single-nucleus-isolation-from-frozen-human-lung-ti-zu8f6zw.
- 12.Jungblut M, Oeltze K, Zehnter I, Hasselmann D, Bosio A. Standardized preparation of single-cell suspensions from mouse lung tissue using the gentleMACS dissociator. J Vis Exp. 2009:1266. doi: 10.3791/1266. [DOI] [PMC free article] [PubMed] [Google Scholar]
- 13.Parekh S, Ziegenhain C, Vieth B, Enard W, Hellmann I. zUMIs - a fast and flexible pipeline to process RNA sequencing data with UMIs. Gigascience. 2018;7:giy059. doi: 10.1093/gigascience/giy059. [DOI] [PMC free article] [PubMed] [Google Scholar]
- 14.Angelidis I, Simon LM, Fernandez IE, Strunz M, Mayr CH, Greiffo FR, et al. An atlas of the aging lung mapped by single cell transcriptomics and deep tissue proteomics. Nat Commun. 2019;10:963. doi: 10.1038/s41467-019-08831-9. [DOI] [PMC free article] [PubMed] [Google Scholar]
- 15.Kirita Y, Wu H, Uchimura K, Wilson PC, Humphreys BD. Cell profiling of mouse acute kidney injury reveals conserved cellular responses to injury. Proc Natl Acad Sci USA. 2020;117:15874–15883. doi: 10.1073/pnas.2005477117. [DOI] [PMC free article] [PubMed] [Google Scholar]
- 16.Yuan Y, Zhou Y, Li Y, Hill C, Ewing RM, Jones MG, et al. Deconvolution of RNA-seq analysis of hyperbaric oxygen-treated mice lungs reveals mesenchymal cell subtype changes. Int J Mol Sci. 2020;21:1371. doi: 10.3390/ijms21041371. [DOI] [PMC free article] [PubMed] [Google Scholar]
- 17.Weibel ER. On the tricks alveolar epithelial cells play to make a good lung. Am J Respir Crit Care Med. 2015;191:504–513. doi: 10.1164/rccm.201409-1663OE. [DOI] [PubMed] [Google Scholar]
- 18.Hume PS, Gibbings SL, Jakubzick CV, Tuder RM, Curran-Everett D, Henson PM, et al. Localization of macrophages in the human lung via design-based stereology. Am J Respir Crit Care Med. 2020;201:1209–1217. doi: 10.1164/rccm.201911-2105OC. [DOI] [PMC free article] [PubMed] [Google Scholar]
- 19.Adam M, Potter AS, Potter SS. Psychrophilic proteases dramatically reduce single-cell RNA-seq artifacts: a molecular atlas of kidney development. Development. 2017;144:3625–3632. doi: 10.1242/dev.151142. [DOI] [PMC free article] [PubMed] [Google Scholar]
- 20.Young MD, Behjati S. SoupX removes ambient RNA contamination from droplet based single cell RNA sequencing data [preprint] bioRxiv. 2018 doi: 10.1093/gigascience/giaa151. Available from: https://www.biorxiv.org/content/10.1101/303727v1. [DOI] [PMC free article] [PubMed] [Google Scholar]
- 21.Ramilowski JA, Goldberg T, Harshbarger J, Kloppmann E, Lizio M, Satagopam VP, et al. A draft network of ligand-receptor-mediated multicellular signalling in human. Nat Commun. 2015;6:7866. doi: 10.1038/ncomms8866. [DOI] [PMC free article] [PubMed] [Google Scholar]
- 22.RNase activity in mouse tissue: classification, hierarchy, and methods for control - US. 2020 [accessed 2020 May 30]. Available from: https://www.thermofisher.com/us/en/home/references/ambion-tech-support/nuclease-enzymes/tech-notes/rnase-activity-in-mouse-tissue.html.
- 23.Wilson PC, Wu H, Kirita Y, Uchimura K, Ledru N, Rennke HG, et al. The single-cell transcriptomic landscape of early human diabetic nephropathy. Proc Natl Acad Sci USA. 2019;116:19619–19625. doi: 10.1073/pnas.1908706116. [DOI] [PMC free article] [PubMed] [Google Scholar]
- 24.Green J, Endale M, Auer H, Perl A-KT. Diversity of interstitial lung fibroblasts is regulated by platelet-derived growth factor receptor α kinase activity. Am J Respir Cell Mol Biol. 2016;54:532–545. doi: 10.1165/rcmb.2015-0095OC. [DOI] [PMC free article] [PubMed] [Google Scholar]
- 25.Xie T, Wang Y, Deng N, Huang G, Taghavifar F, Geng Y, et al. Single-cell deconvolution of fibroblast heterogeneity in mouse pulmonary fibrosis. Cell Rep. 2018;22:3625–3640. doi: 10.1016/j.celrep.2018.03.010. [DOI] [PMC free article] [PubMed] [Google Scholar]
- 26.Lee J-H, Tammela T, Hofree M, Choi J, Marjanovic ND, Han S, et al. Anatomically and functionally distinct lung mesenchymal populations marked by Lgr5 and Lgr6. Cell. 2017;170:1149–1163, e12. doi: 10.1016/j.cell.2017.07.028. [DOI] [PMC free article] [PubMed] [Google Scholar]
- 27.Mura M, Han B, Andrade CF, Seth R, Hwang D, Waddell TK, et al. The early responses of VEGF and its receptors during acute lung injury: implication of VEGF in alveolar epithelial cell survival. Crit Care. 2006;10:R130. doi: 10.1186/cc5042. [DOI] [PMC free article] [PubMed] [Google Scholar]
- 28.Cherubini E, Mariotta S, Scozzi D, Mancini R, Osman G, D’Ascanio M, et al. BDNF/TrkB axis activation promotes epithelial-mesenchymal transition in idiopathic pulmonary fibrosis. J Transl Med. 2017;15:196. doi: 10.1186/s12967-017-1298-1. [DOI] [PMC free article] [PubMed] [Google Scholar]
- 29.Nabhan AN, Brownfield DG, Harbury PB, Krasnow MA, Desai TJ. Single-cell Wnt signaling niches maintain stemness of alveolar type 2 cells. Science. 2018;359:1118–1123. doi: 10.1126/science.aam6603. [DOI] [PMC free article] [PubMed] [Google Scholar]
- 30.Pilling D, Zheng Z, Vakil V, Gomer RH. Fibroblasts secrete Slit2 to inhibit fibrocyte differentiation and fibrosis. Proc Natl Acad Sci USA. 2014;111:18291–18296. doi: 10.1073/pnas.1417426112. [DOI] [PMC free article] [PubMed] [Google Scholar]
Associated Data
This section collects any data citations, data availability statements, or supplementary materials included in this article.
Supplementary Materials
Data Availability Statement
The accession number for the RNA-sequencing data reported in this paper is National Center for Biotechnology Information Gene Expression Omnibus GSE145998.