Significance Statement
Given that the annual number of kidney transplants and the number of recipients living with a kidney transplant continue to rise, a contemporary assessment of trends in post-transplant mortality is urgently required. The authors’ analyses show that, despite changes in recipient profiles that confer increased risks of mortality, risks of death progressively declined over the past 40 years at all time points after transplantation, including after graft failure. Incidences of death from cardiovascular disease, cancer, and infection have all declined. Relatively greater reductions in cardiovascular death mean that cancer deaths now match cardiovascular deaths beyond the first post-transplant year in those with a functioning graft. This indicates that clinicians should focus on preventing death from cardiovascular disease and infections early post-transplant, and cancer and cardiovascular disease at later time points.
Keywords: mortality, kidney transplantation, cardiovascular disease, cancer, epidemiology and outcomes
Visual Abstract
Abstract
Background
Mortality risk after kidney transplantation can vary significantly during the post-transplant course. A contemporary assessment of trends in all-cause and cause-specific mortality at different periods post-transplant is required to better inform patients, clinicians, researchers, and policy makers.
Methods
We included all first kidney-only transplant recipients from 1980 through 2018 from the Australia and New Zealand Dialysis and Transplant Registry. We compared adjusted death rates per 5-year intervals, using a piecewise exponential survival model, stratified by time post-transplant or time post–graft failure.
Results
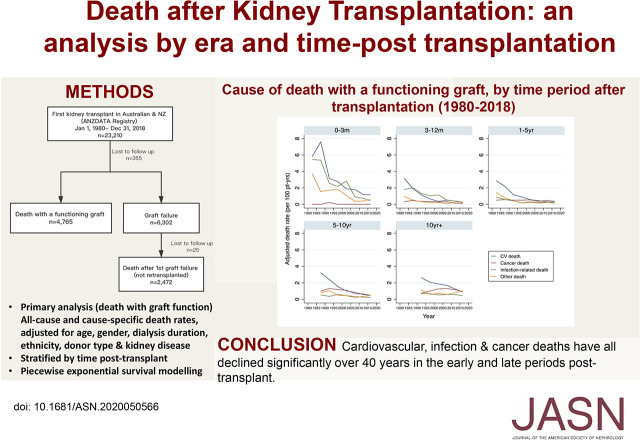
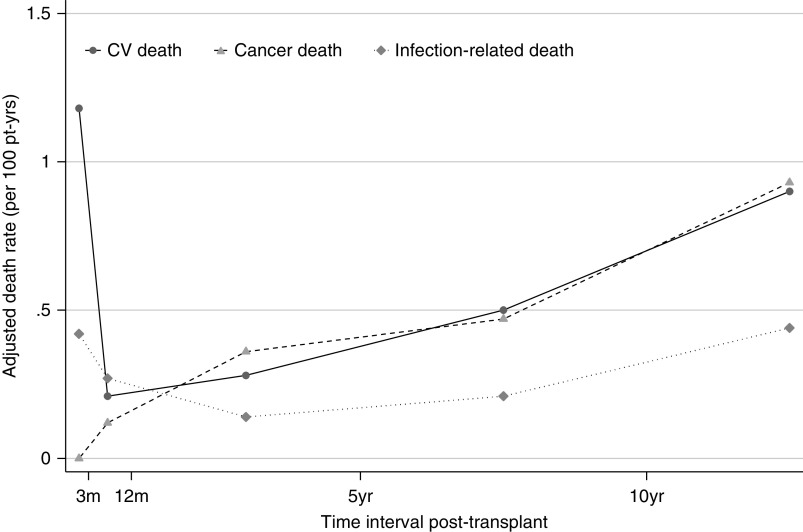
Of 23,210 recipients, 4765 died with a functioning graft. Risk of death declined over successive eras, at all periods post-transplant. Reductions in early deaths were most marked; however, recipients ≥10 years post-transplant were 20% less likely to die in the current era compared with preceding eras (2015–2018 versus 2005–2009, adjusted hazard ratio, 0.80; 95% confidence interval, 0.69 to 0.90). In 2015–2018, cardiovascular disease was the most common cause of death, particularly in months 0–3 post-transplant (1.18 per 100 patient-years). Cancer deaths were rare early post-transplant, but frequent at later time points (0.93 per 100 patient-years ≥10 years post-transplant). Among 3657 patients with first graft loss, 2472 died and were not retransplanted. Death was common in the first year after graft failure, and the cause was most commonly cardiovascular (50%).
Conclusions
Reductions in death early and late post-transplant over the past 40 years represent a major achievement. Reductions in cause-specific mortality at all time points post-transplant are also apparent. However, relatively greater reductions in cardiovascular death have increased the prominence of late cancer deaths.
Death with a functioning graft that occurs after a “normal” life span is arguably the ultimate goal of kidney transplantation. Death early after transplantation is, however, a catastrophic event, resulting in not only the loss of the recipient, but also the loss of the donor kidney. Around half of all kidney transplant failures are attributed to death with a functioning graft,1,2 however, the timing of death in relation to time post-transplant is not well described. Although cardiovascular disease remains the leading cause of death in kidney transplant registries proportionally,3 the contribution of cardiovascular death relative to other causes, such as cancer and infection at different time periods post-transplant, have not been quantified.
Incremental improvements to dialysis care and of patients with cardiovascular disease have been associated with increased survival for patients on dialysis in Australia and New Zealand in the recent era.4 Similarly, in association with significant advancements in immunosuppression and surgical techniques, marked improvements in survival have been observed after transplantation since 1990.1 Since then, donor and recipient characteristics have continued to evolve worldwide.5–7 The proportion of kidney transplant candidates aged ≥65 years in the United States continues to increase, comprising almost a quarter of the wait list in 2018.6 In Europe, average recipient age has increased from 44 years between 1986 and 1995, to 54 years in 2006–2015.5 Such changes are likely to have affected the incidence and causes of death with graft function.
Because both the number of people transplanted each year and the number of recipients living with a kidney transplant continue to grow,2,7 a contemporary assessment of the trends in post-transplant mortality is urgently required. Using the Australia and New Zealand Dialysis and Transplant Registry (ANZDATA), our primary aim was to determine the evolution of overall and cause-specific death with a functioning graft among kidney transplant recipients in Australia and New Zealand over the last 40 years. We compared causes of death during clinically relevant time periods post-transplant (0 to <3 months, 3 to <12 months, 1 to <5 years, 5 to <10 years, and ≥10 years) and assessed whether overall and cause-specific mortality rates have varied over time. A secondary aim was to determine the trend in incidence, timing, and cause of death after graft failure in those who were not retransplanted.
Methods
ANZDATA, established in 1977, collects clinician-reported patient characteristics and outcome data for all patients requiring chronic RRT (dialysis or transplantation) in Australia and New Zealand. Further details on the structure and the methodology can be found on the ANZDATA website (https://www.anzdata.org.au/anzdata/). Contributing renal units across Australia and New Zealand are responsible for ensuring that accurate and complete data are provided annually. Mortality data were reported to the ANZDATA by the patient’s treating renal unit at the time of death or during the annual survey period. ANZDATA contains >80 different causes of death which, for study purposes, we categorized into cardiovascular, cancer, infection, or other (Supplemental Table 1).
We included all adult and pediatric patients who received their first kidney-only transplant in Australia and New Zealand between January 1, 1980 and December 31, 2018. For the primary outcome of death with a functioning graft, we censored patients at graft failure (return to dialysis or retransplant), loss to follow-up, or December 31, 2018. As a sensitivity analysis, we repeated the analysis without censoring for graft failure. To examine trends in the timing and cause of death after graft failure, we studied those who experienced first graft loss during the study period, censored at retransplant, loss to follow-up, or December 31, 2018.
We compared baseline recipient characteristics over time in 10-year periods using the chi-squared test for independence. We calculated all-cause death rates and cause-specific death rates by dividing the total number of deaths (numerator) by the total patient-years at risk (denominator) during a 5-year period. Death rates were reported as per 100 patient-years. For death with a functioning graft, we adjusted death rates for age at transplant, sex, ethnicity, duration of dialysis, donor type (living versus deceased donor), and cause of kidney disease. We compared death rates by using a piecewise exponential model, stratified by the following time periods post-transplant: 0 to <3 months, 3 to <12 months, 1 to <5 years, 5 to <10 years, and ≥10 years. We used piecewise exponential survival modeling because it allowed the flexibility to concurrently adjust for two time variables, transplant era and time post-transplant.8,9 The piecewise exponential model also allowed us to analyze all-cause death and competing risks of death, using a cause-specific approach.8,9 This approach used cause-specific death as the event of interest, and all other causes of deaths were treated as censored observations. We tested the models’ goodness of fit using Cox–Snell residuals. For death after graft failure, censored at retransplant, we adjusted death rates for age at graft failure, sex, ethnicity, duration of dialysis, donor type, cause of kidney disease, and duration of time with a functioning graft. We stratified cause of death by time post–graft failure: <1 year versus ≥1 year(s).
We performed our analyses using Stata Statistical Software release 13.1 (Stata Corp., College Station, TX). This study was approved by the human research ethics committee of the Sydney Local Health District, Royal Prince Alfred Hospital Zone.
Results
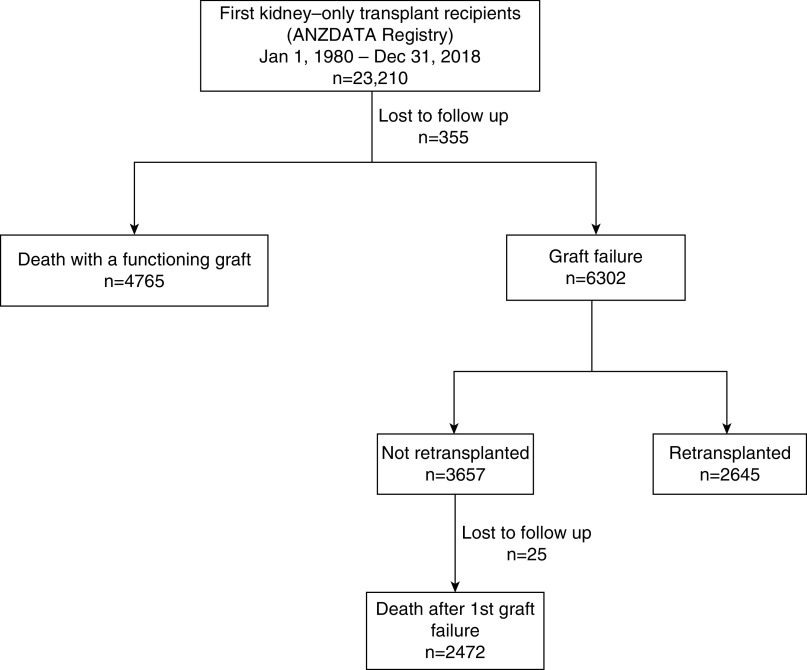
Between January 1, 1980 and December 31, 2018, 23,210 Australian and New Zealand patients received their first kidney transplant. A total of 7237 deaths occurred, 4765 with a functioning graft, and 2472 after first graft failure and then not retransplanted (Figure 1). Table 1 shows the baseline characteristics of recipients by transplant era. There were minimal missing baseline variables after 1990, because some variables (e.g., body mass index and smoking) were added after 1985 (Supplemental Table 2).
Figure 1.
Death and graft failure outcomes of all first kidney-only transplant recipients, 1980-2018.
Table 1.
Baseline characteristics of transplant recipients by era in Australia and New Zealand
| Characteristics | Transplant Era, n (%) | |||
|---|---|---|---|---|
| 1980–1989 (n=3964) | 1990–1999 (n=4728) | 2000–2009 (n=6214) | 2010–2018 (n=8304) | |
| Age at transplant, in years (n=23,210) | ||||
| <18 | 307 (8) | 319 (7) | 351 (6) | 404 (5) |
| 18–34 | 1150 (29) | 1190 (25) | 1157 (19) | 1108 (13) |
| 35–49 | 1321 (33) | 1528 (32) | 1958 (32) | 2058 (25) |
| 50–65 | 1137 (29) | 1503 (32) | 2292 (37) | 3480 (42) |
| >65 | 49 (1) | 188 (4) | 456 (7) | 1254 (15) |
| Sex (n=23,210) | ||||
| Female | 1673 (42) | 1919 (41) | 2354 (38) | 2983 (36) |
| Male | 2291 (58) | 2809 (59) | 3860 (62) | 5321 (64) |
| Ethnicity (n=23,210) | ||||
| White | 3512 (89) | 3957 (84) | 5095 (82) | 5840 (70) |
| Indigenousa | 98 (2) | 157 (3) | 195 (3) | 273 (3) |
| Asian | 159 (4) | 328 (7) | 571 (9) | 1063 (13) |
| Other | 195 (5) | 285 (6) | 352 (6) | 908 (11) |
| Not reported | 0 (0) | 1 (0) | 1 (0) | 220 (3) |
| Time since first RRT (n=23,210) | ||||
| 0–1 yr | 1775 (45) | 1668 (35) | 1988 (32) | 2592 (31) |
| 1–3 yr | 1645 (42) | 1883 (40) | 2122 (34) | 2737 (33) |
| >3 yr | 544 (14) | 1177 (25) | 2104 (34) | 2975 (36) |
| Primary renal disease (n=23,210) | ||||
| GN | 1650 (42) | 2303 (49) | 2910 (47) | 3166 (38) |
| Renovascular | 152 (4) | 166 (4) | 276 (4) | 593 (7) |
| Diabetes | 239 (6) | 329 (7) | 518 (8) | 1203 (14) |
| Other | 1699 (43) | 1748 (37) | 2262 (36) | 2813 (34) |
| Uncertain | 224 (6) | 182 (4) | 248 (4) | 379 (5) |
| Not reported | 0 (0) | 0 (0) | 0 (0) | 150 (2) |
| Dialysis modality before transplant (n=23,210) | ||||
| Pre-emptive transplant | 90 (2) | 245 (5) | 807 (13) | 1084 (13) |
| HD | 2844 (72) | 3105 (66) | 3924 (63) | 4784 (58) |
| PD | 1030 (26) | 1378 (29) | 1483 (24) | 2436 (29) |
| Diabetes as comorbidity (n=21,483) | 261 (10) | 437 (10) | 743 (12) | 1752 (21) |
| Chronic lung disease (n=21,020) | 54 (2) | 170 (4) | 365 (6) | 672 (8) |
| CV disease (n=21,116) | 163 (7) | 522 (12) | 1193 (19) | 2037 (25) |
| Non–skin cancer diagnosis before transplant (n=23,210) | 60 (2) | 154 (3) | 264 (4) | 538 (6) |
| Number of HLA mismatches (n=22,763) | ||||
| 0 | 176 (5) | 275 (6) | 402 (6) | 322 (4) |
| 1–2 | 1488 (40) | 1912 (40) | 1867 (30) | 2069 (25) |
| 3–4 | 1786 (48) | 1919 (41) | 2285 (37) | 2813 (35) |
| 5–6 | 269 (7) | 610 (13) | 1637 (26) | 2933 (36) |
| Donor type/ischemia time (n=23,210) | ||||
| LD | 471 (12) | 1197 (25) | 2779 (45) | 2650 (32) |
| DD, <12 h | 83 (2) | 547 (12) | 1018 (16) | 2963 (36) |
| DD, 12–18 h | 244 (6) | 1499 (32) | 1670 (27) | 1824 (22) |
| DD, ≥18 h | 1284 (32) | 1385 (29) | 699 (11) | 592 (7) |
| Unknown | 1882 (48) | 100 (2) | 48 (1) | 275 (3) |
| CNI at transplant (n=23,058) | 2095 (54) | 4544 (96) | 6006 (97) | 7936 (96) |
| Tacrolimus | 0 (0) | 82 (2) | 2397 (39) | 6904 (84) |
| Cyclosporin | 2095 (54) | 4463 (94) | 3609 (58) | 1041 (13) |
| Antimetabolite at transplant (n=23,058) | 2849 (74) | 4321 (91) | 5864 (94) | 7943 (96) |
| Mycophenolate | 0 (0) | 945 (20) | 5721 (92) | 7919 (96) |
| Azathioprine | 2849 (74) | 3376 (71) | 144 (2) | 29 (0) |
| Prednisolone at transplant (n=23,058) | 3015 (78) | 4257 (90) | 6036 (97) | 7989 (97) |
| mTOR at transplant (n=23,058) | 0 (0) | 224 (5) | 278 (4) | 54 (1) |
| Anti-CD25 Rx (basiliximab or daclizumab) | 1 (0) | 46 (1) | 3430 (55) | 7445 (90) |
| T cell depletion (muromonab-CD3, antithymocyte globulin agents, or alemtuzumab) | 371 (9) | 312 (7) | 209 (3) | 342 (4) |
| BMI at transplant (n=17,621)b | ||||
| Underweight (<18.5 kg/m2) | 67 (8) | 138 (4) | 192 (3) | 187 (2) |
| Normal (18.5 to <25 kg/m2) | 551 (62) | 1783 (52) | 2446 (42) | 2464 (33) |
| Overweight (25 to <30 kg/m2) | 222 (25) | 1066 (31) | 2101 (36) | 2721 (36) |
| Obese (≥30 kg/m2) | 48 (5) | 446 (13) | 1112 (19) | 2077 (28) |
| Smoking status at RRT entry (n=19,615) | ||||
| Current | 210 (16) | 487 (12) | 680 (11) | 713 (9) |
| Former | 263 (20) | 1122 (28) | 1849 (30) | 2749 (34) |
| Never | 866 (65) | 2348 (59) | 3678 (59) | 4650 (57) |
| eGFR category 1 mo after transplant (n=21,283) | ||||
| <15 ml/min | 325 (10) | 212 (5) | 158 (3) | 270 (4) |
| 15 to <30 ml/min | 561 (18) | 495 (11) | 594 (10) | 875 (11) |
| 30 to <60 ml/min | 1576 (49) | 2503 (57) | 3270 (55) | 3973 (51) |
| 60 to <90 ml/min | 564 (18) | 957 (22) | 1563 (26) | 2090 (27) |
| ≥90 ml/min | 162 (5) | 224 (5) | 343 (6) | 568 (7) |
HD, hemodialysis; PD, peritoneal dialysis; CV, cardiovascular; LD, living donor; DD, deceased donor; CNI, calcineurin inhibitor; mTOR, mammalian target of rapamycin; Rx, prescription; BMI, body mass index.
Indigenous: Aboriginal and Torres Strait Islanders.
BMI for adult patients (≥18 yr old) only.
The proportion of recipients >50 years old increased from 30% in 1980–1989 to 56% in 2010–2018. The majority of recipients were men (increased from 58% in 1980–1989 to 64% in 2010–2018) and White (declined from 89% in 1980–1989 to 72% in 2010–2018). The proportion of patients with comorbid diabetes mellitus increased from 10% in 1980–1989 to 21% in 2010–2018. Similarly, comorbid cardiovascular disease increased from 7% in 1980–1989 to 25% in 2010–2018. The proportion of recipients who were obese (body mass index >30 kg/m2) increased from 5% in 1980 to 28% in 2010–2018. Immunosuppression changed from a predominance of cyclosporine, azathioprine, and prednisolone maintenance therapy between 1980 and 1999, to tacrolimus, mycophenolate, and prednisolone in 2010–2018.
Death with a Functioning Graft
All-Cause Deaths
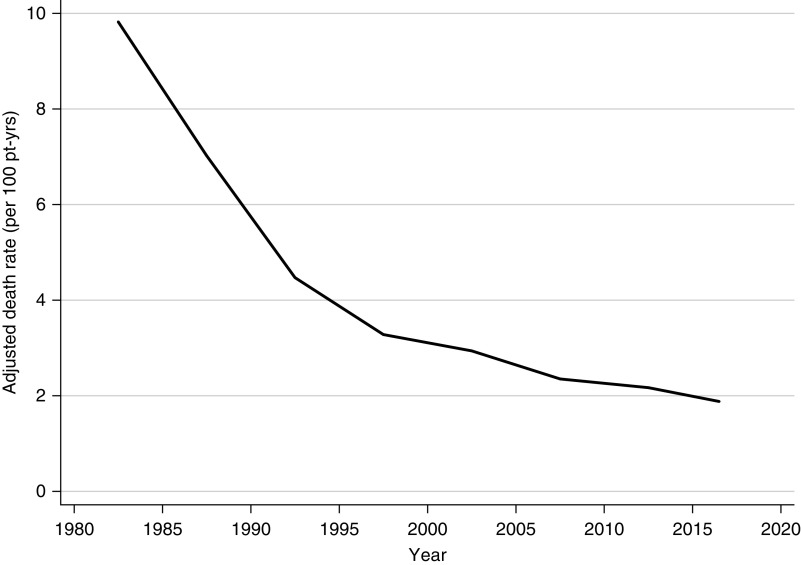
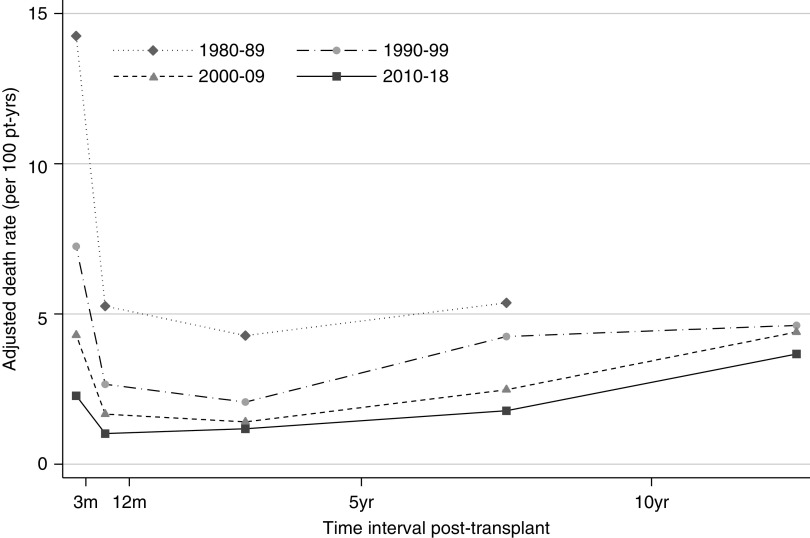
The median follow-up time was 6.7 years (interquartile range, 2.4–12.5 years). The total follow-up time was 195,420 person-years. The adjusted 5-year, all-cause death rate decreased significantly from 9.8 per 100 patient-years in 1980–1984, to 1.9 per 100 patient-years in 2015–2018 (Figure 2). Figure 3 shows the adjusted all-cause death rates by time periods post-transplant. Improvements in adjusted all-cause death rates over time were seen in all periods post-transplant, although it was most marked in the acute post-transplant period (0–3 months).
Figure 2.
The adjusted 5-year all-cause death rate has reduced significantly over the last 40 years. Adjusted all-cause death rate (per 100 patient-years), 1980–2018. Rates adjusted for age at transplant, sex, ethnicity, duration of dialysis, donor type, cause of kidney disease, and time period post-transplant. Pt-yrs, patient-years.
Figure 3.
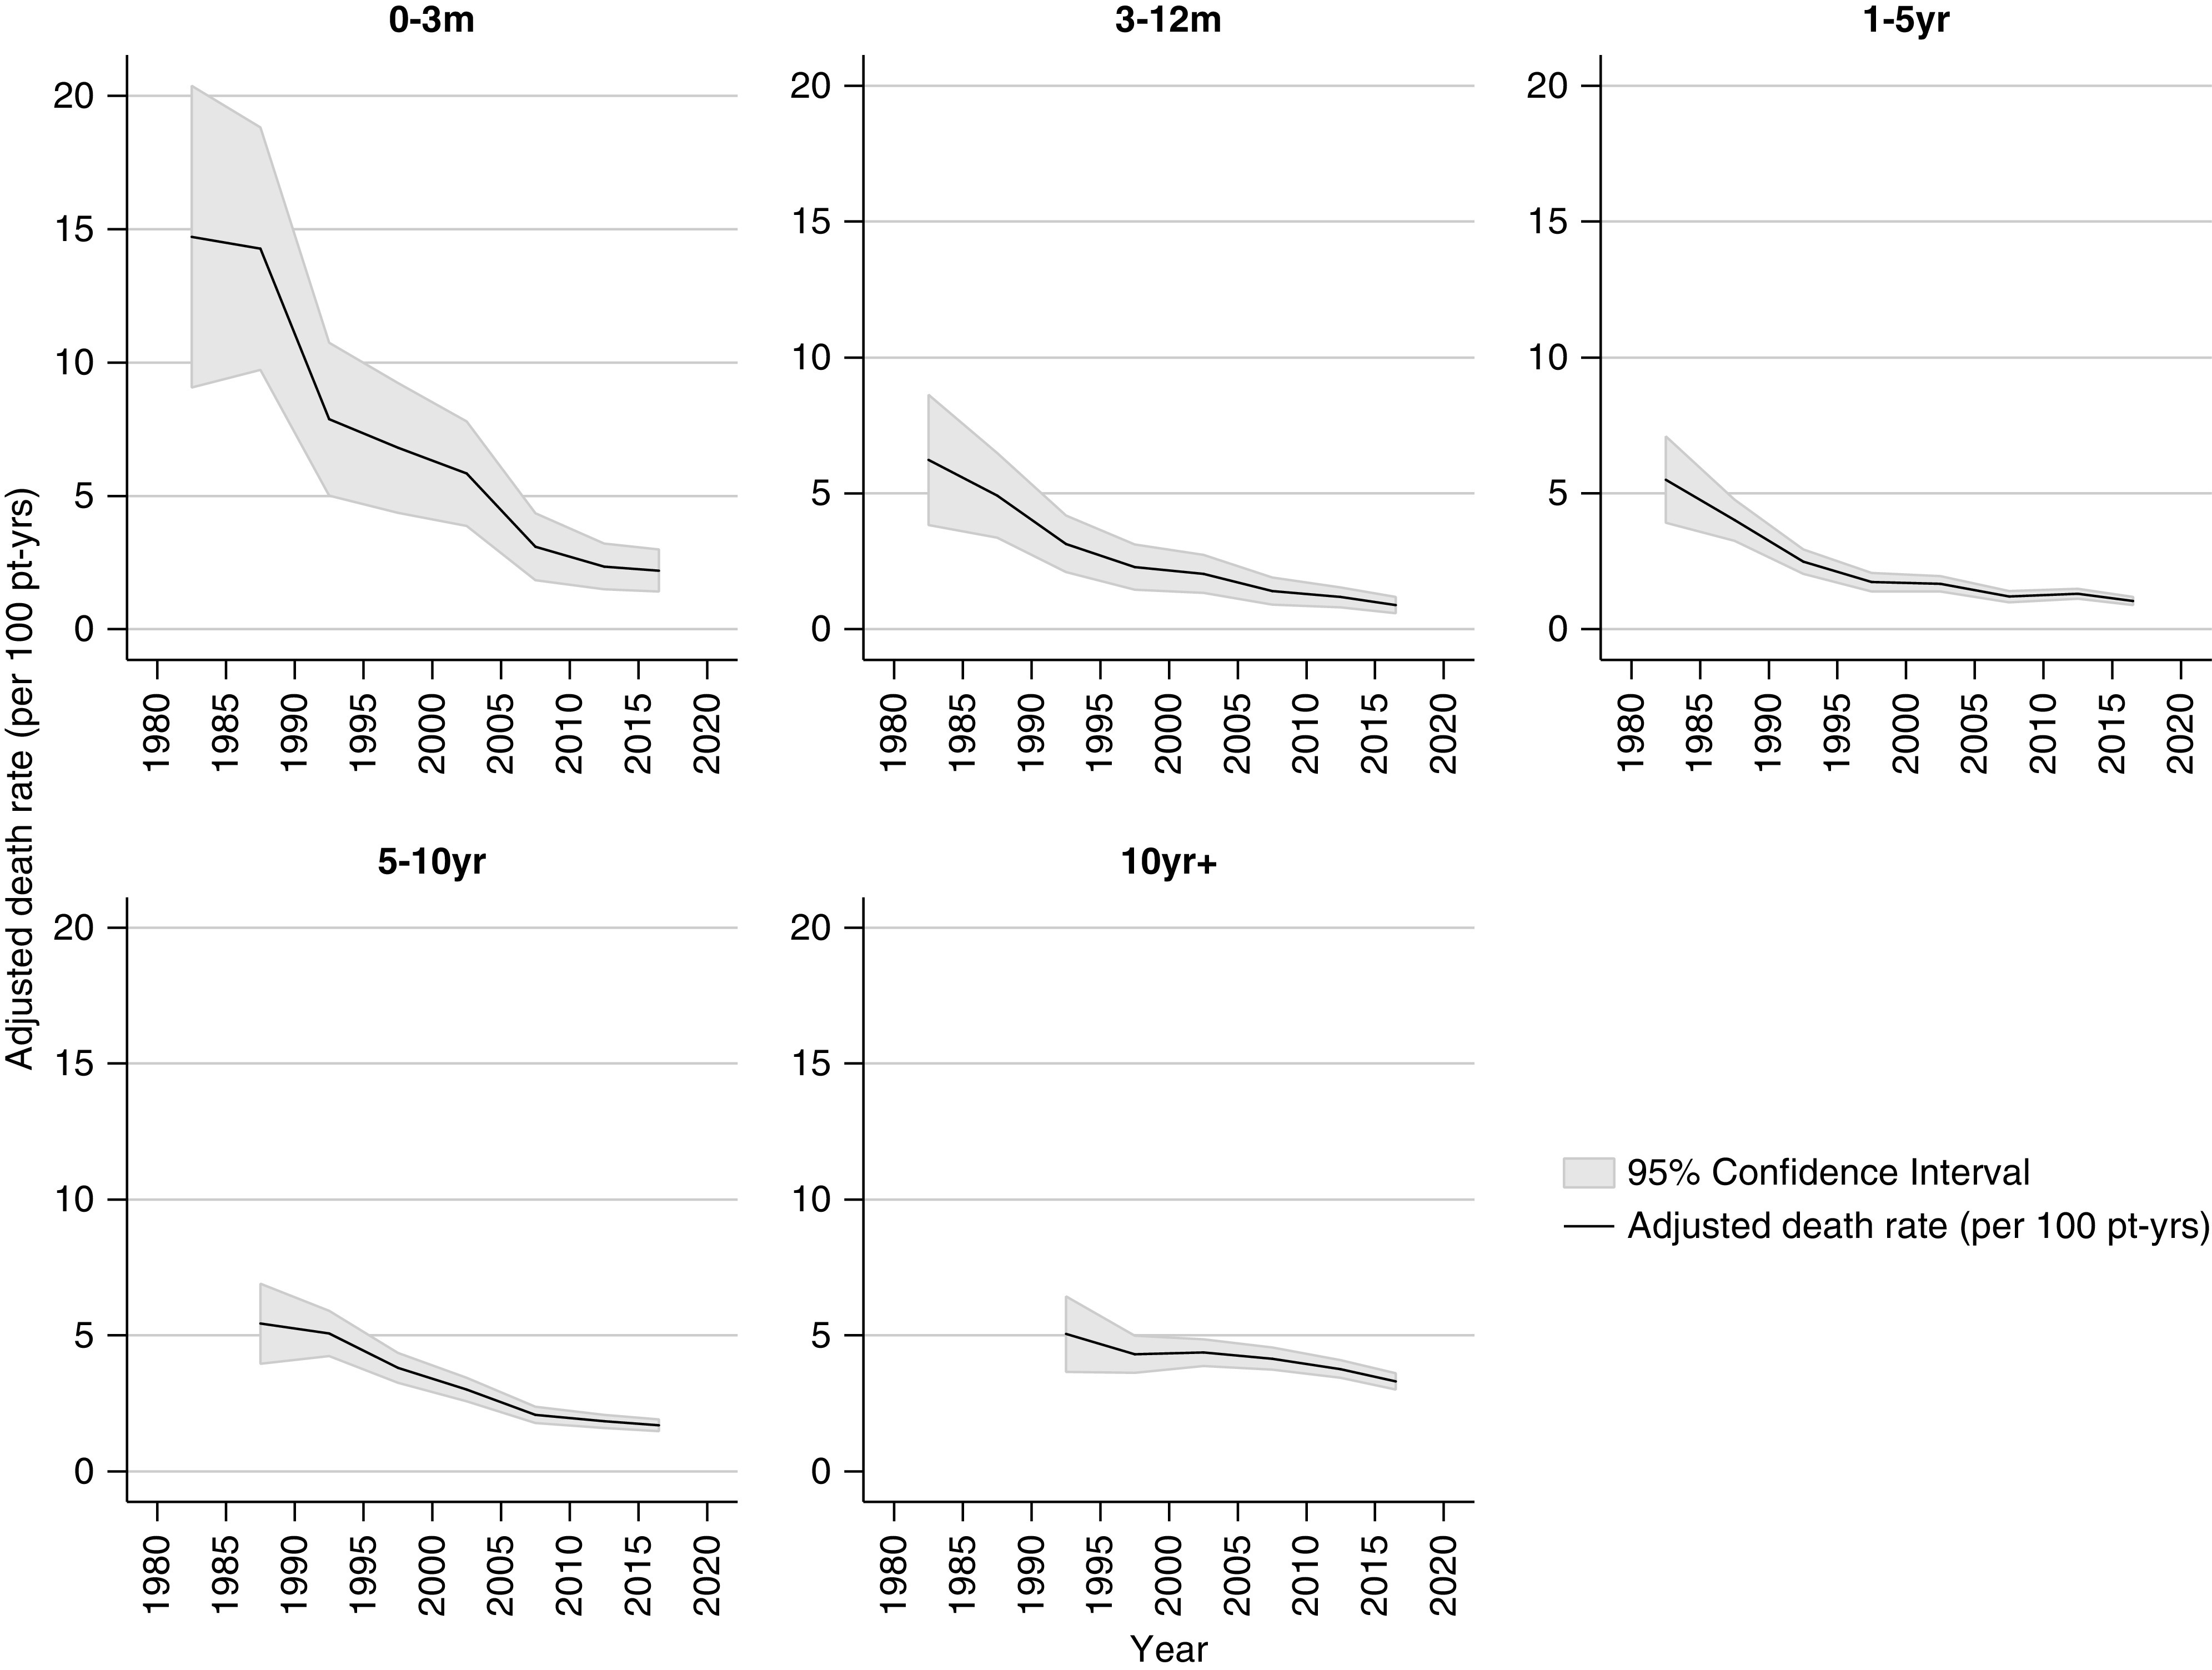
A reduction in death with a functioning graft was seen at all time periods post-transplants. Rates adjusted for age at transplant, sex, ethnicity, duration of dialysis, donor type, cause of kidney disease, and stratified by time period post-transplant. Pt-yrs, patient-years.
The risk of death varied by time post-transplant during all eras studied, with all-cause mortality exhibiting a U-shaped curve reflecting high risk during the first 3 months post-transplant, a reduction in risk through 3–12 months and 1–5 years, followed by progressive increases in risk of death at 5–10 years and ≥10 years post-transplant. The height of the curve has fallen evenly over successive eras (Figure 4).
Figure 4.
The risk of death by time post-transplant exhibitis a U-shaped curve, reflecting high risk during the first 3 months post-transplant, a reduction in risk through 3–12 months and 1–5 years, followed by progressive increases in risk of death at 5–10 years and ≥10 years post-transplant. The height of the curve has fallen over successive eras. Rates adjusted for age at transplant, sex, ethnicity, duration of dialysis, donor type, cause of kidney disease, and stratified by time period post-transplant. Pt-yrs, patient-years.
Cause-Specific Deaths, by Time Period Post-transplant
Table 2 shows the overall deaths attributed to each cause by era. Of 4765 deaths between 1980 and 2018, 1731 (36.3%) were due to cardiovascular disease, 1308 (27.5%) were cancer related, 805 (16.9%) were infection related, and 921 (19.3%) were due to other causes. The majority of other causes were classified as unknown; however, gastrointestinal disorders, withdrawal of therapy, graft failure without return to dialysis, suicides, and accidents were other prominent causes (Table 3). Deaths from cardiovascular disease and infection showed a similar U-shape curve over time post-transplant (Figure 4). In contrast, risk of death from cancer was rare early after transplant, but increased steadily with time post-transplant (Figure 5).
Table 2.
Cause of death with a functioning graft (raw count), by era (calendar period)
| Period | Causes of Death (n) | ||||
|---|---|---|---|---|---|
| Cardiovascular | Cancer | Infection Related | Other | Total | |
| 1980–1984 | 50 | 7 | 27 | 27 | 111 |
| 1985–1989 | 135 | 36 | 58 | 45 | 274 |
| 1990–1994 | 181 | 89 | 66 | 77 | 413 |
| 1995–1999 | 224 | 143 | 91 | 71 | 529 |
| 2000–2004 | 252 | 214 | 126 | 112 | 704 |
| 2005–2009 | 299 | 238 | 129 | 95 | 761 |
| 2010–2014 | 310 | 318 | 172 | 208 | 1008 |
| 2015–2018 | 280 | 263 | 136 | 286 | 965 |
| Total | 1731 | 1308 | 805 | 921 | 4765 |
Table 3.
Causes of death with a functioning graft (other deaths)
| Causes of Death: Other Deaths | Timing of Death Post-transplant (n) | ||
|---|---|---|---|
| <1 yr | ≥1 yr | Total | |
| Gastrointestinal hemorrhage | 8 | 23 | 31 |
| Hemorrhage from dialysis access site | 1 | 2 | 3 |
| Hemorrhage from transplant artery | 4 | 0 | 4 |
| Hemorrhage from elsewhere | 9 | 30 | 39 |
| Withdrawal, psychosocial reasons | 1 | 65 | 66 |
| Patient refused treatment | 0 | 22 | 22 |
| Suicide | 6 | 36 | 42 |
| Therapy ceased, other reasons | 4 | 15 | 19 |
| Accidental death (all causes) | 4 | 42 | 46 |
| Hepatic failure | 8 | 39 | 47 |
| Uremia caused by graft failure | 2 | 54 | 56 |
| Pancreatitis | 8 | 22 | 30 |
| Bone marrow depression | 1 | 3 | 4 |
| Cachexia | 0 | 29 | 29 |
| Unknown | 12 | 274 | 286 |
| Perforation of abdominal viscus | 7 | 38 | 45 |
| Dialysis dementia (aluminum) | 1 | 0 | 1 |
| Other | 19 | 132 | 151 |
| Total | 95 | 826 | 921 |
Figure 5.
Cancer death match cardiovascular death beyond the first post-transplant year. Rates adjusted for age at transplant, sex, ethnicity, duration of dialysis, donor type, cause of kidney disease, and stratified by time period post-transplant. CV, cardiovascular; pt-yrs, patient-years.
In the acute post-transplant period (0–3 months), overall death rates have continued to decline into 2018 (Figure 3). In the current era (2015–2018), cardiovascular deaths remained the most common cause of early death (1.18 per 100 patient-years), followed by other deaths (0.6 per 100 patient-years), and infection-related deaths (0.42 per 100 patient-years) (Figure 6, Table 4). No cancer deaths occurred in the 3 months post-transplant during 2015–2018.
Figure 6.
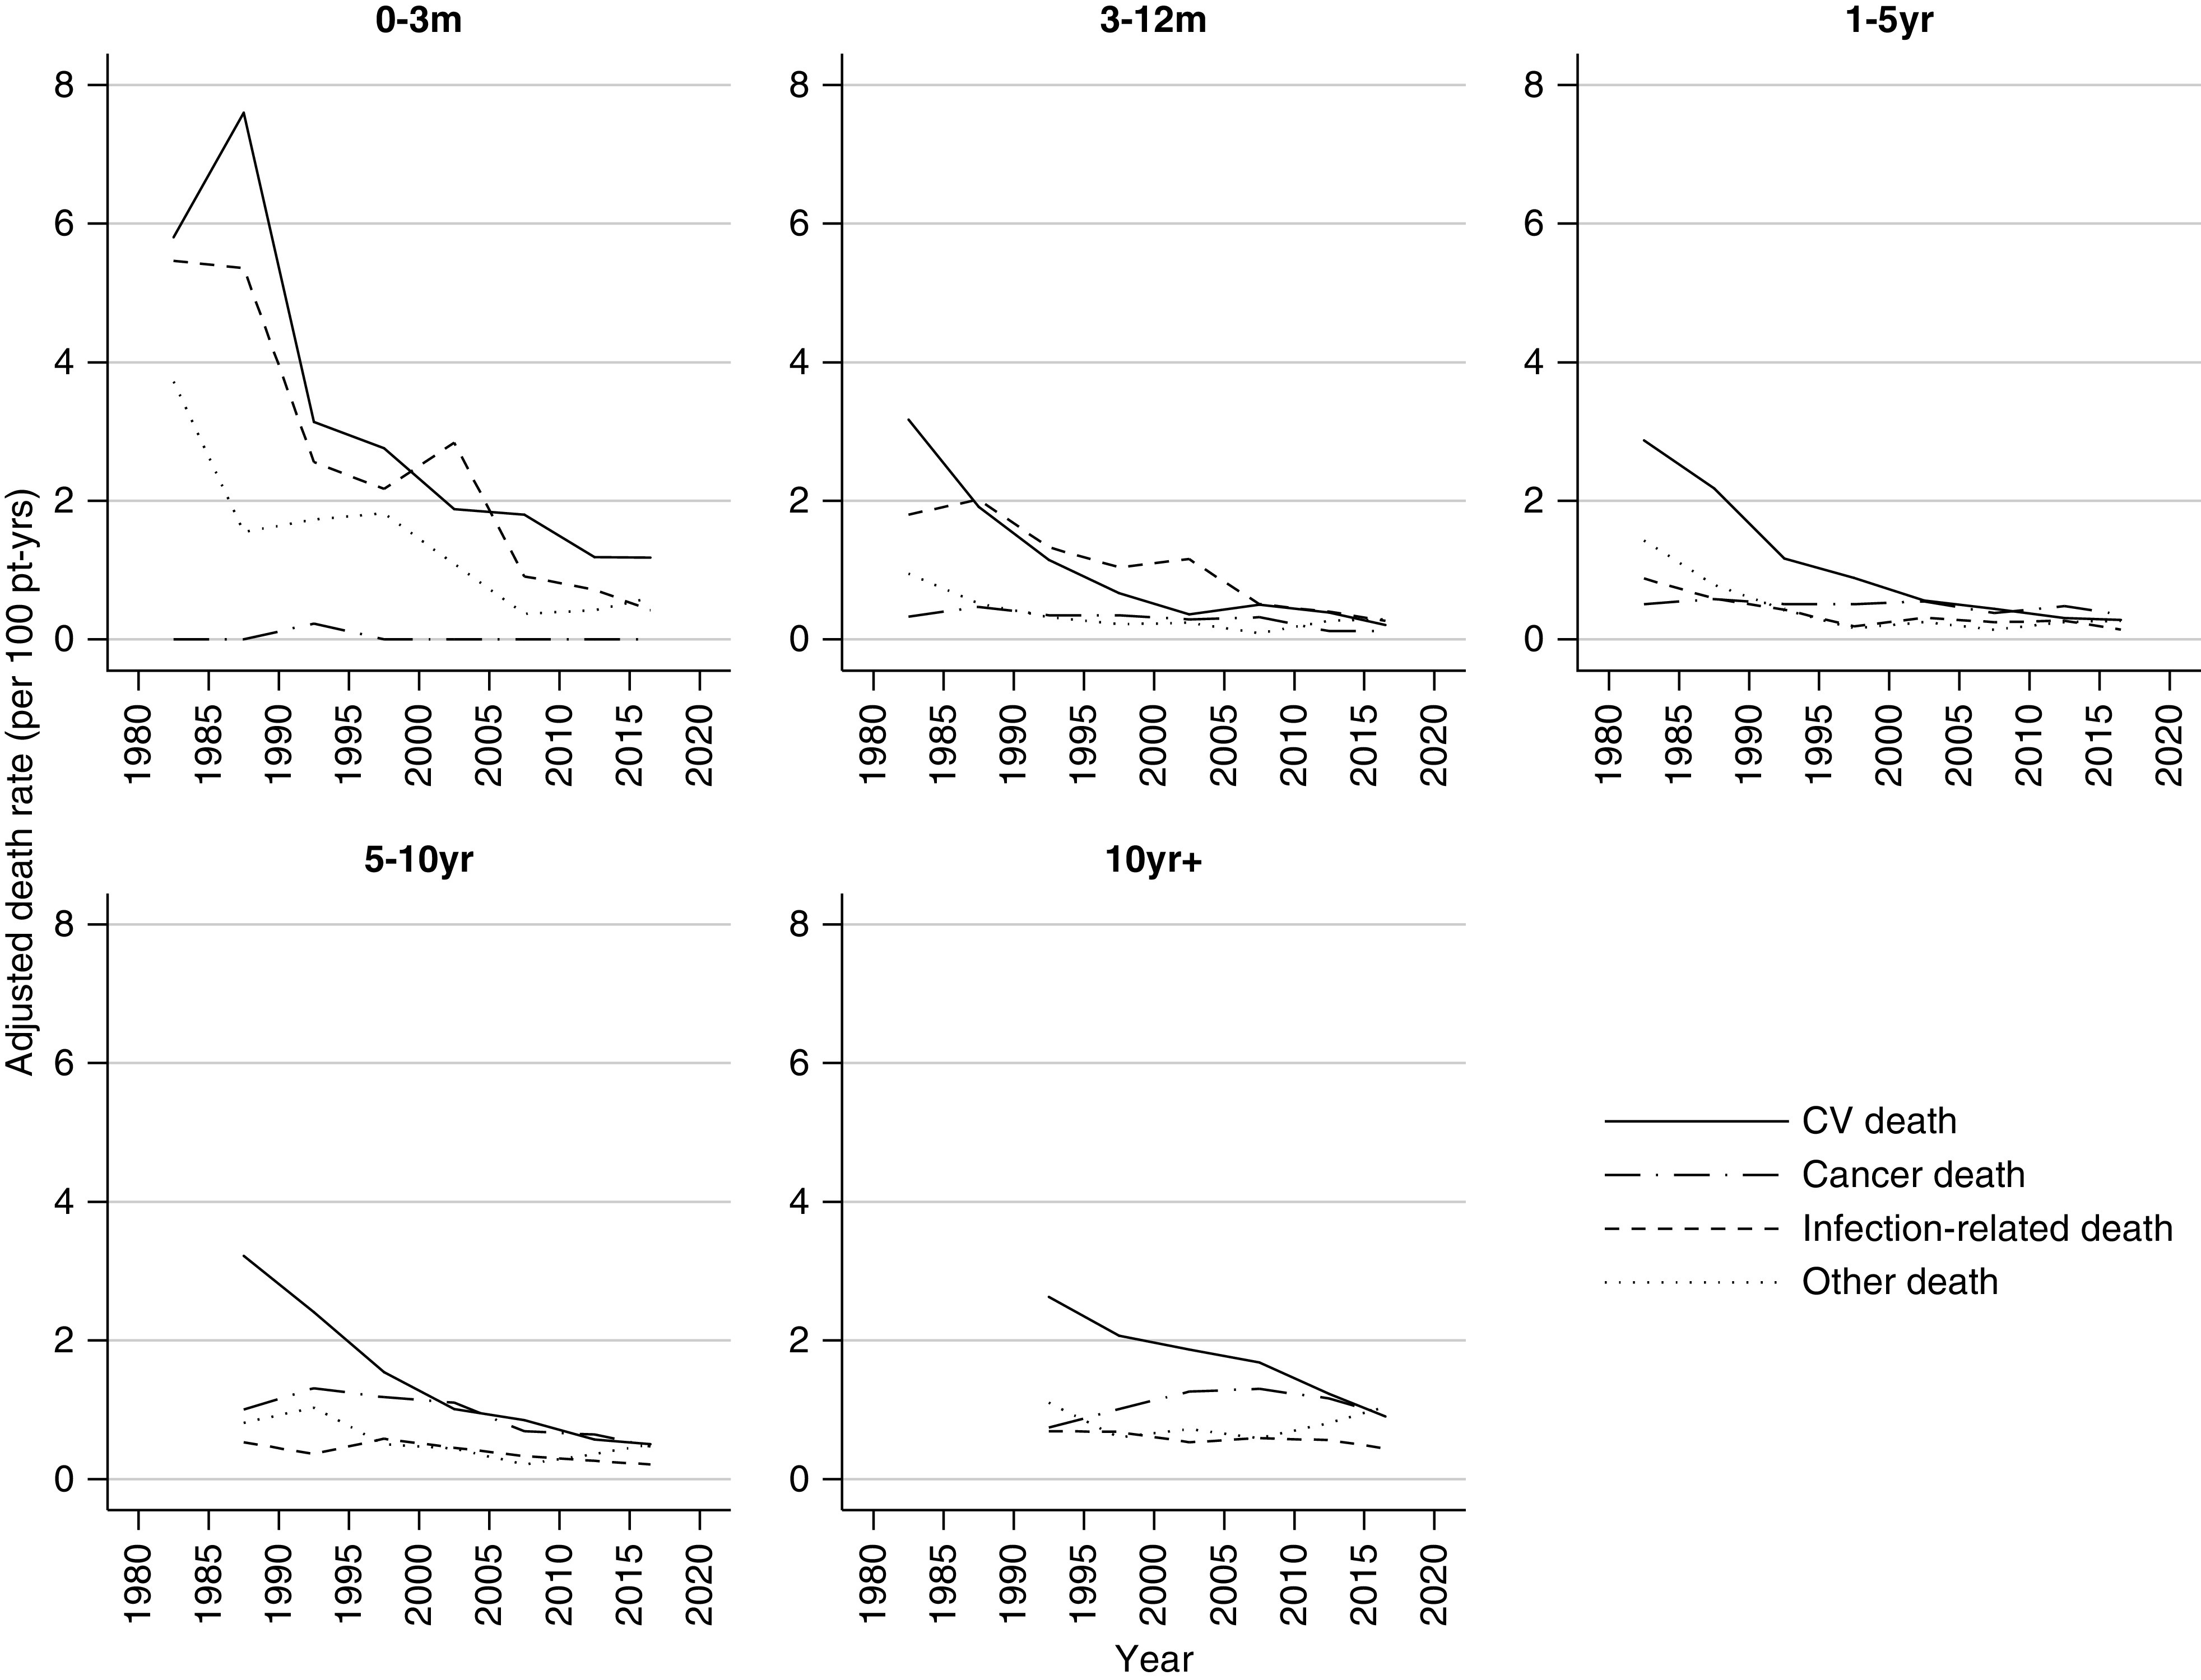
Cause-specific death have declined at all time periods post-transplant over the last 40 years. Rates adjusted for age at transplant, sex, ethnicity, duration of dialysis, donor type, cause of kidney disease, and stratified by time period post-transplant. CV, cardiovascular; pt-yrs, patient-years.
Table 4.
Death with a functioning graft
| Period | Time Period Post-transplant | Adjusted Death Rates (per 100 patient-years) | ||||
|---|---|---|---|---|---|---|
| All Cause | CV | Cancer | Infection Related | Other | ||
| 1980–1984 | 0–3 mo | 14.72 | 5.80 | 0.00 | 5.46 | 3.72 |
| 3–12 mo | 6.23 | 3.17 | 0.33 | 1.80 | 0.95 | |
| 1–5 yr | 5.50 | 2.87 | 0.51 | 0.88 | 1.43 | |
| 1985–1989 | 0–3 mo | 14.27 | 7.60 | 0.00 | 5.36 | 1.55 |
| 3–12 mo | 4.92 | 1.91 | 0.47 | 2.02 | 0.52 | |
| 1–5 yr | 4.01 | 2.18 | 0.58 | 0.59 | 0.79 | |
| 5–10 yr | 5.43 | 3.22 | 1.00 | 0.53 | 0.81 | |
| 1990–1994 | 0–3 mo | 7.88 | 3.14 | 0.23 | 2.56 | 1.73 |
| 3–12 mo | 3.14 | 1.15 | 0.35 | 1.33 | 0.32 | |
| 1–5 yr | 2.49 | 1.17 | 0.51 | 0.43 | 0.43 | |
| 5–10 yr | 5.07 | 2.41 | 1.31 | 0.36 | 1.03 | |
| >10 yr | 5.05 | 2.63 | 0.74 | 0.69 | 1.10 | |
| 1995–1999 | 0–3 mo | 6.81 | 2.76 | 0.00 | 2.17 | 1.82 |
| 3–12 mo | 2.29 | 0.67 | 0.35 | 1.04 | 0.22 | |
| 1–5 yr | 1.73 | 0.89 | 0.51 | 0.19 | 0.16 | |
| 5–10 yr | 3.80 | 1.54 | 1.18 | 0.58 | 0.50 | |
| >10 yr | 4.30 | 2.07 | 1.01 | 0.68 | 0.60 | |
| 2000–2004 | 0–3 mo | 5.84 | 1.88 | 0.00 | 2.84 | 1.09 |
| 3–12 mo | 2.03 | 0.36 | 0.29 | 1.16 | 0.24 | |
| 1–5 yr | 1.67 | 0.56 | 0.55 | 0.31 | 0.25 | |
| 5–10 yr | 3.01 | 1.01 | 1.10 | 0.45 | 0.44 | |
| >10 yr | 4.37 | 1.87 | 1.26 | 0.53 | 0.72 | |
| 2005–2009 | 0–3 mo | 3.09 | 1.80 | 0.00 | 0.91 | 0.37 |
| 3–12 mo | 1.41 | 0.50 | 0.32 | 0.51 | 0.09 | |
| 1–5 yr | 1.20 | 0.44 | 0.38 | 0.25 | 0.14 | |
| 5–10 yr | 2.07 | 0.85 | 0.69 | 0.33 | 0.21 | |
| >10 yr | 4.14 | 1.68 | 1.30 | 0.59 | 0.59 | |
| 2010–2014 | 0–3 mo | 2.35 | 1.19 | 0.00 | 0.72 | 0.42 |
| 3–12 mo | 1.18 | 0.39 | 0.12 | 0.40 | 0.27 | |
| 1–5 yr | 1.30 | 0.31 | 0.48 | 0.27 | 0.25 | |
| 5–10 yr | 1.84 | 0.57 | 0.64 | 0.26 | 0.36 | |
| >10 yr | 3.76 | 1.23 | 1.16 | 0.56 | 0.81 | |
| 2015–2018 | 0–3 mo | 2.20 | 1.18 | 0.00 | 0.42 | 0.60 |
| 3–12 mo | 0.88 | 0.21 | 0.12 | 0.27 | 0.29 | |
| 1–5 yr | 1.04 | 0.28 | 0.36 | 0.14 | 0.27 | |
| 5–10 yr | 1.69 | 0.50 | 0.47 | 0.21 | 0.50 | |
| >10 yr | 3.30 | 0.90 | 0.93 | 0.44 | 1.04 | |
Adjusted death rates by time period post-transplant. Death rates adjusted for age at transplant, sex, ethnicity, duration of dialysis, donor type (living versus deceased donor), and cause of kidney disease. CV, cardiovascular.
During the period 3–12 months post-transplant, the risk of cardiovascular and infection-related deaths have significantly declined since 1980–1985, whereas cancer and other death rates have remained stable. Overall death rates during this time period were the lowest among all of the post-transplant periods at 0.88 per 100 patient-years (Figure 6, Table 4).
In the medium term, 1 to <5 years and 5 to <10 years post-transplant, cardiovascular deaths declined substantially with modest reductions evident for cancer (Supplemental Tables 3, 4, and 5, Table 4). The incidence of cardiovascular death for those 1–5 years post-transplant fell from 2.87 per 100 patient-years in 1980–1984 to 0.28 in 2015–2018, whereas cancer deaths declined from 0.51 per 100 patient-years in 1980–1984 to 0.36 in 2015–2018. Death rates during this time period post-transplant were the lowest for all death categories in 2015–2018 compared with all other eras (Table 4).
For recipients ≥10 years post-transplant (2015–2018), the most common causes of death were other (1.04 per 100 patient-years), cancer (0.93 per 100 patient-years), and cardiovascular deaths (0.90 per 100 patient-years). Patients ≥10 years post-transplant were less likely to die in 2015–2018 compared with preceding eras (versus 2000–2014, adjusted hazard ratio [HR], 0.88; 95% CI, 0.77 to 0.99; and versus 2005–2009, adjusted HR, 0.80; 95% CI, 0.69 to 0.90) (Supplemental Table 3). The risk of cardiovascular and cancer deaths have reduced significantly during this time period compared with earlier eras, as shown by Supplemental Tables 4 and 5. The risk of dying from cardiovascular disease was 66% lower in 2015–2018 compared with 1990–1994 (adjusted HR, 0.34; 95% CI, 0.19 to 0.49), whereas reductions in cancer deaths were seen from 2000 onwards (2015–2018 versus 2000–2004, adjusted HR, 0.74; 95% CI, 0.54 to 0.94).
We examined the incidence, timing, and causes of death after transplantation by era, without censoring for graft failure in a sensitivity analysis. Total follow-up increased to 219,280 patient-years and median follow-up increased to 7.8 years (interquartile range, 3.3–13.9 years). Similar results were shown in all-cause and cause-specific deaths and in trends over time (Supplemental Figures 1 and 2).
Death after Graft Failure
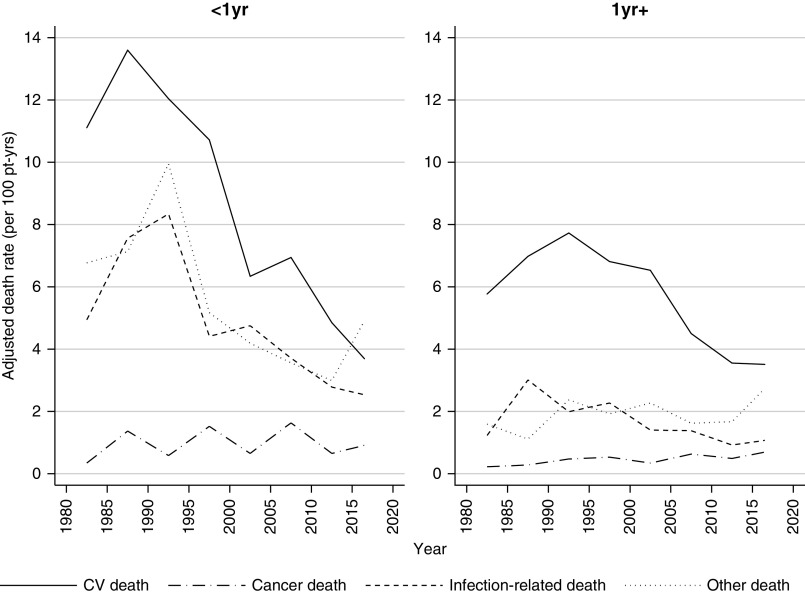
Among 3657 recipients who experienced graft failure and were not retransplanted, 2472 deaths occurred (Figure 1). The median follow-up time after graft failure was 2.4 years (interquartile range, 0.9–5.3 years). Death was most commonly attributed to cardiovascular disease (50%), followed by “other” deaths (25%), infection (19%), and cancer (6%) (Table 5). The incidence of death was high during the first year after graft failure (12.1 per 100 patient-years in 2015–2018) and modestly lower after the first year (8.0 per 100-years in 2015–2018) (Supplemental Tables 6 and 7). The incidence of all-cause and cause-specific deaths declined over eras, most notably for cardiovascular and infection-related deaths (Figure 7, Supplemental Table 7). Cardiovascular death was the most common cause of death at all time periods post–graft failure and in all eras, except 2015–2018, where death due to other causes in the first year predominated. The majority of other deaths were due to dialysis-related issues such as dialysis withdrawal, patient refusal of treatment, or cessation of treatment (Supplemental Table 8).
Table 5.
Causes of death after first graft failure by follow-up era (censored at retransplant)
| Causes of Death after First Graft Failure | Follow-Up Era (n) | ||||
|---|---|---|---|---|---|
| 1980–1989 | 1990–1999 | 2000–2009 | 2010–2018 | Total | |
| Cardiovascular | 167 | 302 | 390 | 381 | 1240 |
| Cancer | 9 | 24 | 46 | 63 | 142 |
| Infection | 95 | 128 | 132 | 127 | 482 |
| Other | 64 | 129 | 160 | 255 | 608 |
| Total | 335 | 583 | 728 | 826 | 2472 |
Death rates adjusted for age at graft failure, sex, ethnicity, duration of dialysis, donor type, cause of kidney disease, and duration of graft failure.
Figure 7.
Comparative causes of death after graft failure; cardiovascular death remain common but the rate has declined. Adjusted cause-specific death rate after graft failure, censored at retransplant, by time post–graft failure. Rates adjusted for age at graft failure, sex, ethnicity, duration of dialysis, cause of kidney disease, donor type, and duration of time with a functioning graft. CV, cardiovascular; pt-yrs, patient-years.
Discussion
Our study of >23,000 recipients over the past 40 years in Australia and New Zealand provides reassuring insights into contemporary mortality rates and causes of death after kidney transplantation. Despite a shift toward recipients who are older and have more comorbidities, mortality risk has declined for recipients at all time periods post-transplant, including the high-risk early post-transplant period (0–3 months), early maintenance phases (1–5 years), and into the longer-term (≥10 years) post-transplant. Trends in cause-specific mortality have also changed over time, driven by sustained reductions in cardiovascular deaths since 1980 and more modest reductions in cancer deaths since 2000. It should be seen as a major success that the greatest improvements in death have occurred in the early post-transplant period. Despite dramatic reductions in early post-transplant mortality, however, the first 3 months remain a high-risk period for death from cardiovascular disease and infection. Cancer and cardiovascular disease are the key drivers of mortality beyond 1 year post-transplant. Among those who experienced graft failure, death was common within the first year after graft failure, consequent to cardiovascular disease and dialysis-specific factors.
Although reductions in cardiovascular and infection-related deaths in transplant recipients have been documented around the world,9–13 studies examining trends in cancer death have shown conflicting results.10–12 Concerns regarding an increased risk of cancer in the contemporary era have been raised in the context of tacrolimus, mycophenolate, and steroid immunosuppression, and the poor survival recipients face after receiving a cancer diagnosis.14 A previous registry study suggested an increase in cancer death rates between 1980 and 2007.10 However, this study did not adjust for post-transplant duration, causing an enrichment of long-term recipients within successive eras that may have magnified the cancer death rates in each subsequent era. Another study reported a small improvement in cancer mortality in 2000–2012 compared with 1990–1999.12 Our study provides a comprehensive analysis of cause-specific death rates by transplant era and, importantly, has been adjusted for time post-transplantation. Reassuringly, no excess and, indeed, modest reductions in cancer deaths were seen. Our study enhances the understanding of post-transplant cancer mortality by examining its trends in clinically significant periods post-transplant. Cancer deaths were extremely uncommon in the first 12 months post-transplant but emerged as a significant contributor to mortality beyond 12 months. This is due to a relatively greater reduction in cardiovascular death post-transplant, rather than an absolute increase in cancer death rates in the contemporary era.
Risk of death for patients ≥10 years post-transplant has also steadily declined across the eras studied, although less dramatically than for earlier time points. Long-term patients in 2018 were 12% less likely to die than patients in 2010–2014, suggesting long-term outcomes have continued to improve. Although the prevailing view among the transplant community is that long-term outcomes have not improved significantly,15,16 an emerging body of work has demonstrated incremental improvements to long-term graft and patient survival. A study of short- and long-term graft survival in >100,000 deceased donor kidney transplant recipients in Europe found that long-term graft survival appeared to be improving, with an annualized reduction in the incidence of graft failure of 3% per year.5 This study examined death-censored graft survival and did not report death with a functioning graft. In children receiving their first kidney transplant, a study of 17,000 pediatric recipients from the United States showed a significant decrease in all-cause mortality from 1990 to 2010.17 Pediatric recipients from Australia and New Zealand have also seen improved survival in the recent era.18 The reductions in all-cause death from our study were most marked between 1980 and 2010, however, death rates have continued to fall in successive eras since 2010. These improvements are particularly remarkable in the context of the changing landscape of donor and recipient characteristics which, on balance, would be expected to increase risks of death.
Consistent with a large meta-analysis, our data indicate that the rate of death early after graft failure remains unacceptably high.19 Our results are restricted to patients who were not retransplanted, and thus likely represent a selected group of patients. However, like improvements shown in death with graft function, cardiovascular and infection-related deaths after graft failure have also declined significantly over time. Dialysis-related factors, such as withdrawal of dialysis due to psychosocial reasons, patient refusal of treatment, and cessation of therapy, were also important determinants of death after graft failure. It is surprising that “patient choice” has become an important contributor to death after transplant failure, but entirely consistent with studies that have shown that, from a patient’s perspective, many would prefer death over returning to dialysis.20
Understanding the incidence of death at specific times post-transplant may also enable power calculations and facilitate trial design. Mortality is an outcome that is critically important and relevant to both patients and clinicians, and should ideally be reported in all trials in kidney transplantation.21 A systematic review of kidney transplant trials showed that mortality is a frequently reported outcome; however, >85% of the trials reported overall mortality as an end point.21 Trial investigators have argued that overall mortality may be an inappropriate primary outcome because it is insensitive to a particular cause of death.22 Cause-specific mortality (e.g., cardiovascular death) may be a more appropriate end point for certain interventions or patient populations. Our study, which reports cause-specific deaths at clinically significant time periods post-transplant, will enable investigators to generate more realistic estimates of statistical power in the contemporary era and thereby improve trial design and feasibility determinations.
The trends we have identified in causes of death by time period post-transplant will enable clinicians to provide a more informed discussion of risks with patients, both in the pre- and post-transplant setting. The heightened risks of cardiovascular and infection-related deaths during the first 3 months post-transplant, and the progressive increases in the risk of cancer death with increasing time post-transplant, may enable clinicians to focus on cause-specific preventative strategies that differ by time post-transplant. Our study highlights the value of periodic analyses of registry data to examine contemporary trends. Emerging diseases such as coronavirus disease 2019, and drugs such as immune checkpoint inhibitors in cancer therapy, will likely further affect our understanding of cause-specific death in the future.
The comprehensive capture of all kidney transplant recipients from 1980 to 2018 and the long duration of follow-up are key strengths of our study. Previous studies have also shown a high correlation of the date of death as recorded by ANZDATA, compared with the National Death Index (NDI),23 suggesting excellent capture of death outcomes by ANZDATA. The limitations of a retrospective registry analyses should also be acknowledged. Comorbidity data were collected at the time of transplantation, thus may not reflect the full burden of disease acquired post-transplant. Post-transplant events such as acute rejection24 and new-onset diabetes post-transplant25 are known to affect subsequent risks of mortality but were not accounted for in this study. Furthermore, ANZDATA is reliant on the accuracy of clinician-reported data and thus should be interpreted with this context in mind. ANZDATA-reported causes of death were not linked to the NDI because both sources provide different descriptions of mortality and serve different purposes.26 Cause of death in the NDI is reported according to the International Classification of Diseases by a certifying doctor, who may not be involved in the patient’s long-term care. Causes of death specific to kidney disease such as withdrawal of dialysis would not be captured by the NDI. ANZDATA records cause of death according to a list of causes devised by the registry, and is reported by the patient’s renal unit; however, only a single cause of death is allowed. Therefore, a direct comparison of both databases is not possible. As a registry study, we were unable to explore the reasons behind the improvements in cardiovascular and cancer deaths in granular detail. Our results provide insights into mortality risk for recipients of a first kidney-only transplant in the Australasian context, and differences in practice, such as infrequent usage of T cell depletion for induction, and patient population, being dominantly White and Asian, may limit generalizability.
In conclusion, our study demonstrates ongoing improvements to short- and long-term survival in first kidney transplant recipients with a functioning graft in the contemporary era. We confirmed an ongoing reduction in cardiovascular death in the most recent era, and report a modest reduction in cancer death in the past decade. Despite ongoing concerns that our transplant recipients continue to have unmet clinical needs,27 this study adds to the emerging evidence that post-transplant outcomes continue to improve.
Disclosures
All authors have nothing to disclose.
Funding
None.
Supplementary Material
Acknowledgments
We are grateful to the nurses, physicians, surgeons, and database staff who contribute to the ANZDATA Registry, without whom, this work could not be done.
T. Ying conceived the study, designed the statistical analysis, acquired the data, interpreted the results, and drafted the manuscript; B. Shi acquired the data, designed and conducted the statistical analysis, interpreted the results, and drafted the manuscript; P. Kelly designed the statistical analysis, interpreted the results, and edited the manuscript; H. Pilmore and P. Clayton conceived the study, interpreted the results, and edited the manuscript; and S. Chadban conceived the study, designed the statistical analysis, acquired the data, interpreted the results, and edited the manuscript. All authors agree to be accountable to all aspects of the work and approved the final manuscript version.
Footnotes
Published online ahead of print. Publication date available at www.jasn.org.
Supplemental Material
This article contains the following supplemental material online at http://jasn.asnjournals.org/lookup/suppl/doi:10.1681/ASN.2020050566/-/DCSupplemental.
Supplemental Table 1. Causes of death categorisation.
Supplemental Table 2. Missing baseline data.
Supplemental Table 3. Adjusted hazard ratio (using 2015–2018 as the reference year) for all-cause death.
Supplemental Table 4. Adjusted hazard ratio (using 2015–2018 as the reference year) for cardiovascular death.
Supplemental Table 5. Adjusted hazard ratio (using 2015–2018 as the reference year) for cancer death.
Supplemental Table 6. Adjusted hazard ratio (using 2015–2018 as the reference year) for infection-related death.
Supplemental Table 7. Death after graft failure, adjusted death rates by time (<1 year or 1+years) post graft failure.
Supplemental Table 8. Causes of “other” deaths after first graft failure.
Supplemental Figure 1. Sensitivity analysis for death after transplantation. Adjusted all-cause death rate by time periods post-transplant (per 100 patient-years), censored at retransplant and date of last follow-up.
Supplemental Figure 2. Sensitivity analysis for death after transplantation. Adjusted cause-specific death rates by time periods post-transplant (per 100 patient-years), censored at retransplant and date of last follow-up.
References
- 1.Ojo AO, Hanson JA, Wolfe RA, Leichtman AB, Agodoa LY, Port FK: Long-term survival in renal transplant recipients with graft function. Kidney Int 57: 307–313, 2000. [DOI] [PubMed] [Google Scholar]
- 2.Australia and New Zealand Dialysis and Transplant Registry: Chapter 7: Transplantation. In: ANZDATA 41st Annual Report 2018 (Data to 2017), Adelaide, Australia, Australia and New Zealand Dialysis and Transplant Registry, 2018. Available at: https://www.anzdata.org.au/wp-content/uploads/2018/11/c07_transplant_2017_v1.0_20181220.pdf. Accessed August 25, 2020 [Google Scholar]
- 3.Briggs JD: Causes of death after renal transplantation. Nephrol Dial Transplant 16: 1545–1549, 2001. [DOI] [PubMed] [Google Scholar]
- 4.Marshall MR, Polkinghorne KR, Kerr PG, Agar JWM, Hawley CM, McDonald SP: Temporal changes in mortality risk by dialysis modality in the Australian and New Zealand dialysis population. Am J Kidney Dis 66: 489–498, 2015. [DOI] [PubMed] [Google Scholar]
- 5.Coemans M, Süsal C, Döhler B, Anglicheau D, Giral M, Bestard O, et al. : Analyses of the short- and long-term graft survival after kidney transplantation in Europe between 1986 and 2015. Kidney Int 94: 964–973, 2018. [DOI] [PubMed] [Google Scholar]
- 6.Annual Data Report. Scientific Registry of Transplant Recipients http://srtr.transplant.hrsa.gov/annual_reports/Default.aspx. Accessed August 28, 2020
- 7.Australia and New Zealand Organ Donation Registry: Section 4: Organ donor profile. In: ANZOD Annual Report 2019. Adelaide, Australia, Australia and New Zealand Dialysis and Transplant Registry; 2019. Available at: https://www.anzdata.org.au/report/anzod-annual-report-2019/. Accessed August 25, 2020 [Google Scholar]
- 8.Kalbfleisch JD, Prentice RL: Competing risks and multistate models The Statistical Analysis of Failure Time Data, Hoboken, NJ, John Wiley & Sons, 2002, pp 247–277 [Google Scholar]
- 9.Laird N, Olivier D: Covariance analysis of censored survival data using log-linear analysis techniques. J Am Stat Assoc 76: 231–240, 1981. 10.1080/01621459.1981.10477634 [Google Scholar]
- 10.Pilmore H, Dent H, Chang S, McDonald SP, Chadban SJ: Reduction in cardiovascular death after kidney transplantation. Transplantation 89: 851–857, 2010. [DOI] [PubMed] [Google Scholar]
- 11.Kinnunen S, Karhapää P, Juutilainen A, Finne P, Helanterä I: Secular trends in infection-related mortality after kidney transplantation. Clin J Am Soc Nephrol 13: 755–762, 2018. [DOI] [PMC free article] [PubMed] [Google Scholar]
- 12.Pippias M, Jager KJ, Kramer A, Leivestad T, Sánchez MB, Caskey FJ, et al. : The changing trends and outcomes in renal replacement therapy: Data from the ERA-EDTA registry. Nephrol Dial Transplant 31: 831–841, 2016. [DOI] [PubMed] [Google Scholar]
- 13.Chan S, Pascoe EM, Clayton PA, McDonald SP, Lim WH, Sypek MP, et al. : Infection-related mortality in recipients of a kidney transplant in Australia and New Zealand. Clin J Am Soc Nephrol 14: 1484–1492, 2019. [DOI] [PMC free article] [PubMed] [Google Scholar]
- 14.Au EH, Chapman JR, Craig JC, Lim WH, Teixeira-Pinto A, Ullah S, et al. : Overall and site-specific cancer mortality in patients on dialysis and after kidney transplant. J Am Soc Nephrol 30: 471–480, 2019. [DOI] [PMC free article] [PubMed] [Google Scholar]
- 15.Meier-Kriesche H-U, Schold JD, Kaplan B: Long-term renal allograft survival: Have we made significant progress or is it time to rethink our analytic and therapeutic strategies? Am J Transplant 4: 1289–1295, 2004. [DOI] [PubMed] [Google Scholar]
- 16.Lamb KE, Lodhi S, Meier-Kriesche HU: Long-term renal allograft survival in the United States: A critical reappraisal. Am J Transplant 11: 450–462, 2011. [DOI] [PubMed] [Google Scholar]
- 17.Laskin BL, Mitsnefes MM, Dahhou M, Zhang X, Foster BJ: The mortality risk with graft function has decreased among children receiving a first kidney transplant in the United States. Kidney Int 87: 575–583, 2015. [DOI] [PMC free article] [PubMed] [Google Scholar]
- 18.Francis A, Johnson DW, Melk A, Foster BJ, Blazek K, Craig JC, et al. : Survival after kidney transplantation during childhood and adolescence. Clin J Am Soc Nephrol 15: 392–400, 2020. [DOI] [PMC free article] [PubMed] [Google Scholar]
- 19.Kabani R, Quinn RR, Palmer S, Lewin AM, Yilmaz S, Tibbles LA, et al. ; Alberta Kidney Disease Network : Risk of death following kidney allograft failure: A systematic review and meta-analysis of cohort studies. Nephrol Dial Transplant 29: 1778–1786, 2014. [DOI] [PubMed] [Google Scholar]
- 20.Sautenet B, Tong A, Manera KE, Chapman JR, Warrens AN, Rosenbloom D, et al. : Developing consensus-based priority outcome domains for trials in kidney transplantation: A multinational delphi survey with patients, caregivers, and health professionals. Transplantation 101: 1875–1886, 2017. [DOI] [PMC free article] [PubMed] [Google Scholar]
- 21.Sautenet B, Tong A, Chapman JR, Warrens AN, Rosenbloom D, Wong G, et al. : Range and consistency of outcomes reported in randomized trials conducted in kidney transplant recipients: A systematic review. Transplantation 102: 2065–2071, 2018 [DOI] [PubMed] [Google Scholar]
- 22.Baigent C, Herrington WG, Coresh J, Landray MJ, Levin A, Perkovic V, et al. ; KDIGO Controversies Conference on Challenges in the Conduct of Clinical Trials in Nephrology Conference Participants : Challenges in conducting clinical trials in nephrology: Conclusions from a Kidney Disease-Improving Global Outcomes (KDIGO) Controversies Conference Kidney Int, Vol. 92, 2017, pp 297–305 [DOI] [PMC free article] [PubMed] [Google Scholar]
- 23.Sypek MP, Dansie KB, Clayton P, Webster AC, Mcdonald S: Comparison of cause of death between Australian and New Zealand dialysis and transplant registry and the Australian national death index. Nephrology (Carlton) 24: 322–329, 2019. [DOI] [PubMed] [Google Scholar]
- 24.Clayton PA, McDonald SP, Russ GR, Chadban SJ: Long-term outcomes after acute rejection in kidney transplant recipients: An ANZDATA analysis. J Am Soc Nephrol 30: 1697–1707, 2019. [DOI] [PMC free article] [PubMed] [Google Scholar]
- 25.Cole EH, Johnston O, Rose CL, Gill JS: Impact of acute rejection and new-onset diabetes on long-term transplant graft and patient survival. Clin J Am Soc Nephrol 3: 814–821, 2008. [DOI] [PMC free article] [PubMed] [Google Scholar]
- 26.Li SQ, Cass A, Cunningham J: Cause of death in patients with end-stage renal disease: Assessing concordance of death certificates with registry reports. Aust N Z J Public Health 27: 419–424, 2003. [DOI] [PubMed] [Google Scholar]
- 27.OʼConnell PJ, Kuypers DR, Mannon RB, Abecassis M, Chadban SJ, Gill JS, et al. : Clinical trials for immunosuppression in transplantation: The case for reform and change in direction Transplantation, Vol. 101, 2017, pp 1527–1534 [DOI] [PubMed] [Google Scholar]
Associated Data
This section collects any data citations, data availability statements, or supplementary materials included in this article.


