Abstract
This paper reports on our efforts to collect daily COVID-19-related symptoms for a large public university population, as well as study relationship between reported symptoms and individual movements. We developed a set of tools to collect and integrate individual-level data. COVID-19-related symptoms are collected using a self-reporting tool initially implemented in Qualtrics survey system and consequently moved to .NET framework. Individual movement data are collected using off-the-shelf tracking apps available for iPhone and Android phones. Data integration and analysis are done in PostgreSQL, Python, and R. As of September 2020, we collected about 184,000 daily symptom responses for 20,000 individuals, as well as over 15,000 days of GPS movement data for 175 individuals. The analysis of the data indicates that headache is the most frequently reported symptom, present almost always when any other symptoms are reported as indicated by derived association rules. It is followed by cough, sore throat, and aches. The study participants traveled on average 223.61 km every week with a large standard deviation of 254.53 and visited on average 5.77 ± 4.75 locations each week for at least 10 min. However, there is no evidence that reported symptoms or prior COVID-19 contact affects movements (p > 0.3 in most models). The evidence suggests that although some individuals limit their movements during pandemics, the overall study population do not change their movements as suggested by guidelines.
Keywords: COVID-19, Symptom reporting, GPS movement, Social distancing, Unsupervised learning, Association mining, Statistical analysis
Introduction
Non-compliance with recommendations of self-quarantine, social distancing, and mask-wearing, particularly among exposed/asymptomatic and other infected individuals, appears to be driving the increases in COVID-19 incidence being observed in many regions of the country [1–3]. While the true extent of compliance with social distancing guidelines remains unknown, observational data suggest that people continue to move freely while not wearing masks nor maintaining the minimum distance recommended [4]. Recent national studies highlight that mask-wearing is not fully adopted [5, 6]. Several US states experiencing serious outbreaks have poor compliance with social distancing guidelines and mask-wearing particularly among young adult populations [6]. Some states are reporting that people between 20 and 44 years of age now make up more than half of new cases [7–9]. Cases have been linked to specific bars, parties, or social events [10]. This situation is not unique to the USA but repeats across the globe.
In order to address social distancing, mask-wearing, and population monitoring, many institutions implement their own solutions ranging from complete telework to routine testing to symptom monitoring. The presented work is based on efforts by a large public university that implemented tools for daily monitoring of COVID-19 symptoms, as well as a research study that enrolled a cohort of participants to monitor their detailed movements during the pandemic and linked these movements to reported symptoms and contacts. Efforts at other universities are not much different from ours. As reported in the literature, significant efforts are made in order to move large portion of education online so that number of people on campus can be reduced [11, 12]. Summaries of selected measures taken by universities are reported in [13]. Virtually all universities operate dedicated websites for COVID-19 response as exemplified by (https://www.harvard.edu/coronavirus, https://www.ox.ac.uk/coronavirus, https://now.mit.edu/, https://www2.gmu.edu/Safe-Return-Campus).
Most research to understand the impacts of human movement on infectious disease transmission have focused on the macro-level [14, 15] and fall short of incorporating actual individual-level behavior and specific movement patterns with only a few individual-level studies available, i.e., [16–18]. More commonly, insect movement models are used to observe infectious disease transmission with attempts to extrapolate to human populations [19–21]. It is possible to address this gap using GPS tracking individual-level movement data, which has been previously done when studying movements of animals [22], and only in limited scope in human disease transmission [23, 24]. This is partially because GPS tracker data to study movement are extremely difficult to obtain by researchers. In fact, there is a common misconception that there are large amounts of COVID-19-related GPS movement data available for research. These data are collected and owned by private companies and available only in aggregated form [25, 26], preventing any individual-level studies. Several studies have been recently completed that use such aggregated GPS movement data [27–29], which demonstrated population-level impact of social distancing, but these are unable to analyze or link individual movements to symptoms, testing, or individual reasons for (non)compliance nor study individual reasons for (non)compliance. Many of these studies use SafeGraph data [25] that is freely available to those who wish to study COVID-19, social distancing, and policy implications yet has unclear quality. The data appears to be based on proprietary methodology used to process and aggregate data whose details are not available, thus making any obtained results questionable. In contrast, some studies aim at analyzing social distancing and movements without GPS. For example, Moore et al. [30] used survey data but not GPS to study how COVID-19 affected movements in children.
To address this issue, our team continues to collect and analyze individual-level data including exact GPS locations and daily reported symptoms for a selected cohort of participants. In the presented work, we describe results obtained when merging individual-level GPS data with daily symptom monitoring.
Data Collection
The initial data collection efforts started on March 22, 2020, as part of overall university response to quickly developing COVID-19 pandemic. On May 5, 2020, we started geolocation data collection for a selected cohort of participants who consented to the data collection in an IRB approved study.
Symptom Monitoring
Our group designed and implemented a screening tool and daily symptom journal based on the US Center of Disease Control and Prevention (CDC) symptom monitoring guidelines. The CDCs guidelines have been revised several times since we implemented the tool, and these changes are reflected in our work. Additional items have been added to the revised tool as summarized in Table 1. The numbers in the table indicate the total number of responses as well as the total number of individuals reporting symptoms.
Table 1.
Summary of symptom data collected by three survey instruments used since March 2020
| Initial screening tool (March–August) |
Daily symptom journal (March -) |
Health✓™ reporting tool (August–) |
||||
|---|---|---|---|---|---|---|
| Total | # Ind. | Total | # Ind. | Total | # Ind. | |
| Number of responses | 23,786 | 15,603 | 34,965 | 5867 | 125,186 | 17,662 |
| COVID-19 tested | ||||||
| Positive | 7 | 6 | 18 | 8 | 77 | 39 |
| Negative | 428 | 387 | 2301 | 612 | 9871 | 2703 |
| Awaiting results | 105 | 98 | 541 | 220 | 3510 | 1004 |
| Inconcl. | 0 | 0 | 46 | 21 | ||
| Contact | 169 | 148 | 181 | 67 | 252 | 101 |
| Cough | 1688 | 1571 | 771 | 471 | 221 | 109 |
| Difficulty breathing | 191 | 174 | 183 | 129 | 40 | 25 |
| Muscle or body aches | 490 | 294 | 125 | 71 | ||
| Sore thro. | 609 | 343 | 290 | 154 | ||
| Chills | 163 | 120 | 122 | 52 | ||
| Headache | 1063 | 643 | 256 | 131 | ||
| Fever | 316 | 294 | 63 | 50 | 125 | 53 |
| Diarrhea | 263 | 187 | 152 | 88 | ||
| Runny nose | 813 | 475 | 217 | 118 | ||
| Nausea or vomiting | 302 | 197 | 130 | 61 | ||
| Loss of taste/smell | 139 | 34 | 65 | 32 | ||
| Fatigue | 225 | 143 | 168 | 106 | ||
The numbers indicate numbers of RESPONSES as well as numbers of people
The initial implementation of the daily symptom journal has been done using Qualtrics survey system that allowed us for quick deployment of the tool in just a few days. The tool has been used by the general university population between March 22, 2020, and August 17, 2020, and for the research study of social distancing until October 2020. Starting August 18, 2020, a new Health✓™ tool implemented in .NET framework has been deployed to the university population (https://healthcheck.gmu.edu). The university is currently enforcing requirement for students, faculty, staff, and visitors to complete the screening tool every day before coming to campus which significantly increased number of responses.
Symptom data collection timeline is shown in Fig. 1 that shows daily numbers of respondents. The initial high number of responses to the screening tool (red line) corresponds to inclusion of the link to the tool in the university learning management system (LMS), and consequently a spike corresponds to an email sent to the university listserv. The tool has been disabled on August 18. Daily symptom journal (blue line) has been completed by a relatively constant number of individuals, with a slight increase in May 2020 when research study on social distancing started to recruit participants. Another increase of responses corresponds to the university population preparing for and returning to campus for Fall semester. Small number of respondents who continue to answer the daily journal are participants of the social distancing study. The required Health✓™ tool has high number of responses, with clear weekly cycle but also an overall declining trend. Significantly lower number of responses in the original Qualtrics survey as compared to the Health✓™ tool can be explained by the latter being required.
Fig. 1.
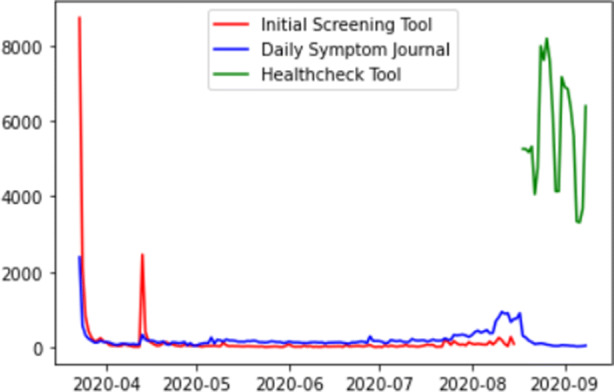
Daily numbers of responses collected by the three reporting tools
Until September 2020, we received 23,786 responses to the old COVID-19 screening tool for 15,603 people, 34,965 responses to the old daily journal for 5867 people, and 125,186 responses to the new screening tool for 17,662 people.
Movement Tracking
Individual movement data collection requires apps installed on individuals’ smartphones. There are a wide range of apps that can be used for this purpose, ranging from specialized ones developed for the purpose of tracking people during COVID-19 pandemic, to fitness trackers, to general purpose loggers. A summary of selected top-ranked apps is available in Table 2. A detailed survey of contact tracing apps is available in [31].
Table 2.
Selected top-ranked movement tracking apps available in Android and iOS app stores
| App | OS | Developer | COVID | COVID Symptoms | Fitness | General |
|---|---|---|---|---|---|---|
| Exposure Notification System (ENS) | iOS | Apple and Google | Yes | No | No | No |
| COVID Alert NY | iOS and Android | New York State Department of Health | Yes | Yes | No | No |
| COVIDWISE | iOS and Android | Virginia Department of Health | Yes | No | No | No |
| COVID Alert NJ | iOS and Android | New Jersey State Department of Health | Yes | Yes | No | No |
| Care19 Diary | iOS and Android | North Dakota Department of Health | Yes | No | No | No |
| CRUSH COVID RI | iOS and Android | Rhode Island Department of Health | Yes | Yes | No | No |
| HEALTHLYNKED COVID19 Tracker | iOS and Android | HealthLynked | Yes | Yes | No | No |
| Apple COVID-19 | iOS | Apple | Yes | Yes | No | No |
| COVID Symptom Study | iOS and Android | Zoe Global Limited | Yes | Yes | No | No |
| HowWeFeel | iOS | The How We Feel Project, Inc. | Yes | Yes | No | No |
| Coronavirus COVID Tracker | iOS | H Clinic | Yes | No | No | No |
| COVID-19! | iOS | Nemocnice Milosrdnych Bratri | Yes | No | No | No |
| HealthChampion | iOS and Android | HealthChampion | Yes | Yes | No | No |
| MyFitnessPal | iOS and Android | Under Armour | No | No | Yes | No |
| Pacer Pedometer & Step Tracker | iOS | Pacer Health, Inc. | No | No | Yes | No |
| Google Fit: Health and Activity Tracking | Android | No | No | Yes | No | |
| Fitbod Workout & Fitness Plans | iOS | Fitbod Inc. | No | No | Yes | No |
| myTracks* | iOS | Dirk Stichling | No | No | No | Yes |
| GPS Logger* | Android | Mendhak | No | No | No | Yes |
| Life360: Find Family & Friends | iOS and Android | Life360 | No | No | No | Yes |
| Map My Ride | iOS | Under Armour | No | No | No | Yes |
There are approximately over 400 similar apps in the app stores. The apps marked with a * are used in the presented research
The idea of using specialized tracking apps developed for COVID-19 pandemic was originally considered as an attractive option for our study, as they combine movement, symptom, and potentially Bluetooth data in one place. However, each of these apps is essentially a data black box without the possibility of accessing it by research teams. Many of the apps have also unacceptable privacy terms which precluded us from using them for our participant cohort. We decided to use two general-purpose commercially available GPS tracking apps which participants can download from app stores: myTracks on iOS devices and GPSLogger on Android devices. Both apps collect data locally and can be configured to send data only to the research team. We compared data from both apps by wearing iPhone and Android phones at the same time for about 3 months and concluded that data do not differ in a way that would affect further analysis.
The average distance traveled (Fig. 2) and the average number of visited locations (Fig. 3) are relatively constant during the reported period. The change in total distance and total number of visited locations over time is due to the changing number of participants in the study. The spike in total distance on July 31 is due to one participant’s travel. Increased movements in mid-late August correspond to preparations to the new academic year.
Fig. 2.
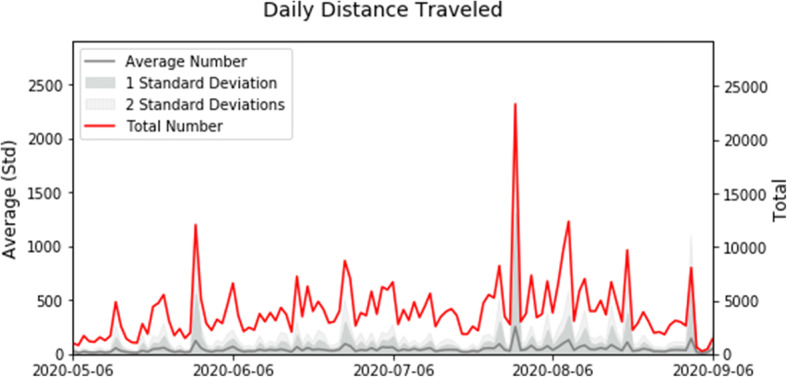
Daily total (red) and average per participant (gray) distance traveled in the recorded data
Fig. 3.
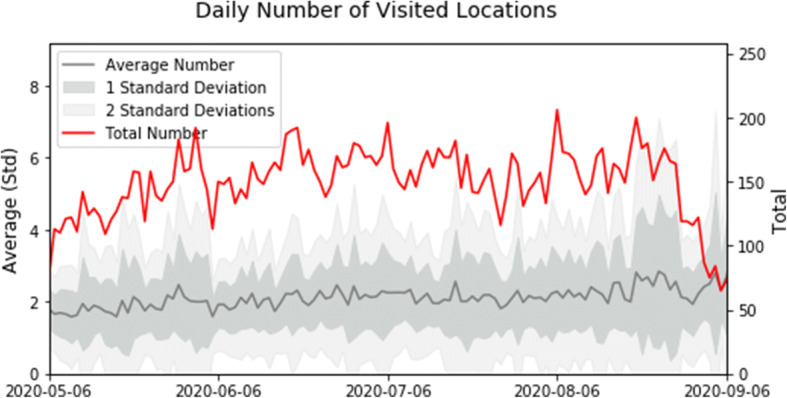
Daily total (red) and average per participant (gray) number of locations visited for at least 10 min in the recorded data
Data Integration
GPS coordinates data were retrieved from the study participants via automatically generated email (sent to dedicated account on our server) and later preprocessed using procmail and Python program, or automatically uploaded to Google Drive and retrieved by the study team. The two applications used in the study created data in different formats (csv and xml) with additional variations when some users enabled additional features not described in the guide provided to them. These were processed and normalized by a series of Python programs. The symptom data were extracted as csv files and securely copied to the project server. Data from daily symptom reports and GPS movements were integrated using a common identifier within a PostgreSQL database. The overall diagram of data flow in the project is shown in Fig. 4.
Fig. 4.
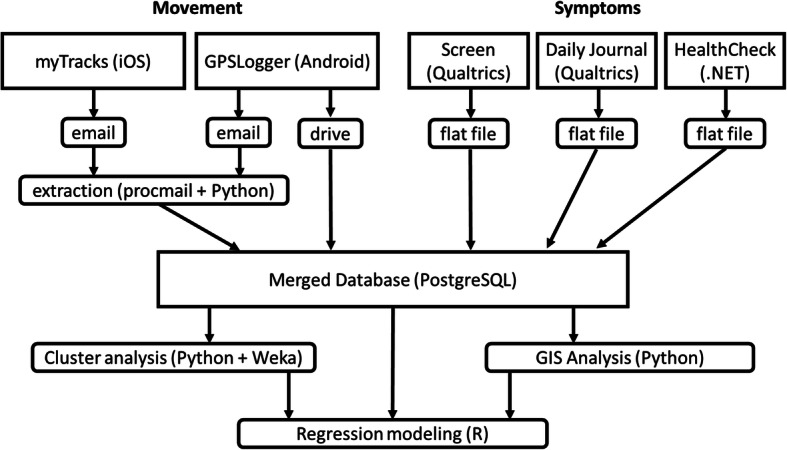
Overall architecture and data flow in the presented project
Symptom cluster analysis has been done in Python 3.7 and partially in Weka [32] in which Apriori algorithm was executed to find combinations of symptoms. GPS data processing and overall GIS analysis was done in PostgreSQL (PostGIS library) and Python (geopy library). Finally, preprocessed data have been moved to R for the statistical analysis.
Data Analysis
Symptom Clustering
To analyze reported symptoms, we first derived groups of symptoms reported together within one screening response as well as groups of symptoms reported by the same individuals regardless of time. This was done by a simple application of Apriori algorithm [33] on the survey-level and individual-level data. Two sets of results have been obtained: based on entire dataset and for surveys/individuals who reported at least one symptom. The number of individuals with at least one reported symptom at some point is 1382, and the number of surveys with at least one reported symptom is 2818. Most individuals report just one symptom. The leading symptom in both individual- and survey-level data is “headache” followed by “cough” and “throat” as summarized in Table 3 that shows top symptoms and their combinations.
Table 3.
Most frequent combinations of symptoms by response and by individual
| Symptom or combination | # Resp | % Resp | # Ind | % Ind |
|---|---|---|---|---|
| Headache | 1064 | 38 | 643 | 46 |
| Cough | 771 | 27 | 471 | 34 |
| Throat | 609 | 22 | 343 | 25 |
| Aches | 490 | 17 | 294 | 21 |
| Cough, headache | 221 | 7.9 | 187 | 13 |
| Aches, headache | 256 | 9 | 187 | 13 |
| Throat, headache | 194 | 6.9 | 182 | 13 |
| Cough, throat | 203 | 7.2 | 162 | 12 |
| Cough, throat, headache | 93 | 3.3 | 104 | 7.5 |
| Aches, throat, headache | 54 | 1.9 | 86 | 6.2 |
| Aches, cough, throat, headache | 47 | 1.7 | 58 | 4.2 |
| Aches, throat, headache, nausea | 32 | 1.1 | 43 | 3.1 |
| Aches, cough, throat, headache, nausea | 22 | 0.78 | 34 | 2.5 |
| Aches, cough, throat, chills, headache | 19 | 0.67 | 31 | 2.2 |
Results presented in Table 4 show that the Apriori algorithm found are all reliable rules (confidence = 1). This means that all individuals with left side symptoms always report the right side symptom(s). For most of the top generated rules, headache was the symptom that was reported together with other symptoms or their combinations. Lift is always greater than one and ranged from 2.15 to 37.3. This indicates that, for all these rules, the likelihood of occurrence of the symptoms at the right side increases by ((lift-1) *100) %, if the left side symptoms had happened. For instance, based on rule 4, if an individual has “difficulty breathing, aches, chills, headache, and nausea” symptoms already, it is 193% more likely for the individual to have “cough” as well [34].
Table 4.
Selected association rules generated from the symptom data
| Rule | # Ind | Confidence | Lift | Leverage | Conviction | |
|---|---|---|---|---|---|---|
| 1 | Cough throat nausea ==> headache | 42 | 1 | 2.15 | 0.02 | 22.46 |
| 2 | Cough aches throat nausea ==> headache | 34 | 1 | 2.15 | 0.01 | 18.18 |
| 3 | Throat chills headache pain ==> aches | 19 | 1 | 4.7 | 0.01 | 14.96 |
| 4 | Breath aches chills headache nausea ==> cough | 13 | 1 | 2.93 | 0.01 | 8.57 |
| 5 | Fever throat nausea ==> breath | 10 | 1 | 10.71 | 0.01 | 9.07 |
| 6 | Fever breath headache nausea ==> cough aches | 10 | 1 | 12.34 | 0.01 | 9.19 |
| 7 | Fever throat headache nausea ==> cough breath aches | 9 | 1 | 37.35 | 0.01 | 8.76 |
| 8 | Fever cough throat nausea ==> breath aches headache | 9 | 1 | 30.04 | 0.01 | 8.7 |
| 9 | Aches headache vomiting pain ==> nausea | 9 | 1 | 7.81 | 0.01 | 7.85 |
| 10 | Cough aches chills nausea pain ==> throat | 9 | 1 | 4.03 | 0 | 6.77 |
The reported numbers relate to the rule support (number of individuals) and selected rule quality metrics
The cluster analysis indicates that the largest group of individuals report no symptoms or small number of symptoms (Figs. 5 and 6). The second largest cluster includes people who reported headache and additional related symptoms. Finally, the smallest of the clusters includes people who reported multiple symptoms.
Fig. 5.
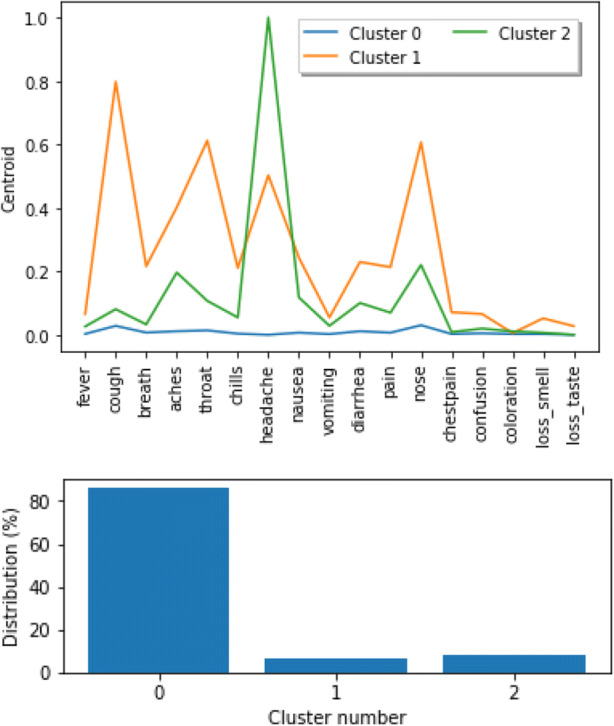
Clusters across entire dataset (all individuals) with frequency of symptoms (top) and cluster size (bottom)
Fig. 6.
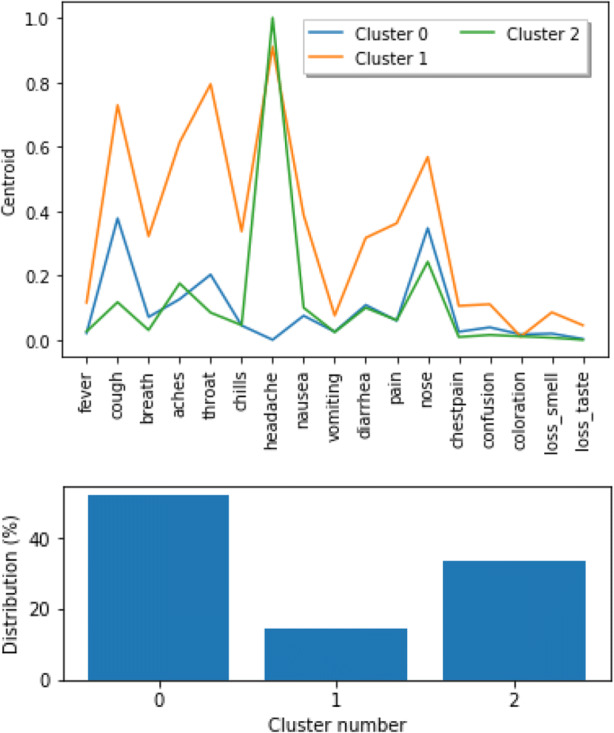
Clusters for individuals with at least one symptom with frequency of symptoms (top) and cluster size (bottom)
Finally, we looked at the group of 39 individuals who tested positive for COVID-19 in data since August 18. Their symptoms are summarized in Table 5. Symptoms “before test” indicate symptoms reported prior to the reported COVID-19 test result. Symptoms “with test” indicate symptoms reported on the same response as the positive test result. The majority of positive cases report cough, loss of smell/taste, sore throat, and headache, followed by runny nose and aches. There are also 13 individuals in the data who are asymptomatic, i.e., tested positive for COVID-19 but did not report any symptoms. These findings are consistent with some of the literature on COVID-19-related symptoms [36–39].
Table 5.
Summary of symptoms reported among COVID-19-positive individuals
| Symptom | Before test N = 23 | With test N = 39 |
|---|---|---|
| Cough | 10 | 24 |
| Difficulty breathing | 0 | 4 |
| Loss of smell or taste | 5 | 24 |
| Muscle or body aches | 21 | |
| Sore throat | 9 | 24 |
| Chills | 5 | 20 |
| Headache | 8 | 24 |
| Fever | 6 | 13 |
| Diarrhea | 3 | 13 |
| Runny nose | 9 | 22 |
| Nausea or vomiting | 9 | 12 |
Three clusters of individuals who tested positive for COVID-19 are shown in Fig. 7. The largest of the clusters include individuals who are asymptomatic and those with few symptoms, while the smallest cluster includes individuals with large number of symptoms present.
Fig. 7.
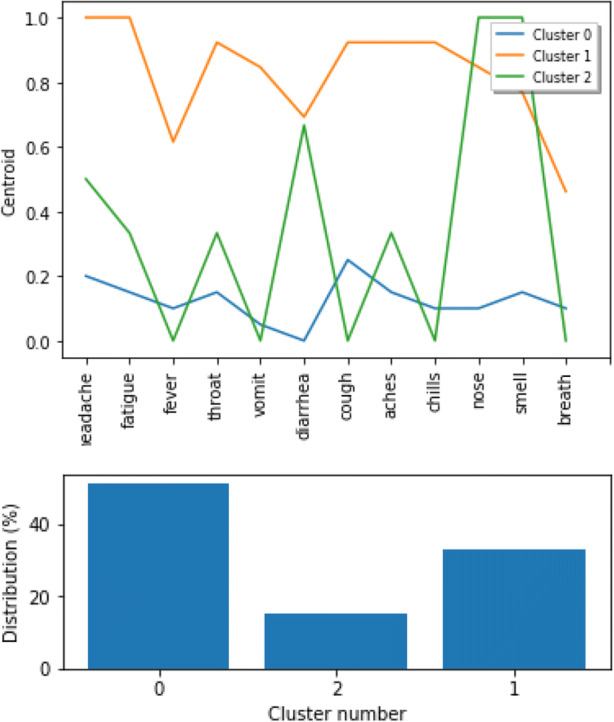
Clusters for individuals who tested positive for COVID-19 with frequency of symptoms (top) and cluster size (bottom)
Movement Analysis
Raw GPS data recorded by GPS trackers are imprecise due to GPS accuracy and sampling error. The data are also subject to noise that result from connection errors. For example, a number of datapoints recoded have coordinates (0,0) on the equator. There are a number of points that “jump” to random coordinates or have random timestamps. While the number of such outliers is small, their extreme values significantly affect results. These outliers have been removed using a simple approach that detects “jumps” between coordinates in three consecutive points with speed exceeding 200 km/h.
The extracted GPS data include the total 3.3 million distinct coordinates collected over 14.6 thousand person/days. On average, one individual in the study traveled 224 km every week and visited 6 locations outside home. These numbers, however, have a high standard deviation due to outliers who traveled more than typical study participants. The summary of GPS movement data is presented in Table 6.
Table 6.
Summary of GPS movement data for N = 162 individuals between May 6, 2020, and September 6, 2020
| GPS data | |||
|---|---|---|---|
| Total | Per individual | ||
| Mean | Std | ||
| Number of data points | 3,311,973 | 20,571 | 43,286 |
| Number of days | 14,633 | 90.89 | 35.35 |
| Weekly number of locations Visited | 1068.48 | 6.14 | 5.5 |
| Weekly distance traveled (km) | 86,021 | 223.61 | 253.53 |
Symptom-Movement Relation
In order to understand the movement pattern in relation to the reported symptoms, test result status, and whether individuals have been in close contact with a person with possible COVID-19 infection, we constructed a number of different linear models with (R1) the distance traveled (in km) next day and (R2) the decrease in distance traveled (difference between distance traveled (in km) next day and the day of symptom entry) as response. For these models, we dropped the missing values and only analyzed complete cases in the data, resulting in usable data for 95 individuals. Both the response variables, namely, the distance traveled next day and the difference in distance traveled, have skewed distributions. Therefore, the variables were transformed using a Box-Cox power transformation to make their distribution normal. To adjust for the dependence in data due to repeated observations from the same subject, we fitted a mixed linear model with a random effect due to the subject. All the other 21 covariates related to the journal entries were assumed to have a fixed linear effect on the response. Using all the covariates separately in the model yields unstable estimators due to extreme multicollinearity present in the covariates. To solve this issue, we used different lower dimensional versions of the fixed effect covariates and fitted the following models for both responses.
Factors Using Multiple Factor Analysis
To reduce the dimension of the covariate space, we performed a multiple factor analysis (can be interpreted as principal component analysis for categorical data) on the 21 covariates. In particular, this method identifies the important features in the covariate space by employing the dimension reduction technique and transforming the original variables (presence/absence of categorical variables) to a new set of variables (factors), which are uncorrelated and ordered so that the first few accounts for most of the variation in the data. We then fitted linear mixed models for both the responses with subject specific random effect and fixed linear effect(s) of the first two components. The contribution of each of the variables is shown in Fig. 8. The first factor is affected mostly by loss of smell and taste, and the prominent contributing variables in the second factor are chill, chest pain, and nausea.
Fig. 8.
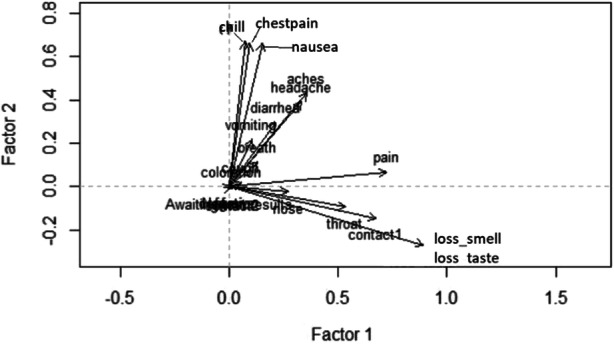
The contribution of the individual symptoms in the first two components of the factor analysis
Number of Symptoms
The explanatory variables can be divided in two categories. There are two variables assessing the test status of the participant (if they are awaiting a test result and if they had a negative test result) and two variables summarizing if they have been in close contact with anyone who either had COVID-19 or COVID-19 symptoms still without a definite test result. All the other 17 variables are different health symptoms related to COVID-19. We summed over all these 17 variables to obtain total number of symptoms reported every day. We then used this total number of symptoms instead of all the 17 categorical variables in our model (Model ST). In order to identify if a particular level of severity affects the mobility, we also used categorical versions of this total symptom variables, identifying if the person has reported at least k symptoms, for k = 1, 2, 3, and 4 (Model S1, S2, S3, and S4, respectively). All these models included the subject-specific random effects and fixed linear effects of the four variables related to test result status and possible contact as shown in Table 8 for (R1) and Table 9 for (R2).
Table 8.
Models for distance traveled (in km) next day using number of symptoms as covariates
| Variable | Awaiting test results | Negative test result | Symptoms | Contact with confirmed COVID patient | Contact with suspected COVID patient | |||||
|---|---|---|---|---|---|---|---|---|---|---|
| Model | β-hat | p | β-hat | p | β-hat | p | β-hat | p | β-hat | p |
| ST | − 0.058 | 0.75 | 0.199 | 0.52 | − 0.013 | 0.48 | − 0.047 | 0.89 | − 0.049 | 0.54 |
| S1 | − 0.062 | 0.73 | 0.199 | 0.52 | − 0.051 | 0.12 | − 0.022 | 0.94 | − 0.043 | 0.59 |
| S2 | − 0.056 | 0.76 | 0.199 | 0.52 | 0.000 | 0.99 | − 0.021 | 0.95 | − 0.052 | 0.51 |
| S3 | − 0.056 | 0.76 | 0.199 | 0.52 | 0.028 | 0.76 | − 0.044 | 0.89 | − 0.052 | 0.51 |
| S4 | − 0.056 | 0.76 | 0.199 | 0.52 | 0.004 | 0.97 | − 0.024 | 0.94 | − 0.052 | 0.51 |
Table 9.
Models for decrease in distance traveled (in km) next day using number of symptoms as covariates
| Variable | Awaiting test results | Negative test result | Symptoms | Contact with confirmed COVID case | Contact with suspected COVID case | |||||
|---|---|---|---|---|---|---|---|---|---|---|
| Model | β-hat | p | β-hat | p | β-hat | p | β-hat | p | β-hat | p |
| ST | 0.100 | 0.70 | 0.502 | 0.25 | 0.024 | 0.33 | 0.716 | 0.12 | − 0.073 | 0.51 |
| S1 | 0.103 | 0.69 | 0.502 | 0.25 | 0.049 | 0.29 | 0.807 | 0.07 | − 0.077 | 0.50 |
| S2 | 0.097 | 0.71 | 0.502 | 0.25 | 0.079 | 0.33 | 0.782 | 0.08 | − 0.072 | 0.52 |
| S3 | 0.097 | 0.71 | 0.502 | 0.25 | 0.098 | 0.44 | 0.766 | 0.09 | − 0.067 | 0.55 |
| S4 | 0.097 | 0.71 | 0.502 | 0.25 | − 0.097 | 0.59 | 0.932 | 0.05 | − 0.068 | 0.55 |
The results indicate that there is no evidence that people change their movement pattern when experiencing symptoms consistent with COVID-19. The factor analysis indicates that the loss in smell and taste affects the first component and second component is influenced by symptoms such as chill, chest pain, and nausea. But the models (Table 7) do not indicate any association of these components with the change in distance traveled. The models based on the number of symptoms also do not indicate any association of mobility pattern with physical symptoms. The actual distance traveled next day after the reported symptom (Table 8) is not significantly affected by any reported symptom, test result status, or contact with confirmed or suspected COVID patients. However, if we consider the change in distance traveled next day of the symptom entry as compared to the previous day (Table 9), the contact with a confirmed COVID case is marginally statistically significant, with p value ranging from 0.05 to 0.12 for the five different models under consideration. Besides this mild association of the contact with confirmed COVID-19 cases, none of the models indicate any significant effect of the physical symptoms and the possibility of being able to spread the infection on the change in the distance traveled, which is indicative of not following self-quarantine recommendations.
Table 7.
Models for mobility pattern based on the factors as covariates
| Response | Factor 1 | Factor 2 | ||
|---|---|---|---|---|
| Estimate | p value | Estimate | p value | |
| Distance traveled next day | − 0.002 | 0.688 | − 0.008 | 0.237 |
| Decrease in distance traveled next day | − 0.002 | 0.693 | − 0.003 | 0.606 |
Conclusion
At the time of writing this paper, COVID-19 pandemic continues to evolve. Despite tremendous amount of work across the globe, it is unclear if a vaccine will be available to the public or if other measures will be used country-wide and internationally. It is our belief that there will be a need to monitor symptoms, contacts, and movements of people for some time in order to slow spread of the disease.
The presented work illustrated a small portion of efforts by a large public university to monitor and prevent spread of COVID-19 among its students, faculty, staff, and visitors. We focused here only on portion symptom monitoring efforts and research that aims at understanding movement of individuals in relation to their reported symptoms and contacts.
There are a number of interesting observations in the obtained results. Headache is by far the most frequently reported symptom, always reported by individuals who report any symptom. Individuals’ movement patterns are very diverse but clearly related to imposed movement restrictions. Some stay at home and leave only when they have to, while others tend to freely move without any limitations. However, the most important result indicates that there is no evidence that reported symptoms affect movement. This means that people who report symptoms consistent with COVID-19 do not self-quarantine but continue move as before. There are significant implications of these observations, particularly on providing right information and educating individuals. Further, the university currently requires every individual to self-report symptoms daily. Those who report any symptoms are not allowed on campus.
The presented results are a combination of data collected as part of university efforts to control COVID-19 spread and a research project that aims at studying social distancing. In this work, we were unable to link movements to the actual COVID-19 cases, because of very few cases within the university population (N = 39) and none in the movement study cohort. Such linking would employ supervised learning to construct models for predicting risk of infection based on symptoms and movements. Instead, we focused on describing the population and linking overall symptoms to movements as a simple way of studying social distancing. We collected a unique longitudinal dataset of movements linked to symptoms for about 170 individuals who participated in the study. Such data allows for a detailed individual-level analysis, in contrast to large number of aggregate studies recently published.
The presented work has several limitations. First, the university cohort may not be generalizable to general population. To address this concern, we plan to compare aggregated movements patterns to large-scale aggregated data from general population, SafeGraph. Further, at the time of writing this manuscript, very few COVID-19 positive cases were reported in the university population. A surge of COVID-19 positive cases is expected in late November and December 2020. If this is the case, we will be able to create models that link symptoms with COVID-19 diagnosis.
Beyond work to address limitations, our current efforts focus on a more detailed analysis of the results. We are linking the GPS data to landscape information extracted from OpenStreetMap [35]. We are also reconstructing detailed movement trajectories of individuals in between GPS locations and constructing models to predict movements. In addition, we are reconstructing sequences of reported symptoms for COVID-19 positive cases. We are extending the cohort of participants that will be followed until spring 2021, which will allow for higher power analysis and longer follow-up period. Finally, we will be conducting surveys and semi-structured interviews to understand reasons for compliance and non-compliance with social distancing.
Acknowledgments
The authors thank Mason’s Information Technology Services team that implemented Health✓™ tool available to the university community. The authors give special thanks to participants of social distancing study without whom the presented research would not be possible.
Authors’ Contributions
JW is the main author of the manuscript and designer of the study. PB performed statistical analysis and wrote sections on statistical analysis. SD cleaned data and wrote parts of background and data sections. HM constructed models with diagnoses and wrote corresponding section. RM performed GPS data modeling and write corresponding sections. AR provided epidemiologic background and wrote introduction.
Data Availability
The data used in this study are not publicly available because identifiable participant information is included.
Compliance with Ethical Standards
Conflicts of Interest
The authors declare that they have no conflict of interest.
Ethics Approval
The project has been approved by the George Mason University Institutional Review Board (IRB) #1596465 and #1583244.
Consent for Publication
Not applicable.
Code Availability
All source code is available upon request from the corresponding author.
Footnotes
Publisher’s Note
Springer Nature remains neutral with regard to jurisdictional claims in published maps and institutional affiliations.
Contributor Information
Janusz Wojtusiak, Email: jwojtusi@gmu.edu.
Pramita Bagchi, Email: pbagchi@gmu.edu.
Sri Surya Krishna Rama Taraka Naren Durbha, Email: sdurbha@gmu.edu.
Hedyeh Mobahi, Email: hmobahi2@gmu.edu.
Reyhaneh Mogharab Nia, Email: rmoghara@gmu.edu.
Amira Roess, Email: aroess@gmu.edu.
References
- 1.Moore RC, Lee A, Hancock JT, Halley M, Linos E (2020) Experience with social distancing early in the COVID-19 pandemic in the United States: implications for public health messaging. medRxiv
- 2.Nivette A, Ribeaud D, Murray AL, Steinhoff A, Bechtiger L, Hepp U, … & Eisner M (2020) Non-compliance with COVID-19-related public health measures among young adults: insights from a longitudinal cohort study [DOI] [PMC free article] [PubMed]
- 3.Pedersen MJ, Favero N (2020) Social distancing during the COVID-19 pandemic: who are the present and future non-compliers? Public Administration Review [DOI] [PMC free article] [PubMed]
- 4.Haischer MH, Beilfuss R, Hart MR, Opielinski L, Wrucke D, Zirgaitis G, …, Hunter SK (2020) Who is wearing a mask? Gender-, age-, and location-related differences during the COVID-19 pandemic. medRxiv [DOI] [PMC free article] [PubMed]
- 5.Ballew MT, Bergquist P, Goldberg M, Gustafson A, Kotcher J, Marlon JR, Roess A et al. (2020) American public responses to COVID-19 -- April 2020, in PsyArXiv
- 6.Ballew MT, Bergquist P, Goldberg M, Gustafson A, Kotcher J, Marlon JR, Roess A et al. (2020) Americans’ risk perceptions and emotional responses to COVID-19, April 2020, in PsyArXiv
- 7.Arizona Department of Health Services: https://www.azdhs.gov/preparedness/epidemiology-disease-control/infectious-disease-epidemiology/covid-19/dashboards/index.php, accessed July 4, 2020
- 8.California Department of Public Health: https://www.cdph.ca.gov/Programs/CID/DCDC/Pages/COVID-19/COVID-19-Cases-by-Age-Group.aspx accessed 7/8/20
- 9.Virginia Department of Health, https://www.vdh.virginia.gov/coronavirus/covid-19-daily-dashboard/
- 10.Detroit News, https://www.detroitnews.com/story/news/local/michigan/2020/06/27/east-lansing-bar-linked-85-positive-cases-coronavirus/3272687001/, June 27, 2020
- 11.Crawford J, Butler-Henderson K, Rudolph J, Malkawi B, Glowatz M, Burton R, Magni P, Lam S. COVID-19: 20 countries’ higher education intra-period digital pedagogy responses. J Appl Learn Teach. 2020;3(1):1–20. [Google Scholar]
- 12.O'Keefe L, Rafferty J, Gunder A, Vignare K (2020) Delivering high-quality instruction online in response to COVID-19: faculty playbook. Online Learning Consortium
- 13.Cheng SY, Wang CJ, Shen ACT, Chang SC. How to safely reopen colleges and universities during COVID-19: experiences from Taiwan. Ann Intern Med. 2020;173:638–641. doi: 10.7326/M20-2927. [DOI] [PMC free article] [PubMed] [Google Scholar]
- 14.Stoddard ST, Morrison AC, Vazquez-Prokopec GM, Soldan VP, Kochel TJ, Kitron U, et al. The role of human movement in the transmission of vector-borne pathogens. PLoS Negl Trop Dis. 2009;3(7):e481. doi: 10.1371/journal.pntd.0000481. [DOI] [PMC free article] [PubMed] [Google Scholar]
- 15.Wen TH, Lin MH, Fang CT. Population movement and vector-borne disease transmission: differentiating spatial–temporal diffusion patterns of commuting and noncommuting dengue cases. Ann Assoc Am Geogr. 2012;102(5):1026–1037. doi: 10.1080/00045608.2012.671130. [DOI] [Google Scholar]
- 16.Hast M, Searle KM, Chaponda M, Lupiya J, Lubinda J, Sikalima J, et al. The use of GPS data loggers to describe the impact of spatio-temporal movement patterns on malaria control in a high-transmission area of northern Zambia. Int J Health Geogr. 2019;18(1):19. doi: 10.1186/s12942-019-0183-y. [DOI] [PMC free article] [PubMed] [Google Scholar]
- 17.Vazquez-Prokopec GM, Bisanzio D, Stoddard ST, Paz-Soldan V, Morrison AC, Elder JP, Ramirez-Paredes J, Halsey ES, Kochel TJ, Scott TW, Kitron U. Using GPS technology to quantify human mobility, dynamic contacts and infectious disease dynamics in a resource-poor urban environment. PLoS One. 2013;8(4):e58802. doi: 10.1371/journal.pone.0058802. [DOI] [PMC free article] [PubMed] [Google Scholar]
- 18.Wesolowski A, Buckee CO, Engø-Monsen K, Metcalf C. Connecting mobility to infectious diseases: the promise and limits of mobile phone data. J Infect Dis. 2016;214(suppl_4):S414–S420. doi: 10.1093/infdis/jiw273. [DOI] [PMC free article] [PubMed] [Google Scholar]
- 19.Modlmeier AP, Colman E, Hanks EM, Bringenberg R, Bansal S, Hughes DP. Ant colonies maintain social homeostasis in the face of decreased density. eLife. 2019;8:e38473. doi: 10.7554/eLife.38473. [DOI] [PMC free article] [PubMed] [Google Scholar]
- 20.Quevillon LE, Hanks EM, Bansal S, Hughes DP. Social, spatial, and temporal organization in a complex insect society. Sci Rep. 2015;5:13393. doi: 10.1038/srep13393. [DOI] [PMC free article] [PubMed] [Google Scholar]
- 21.Sah P, Mann J, Bansal S. Disease implications of animal social network structure: a synthesis across social systems. J Anim Ecol. 2018;87(3):546–558. doi: 10.1111/1365-2656.12786. [DOI] [PubMed] [Google Scholar]
- 22.Meunier NV, Sebulime P, White RG, Kock R. Wildlife-livestock interactions and risk areas for cross-species spread of bovine tuberculosis. Onderstepoort J Vet Res. 2017;84(1):e1–e10. doi: 10.4102/ojvr.v84i1.1221. [DOI] [PMC free article] [PubMed] [Google Scholar]
- 23.Qi F, Du F. Tracking and visualization of space-time activities for a micro-scale flu transmission study. Int J Health Geogr. 2013;12(1):1–16. doi: 10.1186/1476-072X-12-6. [DOI] [PMC free article] [PubMed] [Google Scholar]
- 24.Vazquez-Prokopec GM, Stoddard ST, Paz-Soldan V, Morrison AC, Elder JP, Kochel TJ, Scott TW, Kitron U. Usefulness of commercially available GPS data-loggers for tracking human movement and exposure to dengue virus. Int J Health Geogr. 2009;8(1):68. doi: 10.1186/1476-072X-8-68. [DOI] [PMC free article] [PubMed] [Google Scholar]
- 25.SafeGraph COVID-19 Data Consortium, https://www.safegraph.com/covid-19-data-consortium, accessed August 30, 2020
- 26.UNACAST COVID-19 website: https://www.unacast.com/covid19/social-distancing-scoreboard, accessed August 30, 2020
- 27.Bourassa K, Sbarra D, Caspi A, Moffitt T (2020) Social distancing as a health behavior: county-level movement in the United States during the COVID-19 pandemic is associated with conventional health behaviors [DOI] [PMC free article] [PubMed]
- 28.Dasgupta N, Funk MJ, Lazard A, White BE, Marshall SW (2020) Quantifying the social distancing privilege gap: a longitudinal study of smartphone movement. medRxiv
- 29.Gao S, Rao J, Kang Y, Liang Y, Kruse J. Mapping county-level mobility pattern changes in the United States in response to COVID-19. SIGSPATIAL Spec. 2020;12(1):16–26. doi: 10.1145/3404820.3404824. [DOI] [Google Scholar]
- 30.Moore SA, Faulkner G, Rhodes RE, Brussoni M, Chulak-Bozzer T, Ferguson LJ, Mitra R, et al. Impact of the COVID-19 virus outbreak on movement and play behaviours of Canadian children and youth: a national survey. Int J Behav Nutr Phys Act. 2020;17(1):1–11. doi: 10.1186/s12966-020-00987-8. [DOI] [PMC free article] [PubMed] [Google Scholar]
- 31.Ahmed N, Michelin RA, Xue W, Ruj S, Malaney R, Kanhere SS, Seneviratne A, Hu W, Janicke H, Jha SK. A survey of covid-19 contact tracing apps. IEEE Access. 2020;8:134577–134601. doi: 10.1109/ACCESS.2020.3010226. [DOI] [Google Scholar]
- 32.WEKA, The Workbench for Machine Learning website: https://www.cs.waikato.ac.nz/ml/weka/
- 33.Agrawal R, Srikant R (1994) "Fast algorithms for mining association rules. In Proc. 20th int. conf. very large data bases. VLDB, vol. 1215, pp 487–499
- 34.Witten I, Frank E, Hall M, Pal C (2017) Data mining: practical machine learning tools and techniques. Elsevier Inc.
- 35.OpenStreetMap Wiki: https://wiki.openstreetmap.org/wiki/Main_Page
- 36.Rocha-Filho S, Augusto P, Voss L. Persistent headache and persistent anosmia associated with COVID-19. Headache: J Head Face Pain. 2020;60(8):1797–1799. doi: 10.1111/head.13941. [DOI] [PMC free article] [PubMed] [Google Scholar]
- 37.Magdy R, Hussein M, Ragaie C, Abdel-Hamid HM, Khallaf A, Rizk HI, Dahshan A. Characteristics of headache attributed to COVID-19 infection and predictors of its frequency and intensity: a cross sectional study. Cephalalgia. 2020;40(13):1422–1431. doi: 10.1177/0333102420965140. [DOI] [PMC free article] [PubMed] [Google Scholar]
- 38.Carfì A, Bernabei R, Landi F. Persistent symptoms in patients after acute COVID-19. Jama. 2020;324(6):603–605. doi: 10.1001/jama.2020.12603. [DOI] [PMC free article] [PubMed] [Google Scholar]
- 39.Menni C, Valdes AM, Freidin MB, Sudre CH, Nguyen LH, Drew DA, Ganesh S et al (2020) Real-time tracking of self-reported symptoms to predict potential COVID-19. Nat Med:1–4 [DOI] [PMC free article] [PubMed]
Associated Data
This section collects any data citations, data availability statements, or supplementary materials included in this article.
Data Availability Statement
The data used in this study are not publicly available because identifiable participant information is included.


