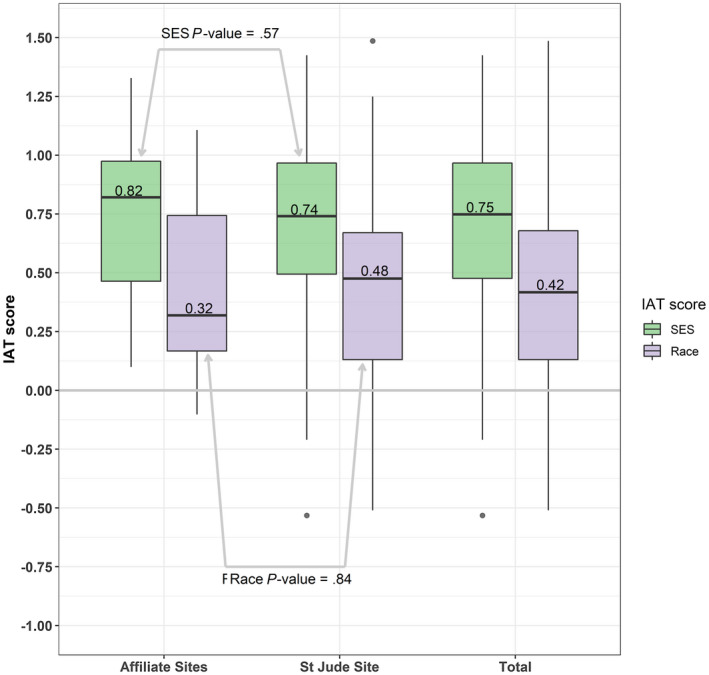
Figure 1.

Box and whisker plots of implicit association test (IAT) score distributions by site. The zero point indicates no preference in either direction. The median is represented by dark horizontal bars. For both race and socioeconomic status (SES), the median values did not differ between providers at St. Jude Children's Research Hospital (P = .57) and the affiliate clinics (P = .84).
