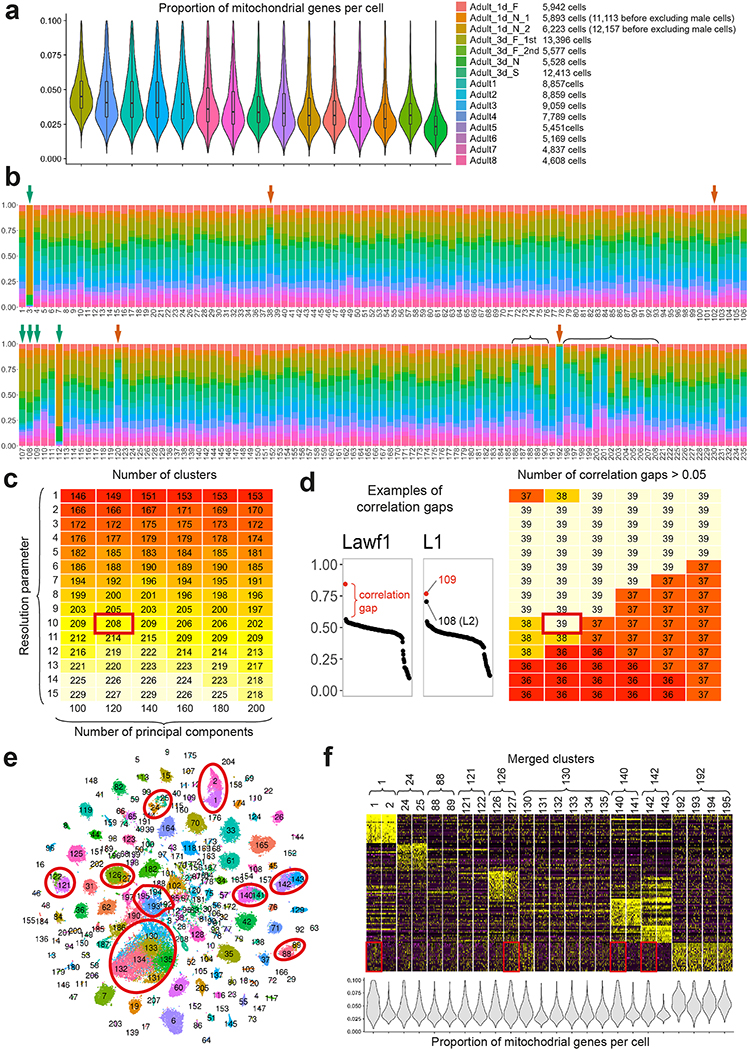
Extended Data Figure 1: Batch effect removal and biological significance of the adult clusters.
a. The proportions of UMIs from mitochondrial genes per cell (n = number of cells in each library, indicated on the right) and the total number of cells passing filters in each of the 15 libraries comprising the adult dataset. Names indicated correspond to the names in the Seurat object provided (Adult.rds, GSE142787). Boxplots display the first, second and third quartiles. Whiskers extend from the box to the highest or lowest values in the 1.5 inter-quartile range, and outlying datapoints are represented by a dot. b, Origin of the cells in the final adult clusters, colored as in (a). Green arrows: clusters whose unique library distribution can be explained by variable contamination from surrounding tissues (cluster 3 is photoreceptors, 112 is likely Kenyon Cells from the central brain) or the number of lamina neuropils dissociated (clusters 107, 108, 109 are lamina neurons). Red arrows: clusters likely enriched in low quality transcriptomes, as they are enriched in cells from libraries with high number of mitochondrial genes (38, 120, 192) or high number of cells sequenced (102, likely corresponding to multiplets). Brackets: Glial clusters, some of them enriched in libraries with high number of mitochondrial genes as ambient RNA is more similar to RNA from glial vs. neuronal cells (Extended Data Fig.2). c, Number of clusters obtained with different pairs of clustering parameters. Red rectangle: pair of parameters used. d, Left: Legend as in Fig.1C. Right: Number of isolated neuronal type transcriptomes matching to 1–5 of our adult clusters, for each pair of parameters in (c), which we used as a measure of the biological relevance of our clusters. Matching was defined by the presence of a correlation gap above 0.05 (Methods). We took into account any correlation gap between the 6 best correlated clusters, since similar cell types or overclustering can affect the size of the first correlation gap as illustrated on the left graphs. Red rectangle: pair of parameters used. e, tSNE visualization of the adult optic lobe single-cell transcriptomes, using 120 principal components calculated on the log-normalized integrated gene expression. Cell colors indicate the cluster they belonged to before we merged artificially split clusters (red circles, Methods). f, Heatmap showing scaled log-normalized non-integrated expression of the top20 cluster markers between the merged clusters. Merged clusters had almost indistinguishable gene expression patterns, but often differed by their proportions of UMI from mitochondrial genes per cell or the expression levels of the genes highlighted in red, which are enriched in the “ambient RNA cluster” 192 (see also Extended Data Fig.3).

