Abstract
A major challenge for protein databases is reconciling information from diverse sources. This is especially difficult when some information consists of secondary, human-interpreted rather than primary data. For example, the Swiss-Prot database contains curated annotations of subcellular location that are based on predictions from protein sequence, statements in scientific articles, and published experimental evidence. The Human Protein Atlas (HPA) consists of millions of high-resolution microscopic images that show protein spatial distribution on a cellular and subcellular level. These images are manually annotated with protein subcellular locations by trained experts. The image annotations in HPA can capture the variation of subcellular location across different cell lines, tissues, or tissue states. Systematic investigation of the consistency between HPA and Swiss-Prot assignments of subcellular location, which is important for understanding and utilizing protein location data from the two databases, has not been described previously. In this paper, we quantitatively evaluate the consistency of subcellular location annotations between HPA and Swiss-Prot at multiple levels, as well as variation of protein locations across cell lines and tissues. Our results show that annotations of these two databases differ significantly in many cases, leading to proposed procedures for deriving and integrating the protein subcellular location data. We also find that proteins having highly variable locations are more likely to be biomarkers of diseases, providing support for incorporating analysis of subcellular location in protein biomarker identification and screening.
Keywords: Annotation consistency, Human protein atlas, Location biomarker, Protein subcellular location, Swiss-Prot database
1. Introduction
As knowledge of subcellular localization of proteins can provide important hints for understanding protein function, it has been used in many large-scale studies for screening location biomarkers1,2, predicting protein-protein interactions3–5, annotating protein metabolic stability6, or identifying drug targets7. However, the subcellular location patterns of proteins are in fact complex and varied across different human tissues, cell types, and cellular conditions, and there are multiple sources of subcellular location information that may be conflicting.
Currently, widely-used sources of subcellular location annotations include Swiss-Prot8, the Human Protein Atlas (HPA, https://proteinatlas.org/) database9,10, and trained subcellular location predictors such as Cell-PLoc11, WoLFPSORT12, CELLO2GO13, and MultiLoc14. Meanwhile, the predictors are trained using data from databases, so their accuracy reflects that of the databases.
Swiss-Prot is a high-quality annotated protein sequence database, in which over half of human proteins have subcellular location annotation that include sources of evidence8. The annotations supported by experimental evidence are considered to be those of the highest quality, and have been used in many studies about location pattern analysis from protein amino acid sequences15–18.
In parallel, the use of microscope images for subcellular location and translocation analysis has grown rapidly in the last two decades19,20. As one of the most popular bioimage databases, HPA has millions of high-resolution immunofluorescence (IF) images of proteins in various cell lines and immunohistochemistry (IHC) images of proteins in various tissues. The images with their annotations have been used for automatically analyzing protein subcellular locations through image processing and machine learning algorithms in many studies1,2,21–23, especially in recent years when deep learning has been successfully used in image classification tasks24–26. To ensure annotation accuracy, the HPA project has made great efforts. For example, all the images of tissues are manually annotated by an expert followed by verification by a second expert, and each protein is given a reliability score to indicate the consistency between the protein expression pattern and available reference data. However, due to the difficulty of the visual recognition task and the extensive variation of the patterns of some proteins, the annotations may contain errors. In one previous study27, a number of proteins were identified as strong candidates for reexamination by comparison of automated image analysis with HPA annotations. When these proteins were reexamined by the original annotators, the annotations of a significant fraction were changed. The latest version of HPA (version 19, released in 2019), compared with previous versions, updated the subcellular location categories and reliability scores for a number of proteins.
In a related study, Salvatore et al.28 calculated the agreement of protein localization annotations between datasets derived from the Swiss-Prot, HPA cell lines, and mass spectrometry-based studies, concluding that all of these annotation sources have some limitations in accuracy. However, the comparison was only performed on small datasets of human proteins covering 9 subcellular locations. As HPA covers manually annotated subcellular localization of proteins in various cellular situations while Swiss-Prot consolidates information from multiple sources, a comprehensive and quantitative cross-database analysis of the current annotations is needed.
In this work, we estimated the consistency of subcellular location annotations within HPA and between HPA and Swiss-Prot at multiple levels (Figure 1), and provide a resource for users to check the consistency of the annotations of their proteins of interest. The aim is to assess current annotations of subcellular locations and provide useful clues for users to analyze spatial distribution of proteins. Our results showed that the location annotations in HPA with the two highest reliability levels have the highest consistency with Swiss-Prot, but overall there is a significant inconsistency between the two sources. In addition, our results indicated that the proteins that have highly-varied subcellular locations across different cell lines and tissues are more likely to be related to diseases.
Figure 1.
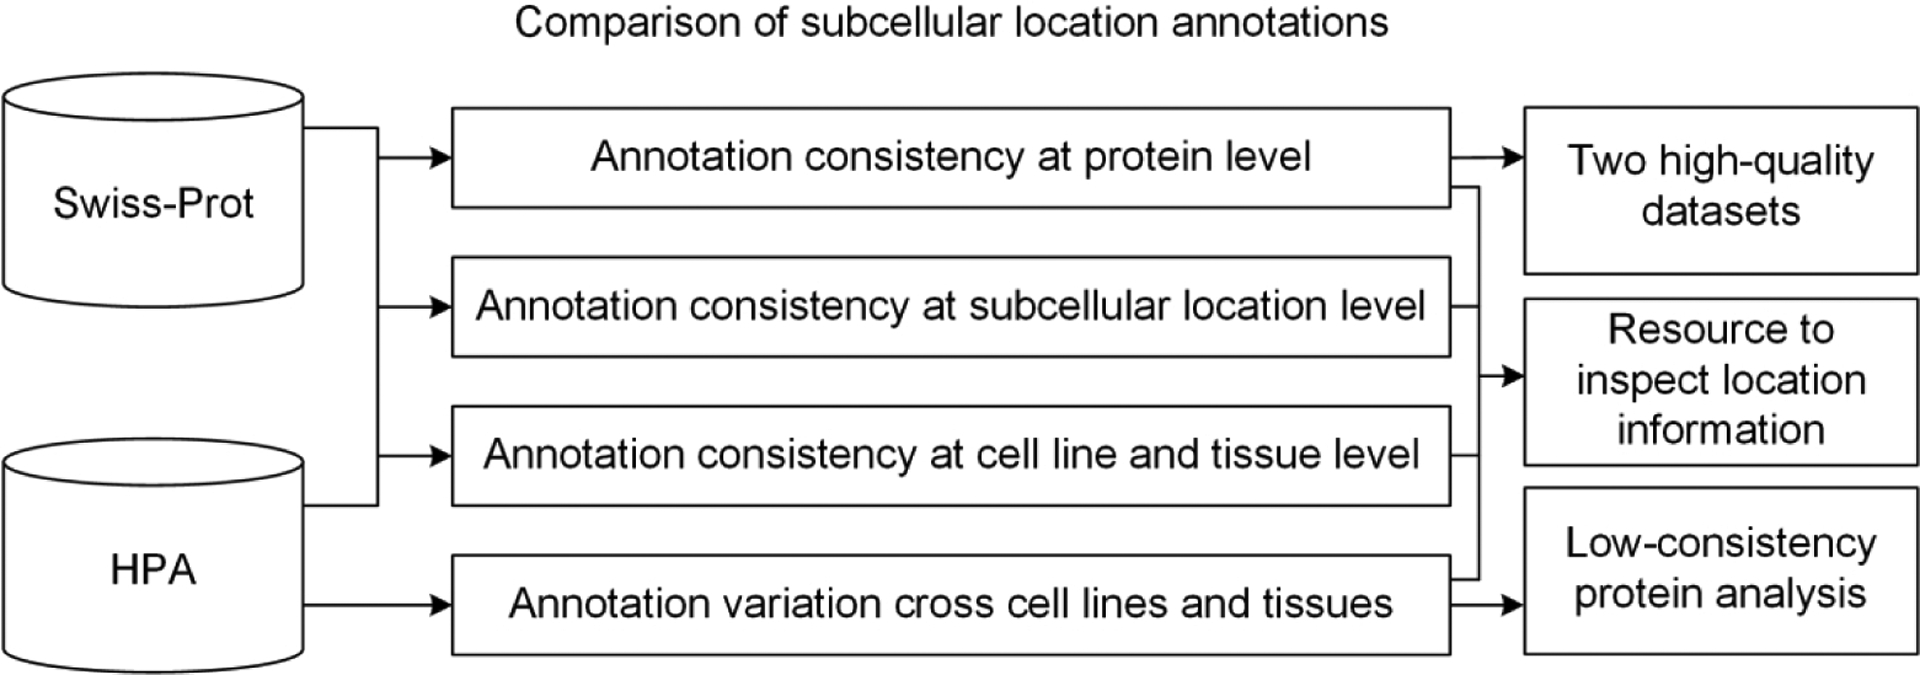
The framework of this paper.
2. Experimental Methods
Subcellular location annotations in the HPA
We began by downloading assigned overall subcellular locations of all proteins in HPA version 19 (Table S-1, S-2), as well as annotations for immunofluorescently stained cell lines (Table S-3) and immunohistochemistry stained tissues (Table S-4).
The HPA annotators assign each protein in a given cell line or tissue one location pattern, and then an overall assignment is manually created by consolidation of the annotations for the protein in all the cell lines or tissues. Each of the overall assignments of protein subcellular location was manually given a score that indicates the level of reliability of the analyzed protein expression pattern based on available RNA-seq/protein/gene characterization data from HPA and literatures. The reliability score has four levels, i.e., enhanced, supported, approved, and uncertain. Enhanced is assigned to proteins for which one or more antibodies undergo enhanced antibody validation29 and fulfill a set of criteria like pattern similarity with sibling antibodies, and have no contradiction with available literature. Supported annotations are those having consistency with RNA-seq and/or protein/gene characterization data but for which no antibodies pass enhanced antibody validation. Approved level is assigned to the annotations that have partial consistency with available RNA-seq/protein/gene characterization data. Lastly, uncertain indicates that the antibody-staining pattern contradicts experimental data or that no expression is detected on the RNA level.
In this work, we downloaded 15200 entries from IF staining with individual antibodies for multiple cell lines and 22288 entries from IHC staining of individual antibodies in multiple tissues (Table S-3, S-4). As for overall assignments, we also downloaded 12390 protein entries with consensus annotations and scores from IF, and 15313 protein entries with consensus annotations and scores from IHC (Table S-1, S-2). The differences between the numbers are due to the fact that more than one antibody was occasionally used for the same protein.
Subcellular location annotations in Swiss-Prot
In addition, we extracted subcellular locations for each protein from the Swiss-Prot database (version 2019_07, Table S-1 and S-2). Most of the subcellular location annotations in Swiss-Prot are associated with one or several types of evidence, such as published experimental evidence, statements in scientific articles, propagation from related experimentally characterized proteins, and information from another database. Each evidence type is represented by a code from the Evidence Codes Ontology (ECO), where ECO:269, ECO:244, and ECO:213 are associated with experimental evidence. ECO:269 means that the annotation has published experimental evidence, while ECO:244 and ECO:213 mean that the annotation is inferred from a combination of experimental and computational evidence in manual and automatic assertions, respectively. In this work, we measured consistency of HPA annotations with all annotations in Swiss-Prot, and with only those with experimentally supported annotations, which account for about 24% of the proteins in Swiss-Prot. It is noted that the databases from which Swiss-Prot imported subcellular location information do not include the HPA, so a comparison between the two resources is not complicated by influence of one on the other.
Annotation preprocessing
The two databases do not use the same set of subcellular location entries, so conversion to a common set was necessary before comparison. In the HPA, the annotations for IF images consist of 32 finely divided subcellular locations under thirteen broader categories (Table S-5), while for IHC images consist of summary text related to 3 main subcellular locations10. In contrast, Swiss-Prot has 97 subcellular locations in different structured hierarchy levels (Table S-6).
For the IF annotations, we compared the subcellular location sets of HPA and Swiss-Prot, and defined a common set composed of 22 subcellular locations: cytoskeleton, cytosol, cell junctions, centrosome, cleavage furrow, ER, endosomes, focal adhesion sites, Golgi apparatus, lipid droplets, lysosomes, midbody, midbody ring, mitochondria, mitotic spindle, nuclear membrane, nuclear speckles, nucleoli, nucleoplasm, peroxisomes, plasma membrane, and vesicles. Among them, 21 subcellular locations exist in both the HPA and the Swiss-Prot database, and the 22nd, cytoskeleton, was included because it is an important subcellular location in Swiss-Prot while HPA has all of the cytoskeletal components, including actin filaments, intermediate filaments, microtubules and their subunits in a single cytoskeleton category. All of the other subcellular locations in HPA and in Swiss-Prot except “secreted” were mapped to the common set, where the mapping relationship was based on the spatial distribution of cellular organelles and the hierarchical architecture of subcellular locations in the HPA and Swiss-Prot (https://proteinatlas.org/humanproteome/cell, Tables S-5, S-6)30. For example, nuclear envelope was mapped to nuclear membrane, vacuole was mapped to vesicles, and chromosome was mapped to nucleoplasm. While Swiss-Prot includes “secreted” as an annotation, there is no equivalent location annotation in HPA. We therefore ignored proteins annotated as “secreted” in our comparisons, which constitute 8.74% of the proteins in our total datasets.
For the IHC annotations, since HPA only provides a summary sentence for each protein describing the most prominent pattern of protein expression, we retrieved subcellular location information from the summary by keyword searching, and derived 3 main subcellular locations (cytoplasm, nucleus, and membrane) which then composed a common set. All the subcellular locations in Swiss-Prot except “secreted” were mapped to the common set (Tables S-6).
To provide a multi-sided and comprehensive result, we measured annotation consistencies separately at different HPA reliability levels and different evidence types in Swiss-Prot.
Comparison criteria
In order to calculate the consistency from multiple perspectives, we identified four comparison criteria, Overlap fraction (CO), Equality fraction (CE), Jaccard similarity (CJ), and Set-inclusion fraction (CS). Note that one annotation entry may contain more than one subcellular location because some proteins can be found in two or more locations in the same cell. We define the total number of proteins being compared as N, and the two subcellular location sets of the i-th protein from the HPA and Swiss-Prot as and , respectively. Then the four consistency scores are defined as:
| (1) |
| (2) |
| (3) |
| (4) |
where .
Overlap fraction counts the proteins for which and have at least one overlapping subcellular location, while Equality fraction only counts those proteins whose and are exactly the same. The Jaccard similarity scores the similarity between and , and the Set-inclusion fraction simply measures whether one set of annotations includes the other.
3. Results and Discussion
Annotation consistency with Swiss-Prot
After excluding the proteins that have no annotations, we used the remaining proteins and their overall annotations (Table S-1, S-2) to calculate the consistency between the two databases by the four defined criteria. In addition, to build a baseline for evaluating the consistency, we randomly assigned subcellular locations to all the proteins to examine the consistency level expected at random. The random assignment was according to the occurrence frequency of the 22 subcellular locations for IF images and the 3 subcellular locations for IHC images, as well as the number of subcellular locations annotated for each protein. We repeated the random assignment 20 times and used averaged criteria as the final baseline.
Figure 2 shows the comparison results for randomly assigned annotations, all annotations, and annotations at different reliability score levels, as well as the numbers of proteins used in each single comparison. Two observations follow.
Figure 2.
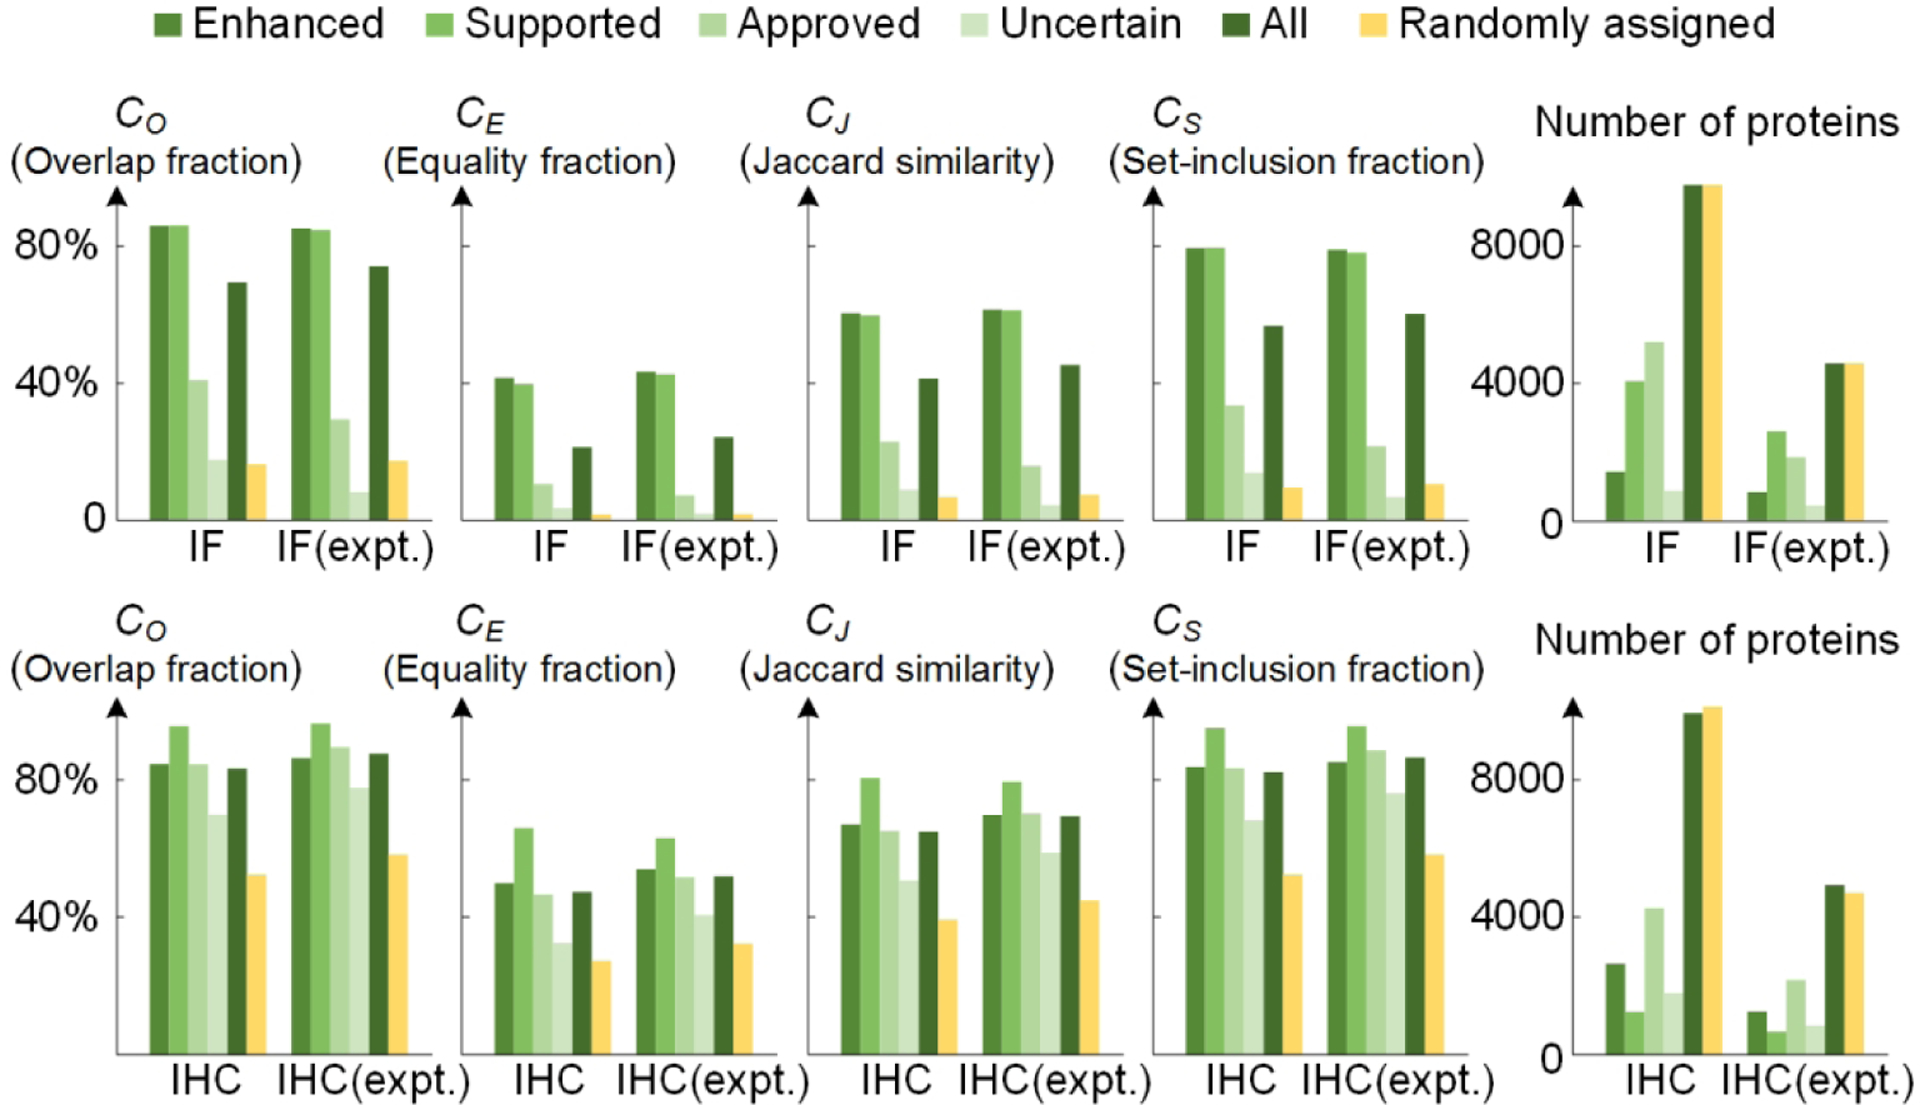
Consistency of subcellular location annotations between the HPA (version 19) and UniProtKB/Swiss-Prot databases (version 2019_07) at protein level. The expt. means the comparisons with only the experimentally evidenced annotations in Swiss-Prot.
First, the annotation consistencies between HPA and Swiss-Prot are quite low. In the comparisons of IF annotations (the first row of Figure 2), the ratios of proteins having exactly consistent annotations (CE) are less than half in almost all the cases. In contrast, CO and CS are observed to be much higher, indicating that the two databases have many overlaps and inclusions. Swiss-Prot collects diverse experimental results and focuses on the location(s) where a protein carries out its function, while HPA provides information on steady-state spatial distribution, which includes locations a protein may traverse en route to its final destination. This difference in the definition of subcellular location between HPA and Swiss-Prot may be one reason for observed inconsistency. Subcellular locations in Swiss-Prot are curated from multiple sources (not including HPA), and each protein is annotated with about 2.17 subcellular locations on average, while the number for HPA is 1.68 according to the current annotation version. It is observed that the consistencies for IHC are higher than for IF. The consistency values are highly affected by the definition of common set and mapping relationship, so the difference is reasonable when considering that the common set of IF has 22 subcellular locations while that of IHC only contains 3 broader subcellular locations.
Second, it is interesting that the annotations of the supported level have somewhat higher consistency with Swiss-Prot. The consistency values are basically the same as those of the enhanced level in IF comparisons, and even exceed the enhanced level in all the comparisons of IHC annotations. As the influence factors of reliability scores in the HPA include experimental evidence for location described in literature, the consistency with Swiss-Prot is inherent in these reliability levels. However, there are many cases where the consistencies with enhanced level are lower than those with supported level. The reason can be that the enhanced level emphasizes the antibody validation while the supported level requires consistency with reported literatures, which is more similar with the annotation method in Swiss-Prot.
The cross-database annotation statistics are expected to provide important clues for future studies. Proteins with high consistency values can compose a high-quality dataset that could be used for studies that integrate protein sequences and images. To construct such a dataset, we selected the proteins that have exactly consistent subcellular location annotations under the restriction that annotations have supported or enhanced reliability score. Two high-quality datasets were constructed: an IF dataset composed of 2154 proteins and an IHC dataset composed of 2057 proteins (These are marked in Table S-1 and S-2). Approximately 15% of proteins in the datasets are multi-location proteins, which is about 20% fewer than the proportion in the full set. This is presumably because it is more difficult to accurately annotate the proteins having multiple locations than single-location proteins.
Annotation consistency at the subcellular location level
The consistency varies significantly with different subcellular locations, as shown in Figure 3. For each subcellular location in the two common sets, the total numbers of related proteins in HPA and Swiss-Prot are shown. Confusion matrices, where each row represents the fraction of proteins that are assigned to a given location in HPA that are assigned to each location in Swiss-Prot, are displayed as heat maps (high values along the diagonal indicate good agreement). Peroxisomes and endosomes show particularly high consistency, and nucleoplasm, cytosol, plasma membrane, mitochondria and endoplasmic reticulum showing reasonable consistency as well. On the other hand, significant fractions of the proteins assigned to nuclear components other than nucleoplasm by HPA are assigned to nucleoplasm or nucleus by Swiss-Prot. This makes sense given the significant differences among these patterns when assesses visually by HPA annotators compared to the biochemical or functional descriptions on which many Swiss-Prot annotations are based.
Figure 3.
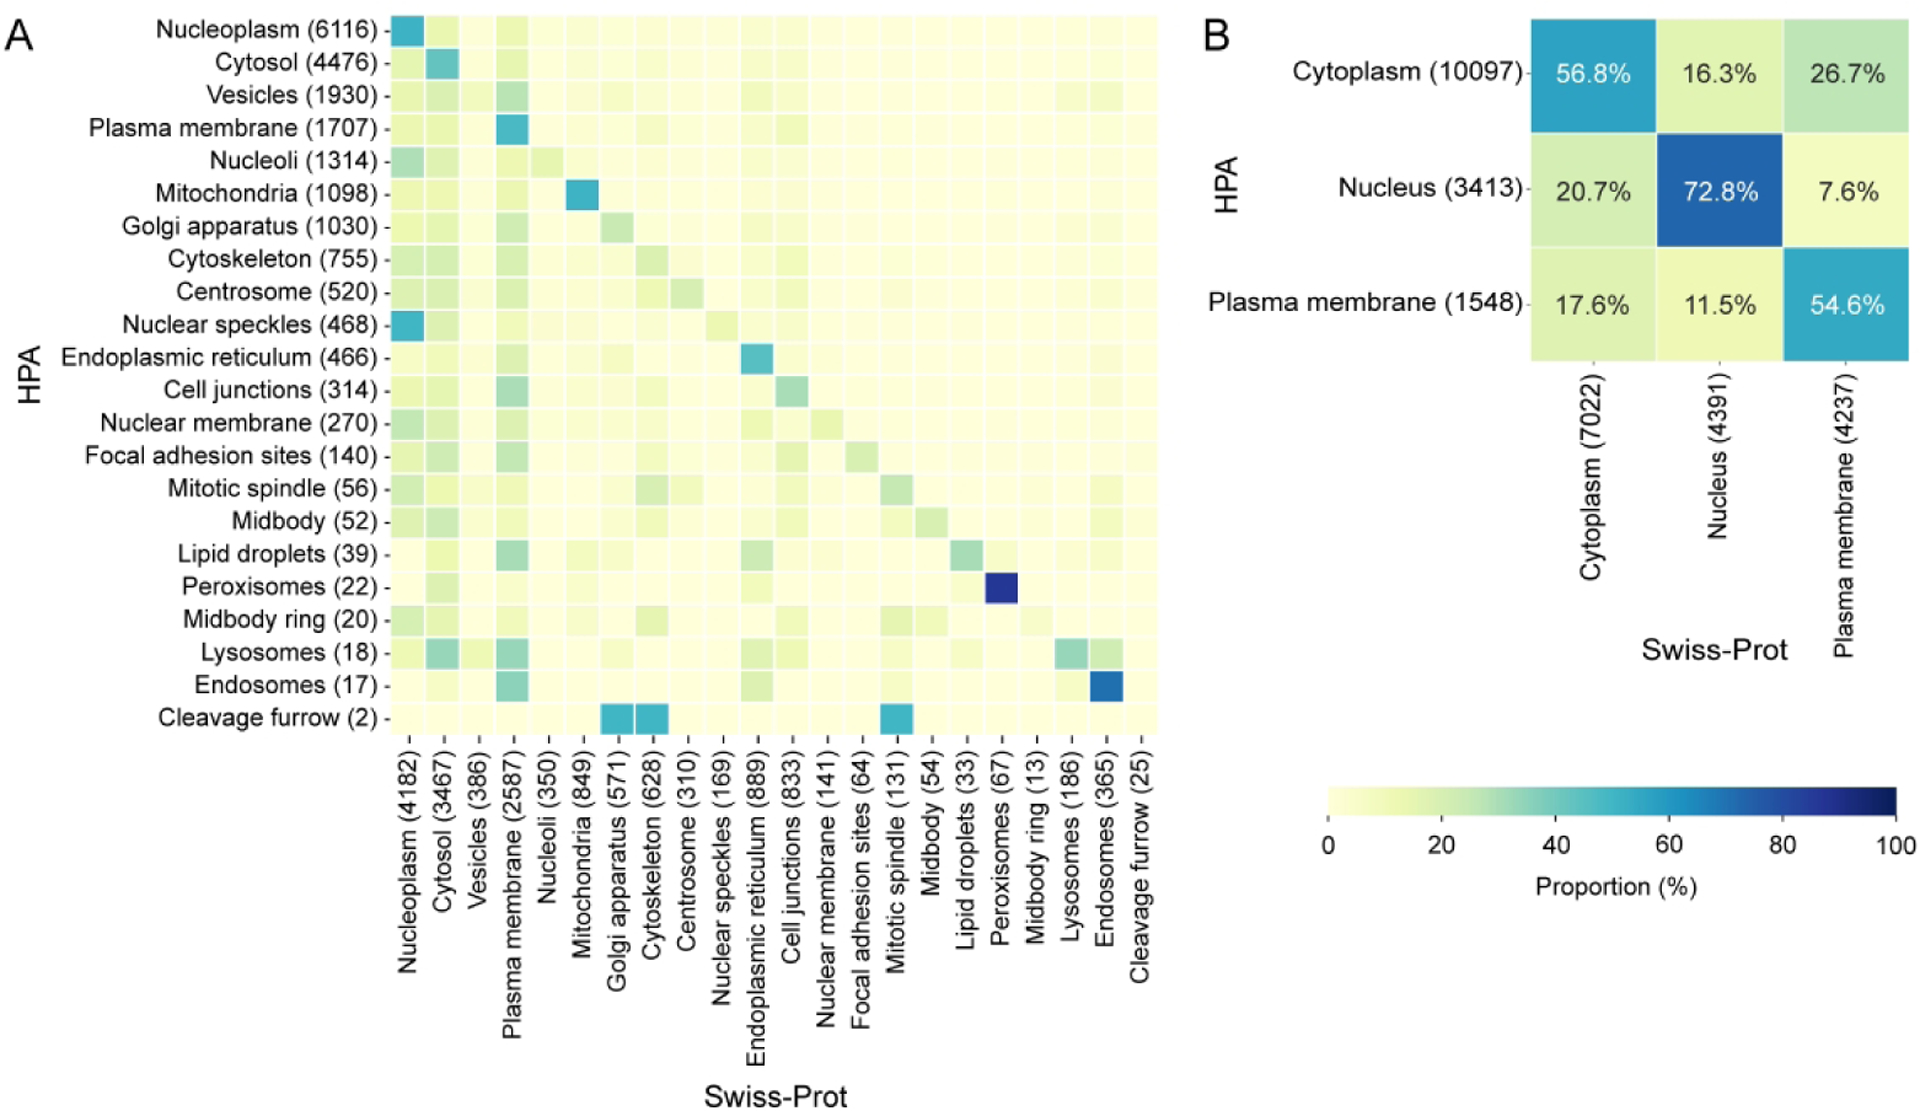
Confusion matrices between HPA and Swiss-Prot on different subcellular locations. (A) The 22 subcellular locations are in the common set of IF annotations, and (B) the 3 subcellular locations are in the common set of IHC annotations. The color represents the proportion of proteins in each category in HPA that are assigned to different subcellular locations in Swiss-Prot.
The vesicle category, the third most abundant subcellular location in the HPA, only has 8.5% support by Swiss-Prot annotations. The inconsistency is mainly caused by the use of this very general term by HPA annotations rather than assignment to specific organelles, given the gap in terms of the numbers of proteins assigned to vesicles between the two databases. Likewise, centrosome as a microtubule organizing center are mostly divided into the category of cytoskeleton in Swiss-Prot. It is noted that users of the two databases should be aware of these subcellular locations annotated in different scales and avoid confusion. The proteins annotated as cleavage furrow and midbody ring have none and only one protein support in Swiss-Prot, respectively. Both of the two subcellular locations are under the microtubules category in the HPA and have few proteins in both HPA and Swiss-Prot database.
Annotation consistency at the cell line and tissue level
We next asked whether consistency in annotations varied for different cell lines or tissues. We therefore calculated consistencies for each of the 30 human cell lines used in the HPA (Table S-3). The first row of Figure 4 shows the consistencies and numbers of proteins in six cell lines (three are the most commonly used and three are female-derived cell lines), while the complete results can be seen in Figure S-1. U-2 OS, A-431, and U-251 MG are the most commonly used cell lines in the HPA. They have over five times more analyzed proteins than other cell lines. The annotation consistencies of the three cell lines are similar and above the average level. For example, the Overlap fraction CO of the three cell lines with Swiss-Prot are 63.81%, 68.50%, and 67.47%, respectively, while the average of the other 27 cell lines is 62.62%. This is due to the fact that a lot of housekeeping genes are analyzed in the standard three cell lines whereas more selectively expressed proteins are analyzed in other cell lines. Therefore, as a conclusion, the three cell lines are recommended as a preferred source in analysis of subcellular locations from IF images.
Figure 4.
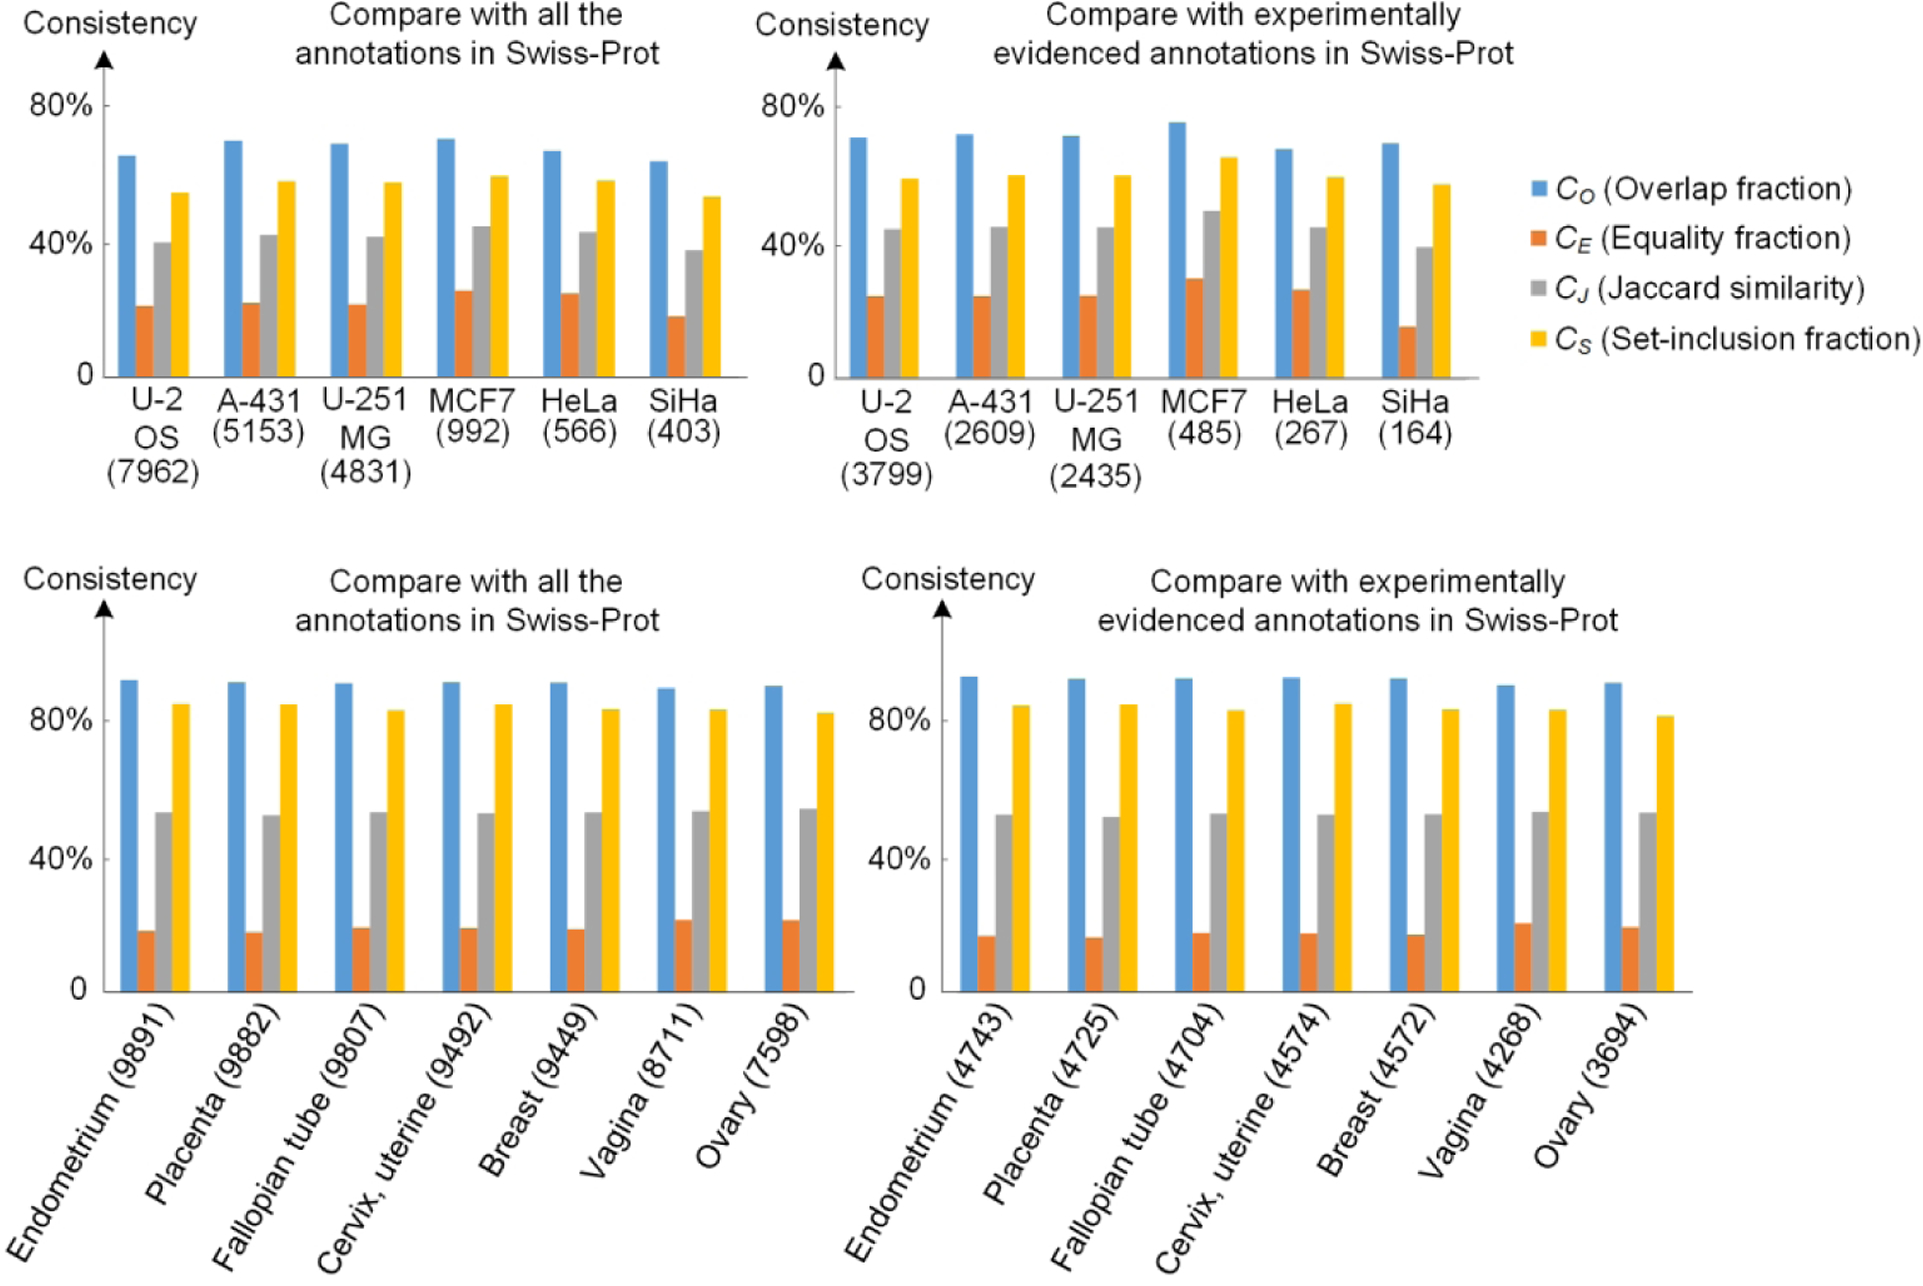
Consistency of subcellular location annotations of different cell lines and tissues between the HPA and Swiss-Prot database. The numbers below cell lines and after tissues are the numbers of proteins that were used in the single comparisons. Here we only show some representative examples of the cell lines and tissues in HPA, including the three most commonly used cell lines, three cell lines in female body, and seven female tissues.
We also investigated the annotation consistency with Swiss-Prot for each tissue to provide a comprehensive view of data quality at the tissue level (Table S-4). All the 57 human tissues in the HPA were used. Most of them have over 8000 proteins expressed and shown in IHC images, while 12 tissues newly introduced in the HPA version 19, such as hair, hypothalamus, and eye, only have dozens of proteins. Figure 4 shows seven female tissues as examples (Complete results are in Figure S-2). The consistencies are almost equal among different tissues as all the variances of the criteria are less than 5%. The results of comparing with all annotations and with only experimentally evidenced annotations have a slight difference of around 1%. It is concluded that there is no obvious difference of annotation consistency with Swiss-Prot for different tissues.
Annotation variation across cell lines and tissues
Some proteins may locate at different subcellular locations in different tissues or cell lines. To investigate the variation of protein distribution across cell lines and tissues, we calculated annotation consistency values for each protein. In the HPA, one protein usually has images for 3 cell lines and 45 tissues. So for every protein, we calculated the cell line consistency by averaging the consistencies of all pairs of the 3 cell lines, and calculated the tissue consistency by averaging the consistencies of all pairs of the tissues. The results are shown in Figure 5. Over half of the proteins have consistency values of 1, presumably because they have essential and location-dependent functions. The fact that the comparison for one protein is conducted across only two or three cell lines (proteins that were imaged in only one cell line are excluded in the statistic) presumably contributes to the high rate of invariant annotations. In contrast, the results across tissues have a higher statistical variation. Three criteria CE, CJ, and CS obey approximate Gaussian distributions, and CO shows an upward trend from low to high consistency values. This illustrates that although protein subcellular locations across different tissues have lots of overlap, the variation still cannot be neglected. This variation may result from some proteins having various and complex distribution pattern in different tissues, or the variation may come from inaccuracies in the manual annotation process. As shown in Figure 6, we also demonstrated that proteins that have high consistency across cell lines or tissues also have high annotation consistency with Swiss-Prot.
Figure 5.
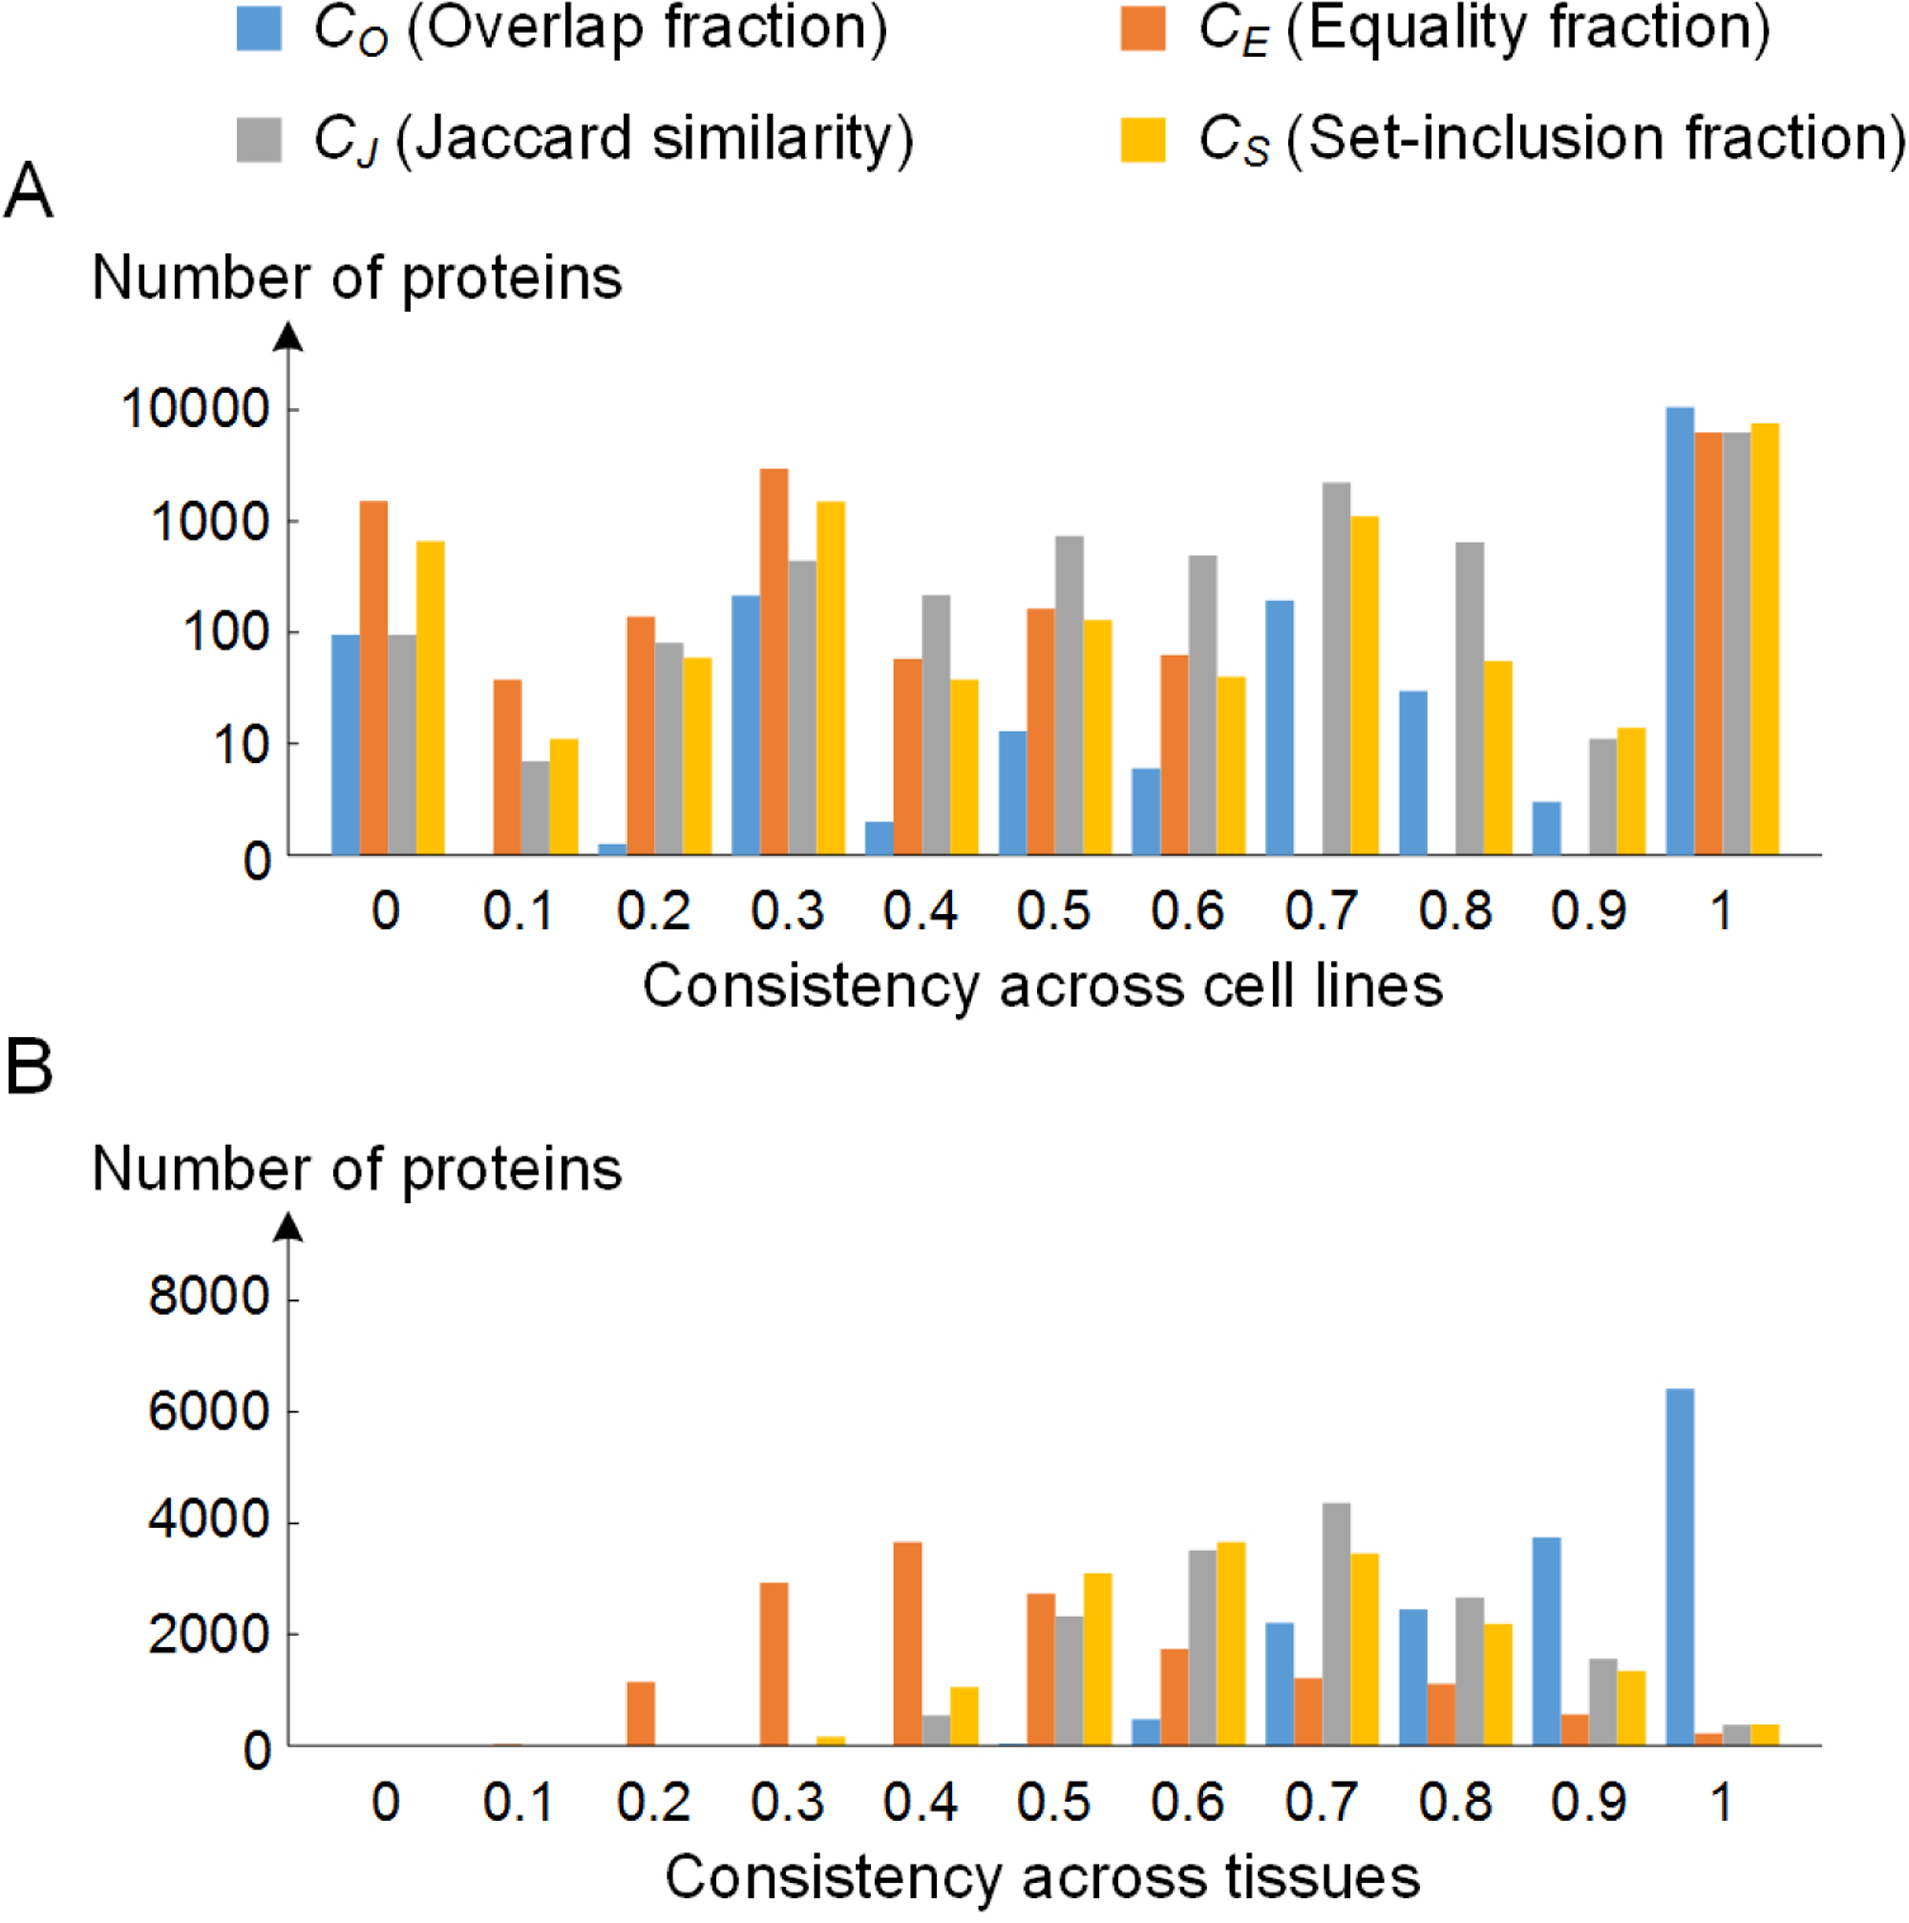
Annotation consistency of proteins across different cell lines and tissues. The statistics are based on the subcellular location annotations in the HPA.
Figure 6.
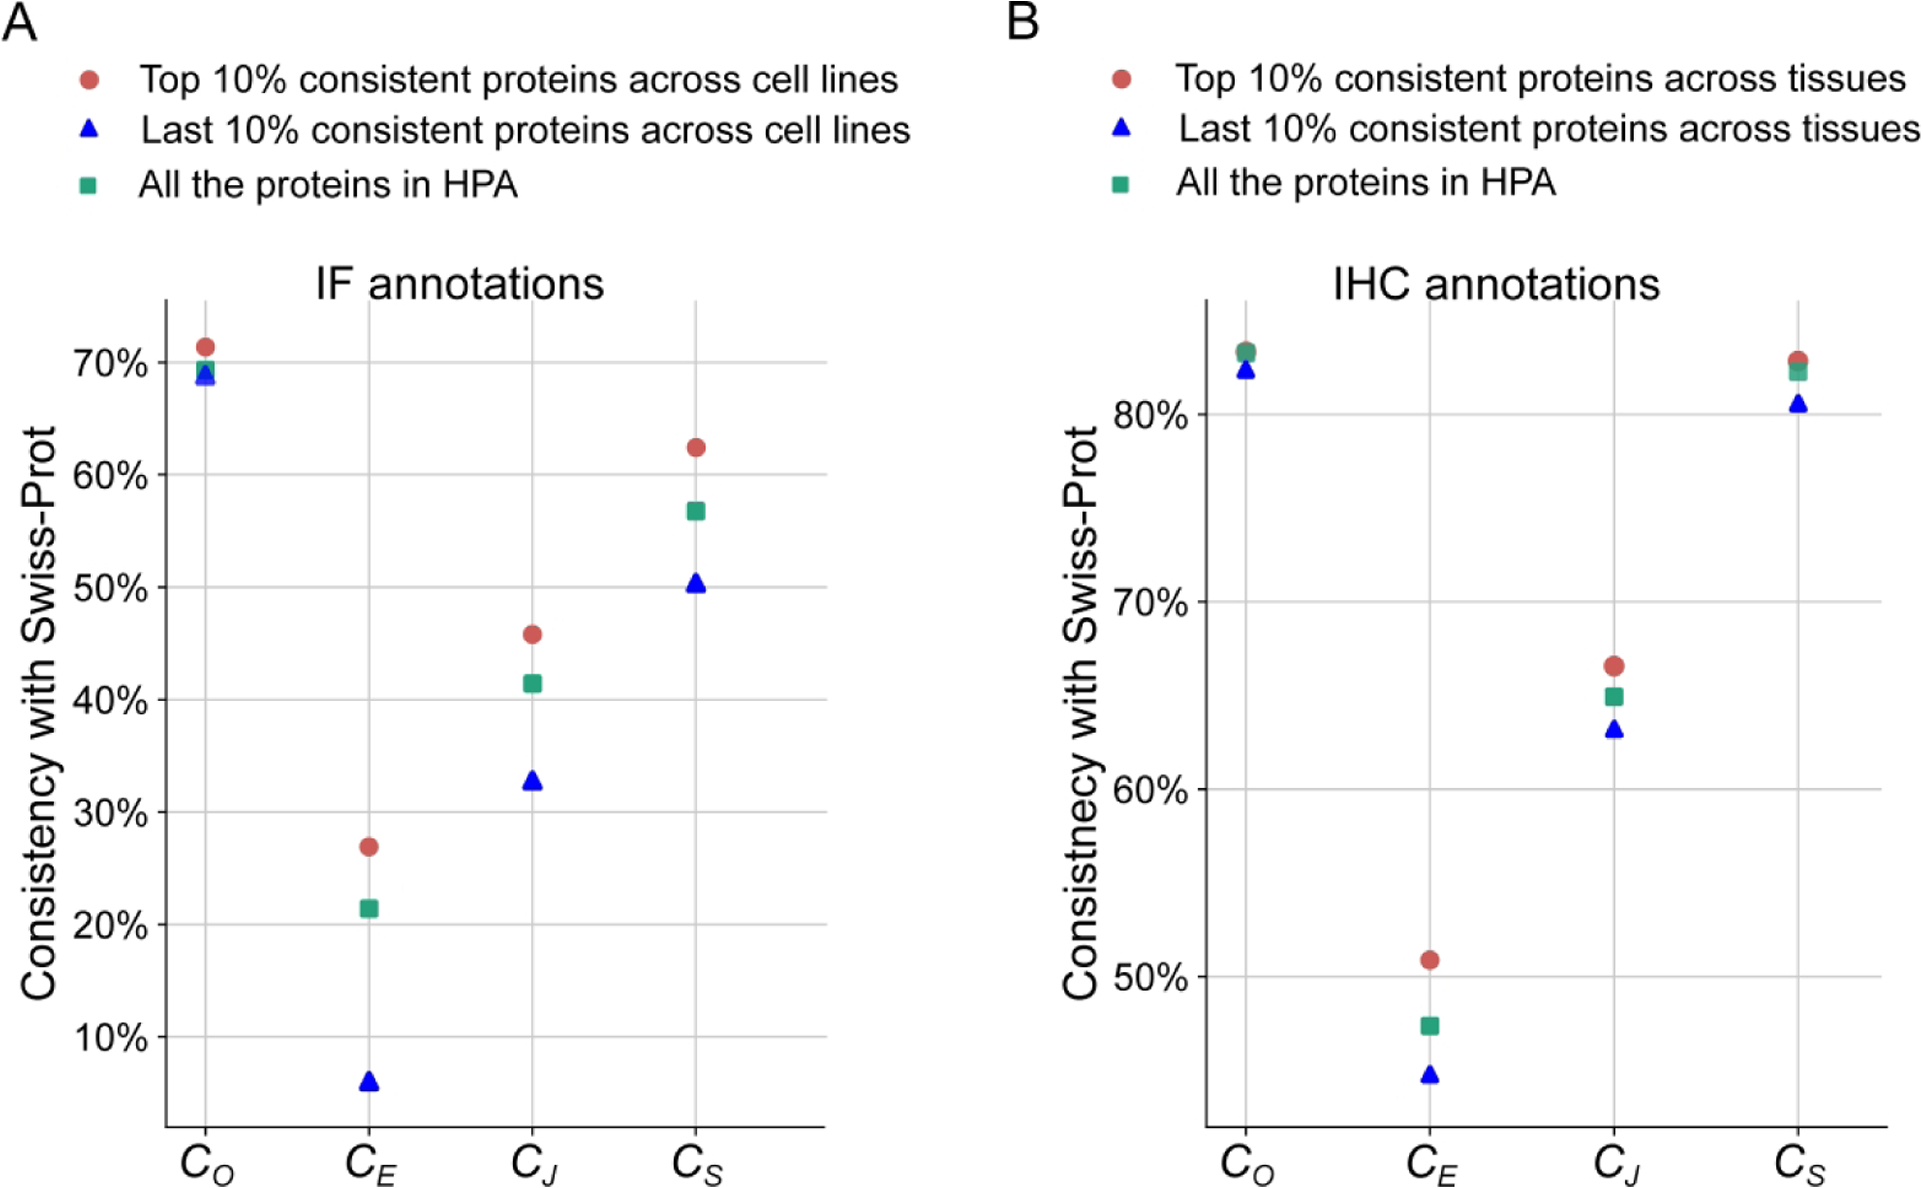
Comparison between annotation consistency across cell lines (A) or tissues (B) and consistency with Swiss-Prot.
Low consistency proteins and location biomarkers
We considered the possibility that the proteins showing low consistency across cell lines or tissues may have a higher probability to be location biomarkers for cancers. To investigate this hypothesis, we compared the low-consistency proteins with the proteins that are marked as candidate cancer biomarkers in the HPA, and with some proteins selected in a previous study of location biomarker detection. The proteins in our datasets were ranked by their total rank order of the consistency across cell lines or across tissues (Table S-7). The 10 proteins with the lowest-consistencies across tissues are listed in Table 1.
Table 1.
The top 10 proteins having lowest consistency of annotations across tissues
| Gene name | CO (Overlap fraction) | CE (Equality fraction) | CJ (Jaccard similarity) | CS (Set-inclusion fraction) |
|---|---|---|---|---|
| TIMELESS† | 0.582 | 0.168 | 0.360 | 0.302 |
| BCAT1 | 0.552 | 0.177 | 0.352 | 0.303 |
| ZNHIT3† | 0.608 | 0.154 | 0.361 | 0.280 |
| ADTRP | 0.573 | 0.170 | 0.358 | 0.319 |
| MC3R | 0.617 | 0.146 | 0.363 | 0.292 |
| CENPQ | 0.617 | 0.147 | 0.364 | 0.303 |
| HKR1 | 0.607 | 0.158 | 0.365 | 0.309 |
| LYG2 | 0.574 | 0.165 | 0.355 | 0.337 |
| ORC6† | 0.616 | 0.153 | 0.368 | 0.289 |
| FOXN3 | 0.605 | 0.155 | 0.363 | 0.333 |
Proteins that are marked as disease and drug related proteins in HPA
In HPA, a small part of proteins are marked as candidate cancer biomarker proteins based on survey work of the Plasma Proteome Institute, which compiled a list of proteins believed to be differentially expressed in human cancer from literature and other sources31. There are a total of 958 marked proteins in HPA, accounting for 4.87% of the whole protein dataset. We counted the marked biomarkers in the sets of the top ranked 100 low-consistency proteins across cell lines and across tissues, respectively. It turned out that 7% and 8% of the low-consistency proteins are biomarkers, higher than the proportion in the whole protein dataset.
In addition, we compared the consistency results with determined P values in a previous study1 where these P values were used to measure the change of protein location and expression level between normal and cancerous human tissues, and the proteins with low P values were regarded as potential location biomarkers (the P values are shown in Table S-7). There is a slight trend that the low-consistency proteins across tissues have relatively low P values (Figure S-3). In particular, the mean of P values of all proteins in bladder tissue was 0.346, while the mean value decreased to 0.285 for only the top ranked 5% low-consistency proteins. For the proteins having low consistency across cell lines, the mean P value is 0.339 for the proteins whose all the four consistency criteria across cell lines are zeros, which is somewhat lower than the mean of all proteins, 0.383.
These results give support to the hypothesis that the proteins with high variation across cell lines or tissues are more likely to be changed during carcinogenesis, and suggest that these proteins should be given priority in future detection and validation of cancer biomarkers.
Access to consistency information of proteins of interest
Since many researchers may be interested only in annotations of specific proteins, we provide a resource to check the annotation consistency of a given protein (See code in http://www.csbio.sjtu.edu.cn/bioinf/ConsistencyHPASwissProt/). The information includes subcellular location annotation of IHC and IF images in HPA, subcellular location in Swiss-Prot, and consistency criteria between the two sources, as well as the annotation consistency of the protein(s) across tissues and cell lines in HPA. We believe the resource would help users make better use of the protein location data.
4. Conclusions
In this paper, we investigated the consistency of protein subcellular location annotations in HPA and Swiss-Prot, as well as the variation of protein annotations across cell lines and tissues, and provided a resource to inspect location information for proteins of interest. In addition, we constructed two high-quality datasets composed of proteins with high-consistency annotations, which can be used for future studies of prediction of protein localization. A goal of this work was to give a view of current annotation status to users who wish to analyze spatial distribution of proteins based on HPA and Swiss-Prot.
From the comparison results, we concluded that the subcellular location annotations in HPA and Swiss-Prot are often inconsistent. The discrepancies partly result from the different annotation approaches, as Swiss-Prot reviews subcellular location information from multiple sources (not including HPA) while HPA annotates from images of stained antibody-binding proteins through visual inspection. The HPA data with enhanced and supported levels have relatively high concordance, and the supported level achieved the best consistencies due to the similarity of annotation method with Swiss-Prot.
Much of the inconsistencies observed appear to relate to the difficulties that human annotators have in distinguishing similar organelles in fluorescence microscope images. The use of automated image analysis approaches may help here32,33.
Supplementary Material
Acknowledgements :
Y.Y.X. was supported by National Natural Science Foundation of China (61803196) and Natural Science Foundation of Guangdong Province of China (2018030310282). H.B.S. was supported by National Natural Science Foundation of China (61725302, 61671288) and Science and Technology Commission of Shanghai Municipality (17JC1403500). R.F.M. was supported by United States National Institutes of Health (R01 GM090033).
Footnotes
Supporting information: Supporting information, data, and code are available at http://www.csbio.sjtu.edu.cn/bioinf/ConsistencyHPASwissProt/
Declaration of interests:
Authors declare no conflict of interest.
References
- 1.Kumar A, Rao A, Bhavani S, Newberg JY, Murphy RF. Automated analysis of immunohistochemistry images identifies candidate location biomarkers for cancers. Proceedings of the National Academy of Sciences. 2014;111(51):18249–18254. [DOI] [PMC free article] [PubMed] [Google Scholar]
- 2.Xu Y-Y, Yang F, Zhang Y, Shen H-B. An image-based multi-label human protein subcellular localization predictor (iLocator) reveals protein mislocalizations in cancer tissues. Bioinformatics. 2013;29(16):2032–2040. [DOI] [PMC free article] [PubMed] [Google Scholar]
- 3.Lugo-Martinez J, Dengjel J, Bar-Joseph Z, Murphy RF. Integration of Heterogeneous Experimental Data Improves Global Map of Human Protein Complexes. Proceedings of the 10th ACM International Conference on Bioinformatics, Computational Biology and Health Informatics. 2019:144–153. [DOI] [PMC free article] [PubMed] [Google Scholar]
- 4.Dallago C, Goldberg T, Andrade-Navarro MA, Alanis-Lobato G, Rost B. CellMap visualizes protein-protein interactions and subcellular localization. F1000 Research. 2017;6:1824. [DOI] [PMC free article] [PubMed] [Google Scholar]
- 5.Xu Y, Shen H, Murphy RF. Learning complex subcellular distribution patterns of proteins via analysis of immunohistochemistry images. Bioinformatics. 2019;36(6):1908–1914. [DOI] [PMC free article] [PubMed] [Google Scholar]
- 6.Huang T, Shi X, Wang P, et al. Analysis and prediction of the metabolic stability of proteins based on their sequential features, subcellular Locations and interaction Networks. PLOS ONE. 2010;5(6):e10972. [DOI] [PMC free article] [PubMed] [Google Scholar]
- 7.Kim B, Jo J, Han J, Park C, Lee H. In silico re-identification of properties of drug target proteins. BMC Bioinformatics. 2017;18(7):248–248. [DOI] [PMC free article] [PubMed] [Google Scholar]
- 8.Boutet E, Lieberherr D, Tognolli M, et al. UniProtKB/Swiss-Prot, the Manually Annotated Section of the UniProt KnowledgeBase: How to Use the Entry View. Methods in Molecular Biology. 2016;1374:23–54. [DOI] [PubMed] [Google Scholar]
- 9.Uhlén M, Fagerberg L, Hallström BM, et al. Tissue-based map of the human proteome. Science. 2015;347(6220):1260419. [DOI] [PubMed] [Google Scholar]
- 10.Thul PJ, Åkesson L, Wiking M, et al. A subcellular map of the human proteome. Science. 2017;356(6340):eaal3321. [DOI] [PubMed] [Google Scholar]
- 11.Chou K-C, Shen H-B. Cell-PLoc: a package of Web servers for predicting subcellular localization of proteins in various organisms. Nature protocols. 2008;3(2):153–162. [DOI] [PubMed] [Google Scholar]
- 12.Horton P, Park K-J, Obayashi T, Nakai K. Protein subcellular localization prediction with WoLF PSORT. Paper presented at: Proceedings of the 4th Asia-Pacific Bioinformatics Conference 2006; Taipei, Taiwan. [Google Scholar]
- 13.Yu C-S, Cheng C-W, Su W-C, et al. CELLO2GO: a web server for protein subCELlular LOcalization prediction with functional gene ontology annotation. PLOS ONE. 2014;9(6):e99368. [DOI] [PMC free article] [PubMed] [Google Scholar]
- 14.Höglund A, Dönnes P, Blum T, Adolph H-W, Kohlbacher O. MultiLoc: prediction of protein subcellular localization using N-terminal targeting sequences, sequence motifs and amino acid composition. Bioinformatics. 2006;22(10):1158–1165. [DOI] [PubMed] [Google Scholar]
- 15.Almagro Armenteros JJ, Sønderby CK, Sønderby SK, Nielsen H, Winther O. DeepLoc: prediction of protein subcellular localization using deep learning. Bioinformatics. 2017;33(21):3387–3395. [DOI] [PubMed] [Google Scholar]
- 16.Zhou H, Yang Y, Shen H-B. Hum-mPLoc 3.0: prediction enhancement of human protein subcellular localization through modeling the hidden correlations of gene ontology and functional domain features. Bioinformatics. 2017;33(6):843–853. [DOI] [PubMed] [Google Scholar]
- 17.Nanni L, Brahnam S, Lumini A. High performance set of PseAAC and sequence based descriptors for protein classification. Journal of Theoretical Biology. 2010;266(1):1–10. [DOI] [PubMed] [Google Scholar]
- 18.Nanni L, Lumini A, Brahnam S. An empirical study of different approaches for protein classification. The Scientific World Journal. 2014;2014:236717. [DOI] [PMC free article] [PubMed] [Google Scholar]
- 19.Eliceiri KW, Berthold MR, Goldberg IG, et al. Biological imaging software tools. Nature methods. 2012;9(7):697–710. [DOI] [PMC free article] [PubMed] [Google Scholar]
- 20.Murphy RF. A new era in bioimage informatics. Bioinformatics. 2014;30(10):1353–1353. [DOI] [PubMed] [Google Scholar]
- 21.Pärnamaa T, Parts L. Accurate Classification of Protein Subcellular Localization from High-Throughput Microscopy Images Using Deep Learning. G3: Genes, Genomes, Genetics. 2017;7(5):1385–1392. [DOI] [PMC free article] [PubMed] [Google Scholar]
- 22.Coelho LP, Kangas JD, Naik AW, et al. Determining the subcellular location of new proteins from microscope images using local features. Bioinformatics. 2013;29(18):2343–2349. [DOI] [PMC free article] [PubMed] [Google Scholar]
- 23.Xu Y, Yao L, Shen H. Bioimage-based protein subcellular location prediction: a comprehensive review. Frontiers of Computer Science. 2018;12(1):26–39. [Google Scholar]
- 24.Sullivan DP, Winsnes CF, Åkesson L, et al. Deep learning is combined with massive-scale citizen science to improve large-scale image classification. Nature Biotechnology. 2018;36(9):820–828. [DOI] [PubMed] [Google Scholar]
- 25.Rumetshofer E, Hofmarcher M, Röhrl C, Hochreiter S, Klambauer GN. Human-level Protein Localization with Convolutional Neural Networks. International Conference on Learning Representations; 2019; New Orleans, USA. [Google Scholar]
- 26.Kraus OZ, Grys BT, Ba J, et al. Automated analysis of high-content microscopy data with deep learning. Molecular Systems Biology. 2017;13(4):924. [DOI] [PMC free article] [PubMed] [Google Scholar]
- 27.Li J, Newberg JY, Uhlén M, Lundberg E, Murphy RF. Automated analysis and reannotation of subcellular locations in confocal images from the human protein atlas. PLOS ONE. 2012;7(11):e50514. [DOI] [PMC free article] [PubMed] [Google Scholar]
- 28.Salvatore M, Warholm P, Shu N, Basile W, Elofsson A. SubCons : a new ensemble method for improved human subcellular localization predictions. Bioinformatics. 2017;33(16):2464–2470. [DOI] [PubMed] [Google Scholar]
- 29.Uhlen M, Bandrowski A, Carr S, et al. A proposal for validation of antibodies. Nature Methods. 2016;13(10):823–827. [DOI] [PMC free article] [PubMed] [Google Scholar]
- 30.Veres DV, Gyurkó DM, Thaler B, et al. ComPPI: a cellular compartment-specific database for protein–protein interaction network analysis. Nucleic Acids Research. 2014;43(D1):D485–D493. [DOI] [PMC free article] [PubMed] [Google Scholar]
- 31.Polanski M, Anderson NL. A List of Candidate Cancer Biomarkers for Targeted Proteomics. Biomarker Insights. 2006;1(1):1–48. [PMC free article] [PubMed] [Google Scholar]
- 32.Johnson GR, Li J, Shariff A, Rohde GK, Murphy RF. Automated learning of subcellular variation among punctate protein patterns and a generative model of their relation to microtubules. PLOS Computational Biology. 2015;11(12):e1004614. [DOI] [PMC free article] [PubMed] [Google Scholar]
- 33.Ouyang W, Winsnes CF, Hjelmare M, et al. Analysis of the Human Protein Atlas Image Classification competition. Nature Methods. 2019;16(12):1254–1261. [DOI] [PMC free article] [PubMed] [Google Scholar]
Associated Data
This section collects any data citations, data availability statements, or supplementary materials included in this article.


