

Abstract
Sphingolipids have diverse structural and bioactive functions that play important roles in many key biological processes. Factors such as low relative abundance, varied structures, and a dynamic concentration range provide a difficult analytical challenge for sphingolipid detection. To further improve mass-spectrometry-based sphingolipid analysis, lithium adduct consolidation was implemented to decrease spectral complexity and combine signal intensities, leading to increased specificity and sensitivity. We report the use of lithium hydroxide as a base in a routine hydrolysis procedure in order to effectively remove common ionization suppressants (such as glycolipids and glycerophospholipids) and introduce a source of lithium into the sample. In conjunction, an optimized MALDI matrix system, featuring 2′,4′,6′-trihydroxyacetophenone (THAP) is used to facilitate lithium adduct consolidation during the MALDI process. The result is a robust and high-throughput sphingolipid detection scheme, particularly of low-abundance ceramides. Application of our developed workflow includes the detection of differentially expressed liver sphingolipid profiles from a high-fat-induced obesity mouse model. We also demonstrate the method’s effectiveness in detecting various sphingolipids in brain and plasma matrices. These results were corroborated with data from UHPLC HR MS/MS and MALDI FT-ICR, verifying the efficacy of the method application. Overall, we demonstrate a high-throughput workflow for sphingolipid analysis in various biological matrices by the use of MALDI TOF and lithium adduct consolidation.
Keywords: sphingolipids, MALDI TOF mass spectrometry, base hydrolysis, lithium adduction
Graphical Abstract

INTRODUCTION
Lipids have received renewed interest for their biological significance and potential role as markers of cellular dysfunction.1,2 In particular, a subclass of lipids, called sphingolipids, are of keen interest due to their unique role in cell membranes and as bioactive signaling molecules.3 Sphingolipid metabolism is a tightly regulated cellular process, and subsequent disruption of sphingolipid homeostasis leads to changes in individual sphingolipid structure and abundance.4 A variety of pathologies including neurodegeneration, cardiovascular disease, diabetes, liver injury, and cancer have been associated with perturbations in sphingolipid metabolism.5-9 The ability to detect sphingolipids from biological samples provides an opportunity to gain a more comprehensive understanding of the importance of sphingolipid metabolism in the context of human disease.
Sphingolipid detection has been achieved by a variety of analytical techniques, of which mass spectrometry (MS) has been at the forefront.10-15 Clean and effective sample preparation is a significant factor in determining the success of mass spectrometry.16 To isolate lipids from other biomolecules within a sample matrix, a lipid extraction procedure is performed. In the case of sphingolipids, the lipid extraction procedure routinely includes a mild base hydrolysis step, where abundant acyl chain lipids are hydrolyzed, effectively preserving sphingolipids and removing high-abundance glycerophospholipids and glycerolipids.10,13,17 The end result is a sphingolipid enrichment strategy that provides reduced spectral complexity for sensitive sphingolipid detection.
Another factor that complicates the mass spectrometry analysis of sphingolipids is the presence of endogenous salts and salts derived from laboratory ware or solvents.18 The amount of salt content within the sample greatly influences the ionization process.19 When lipids are ionized in the positive ion mode, they have a high affinity to pair with various cations (e.g., H+, Na+, K+) in the sample matrix to form a variety of adducts.20 This effect contributes to ionization efficiency and generates an ion series where multiple adducts are observed in the mass spectrum for any particular lipid species. The formation of multiple adducts increases spectral complexity and can add ambiguity to lipid identification. To mitigate this issue, alkali salts can be added to the sample prior to analysis to reduce the formation of multiple adducts and promote adduct consolidation.21,22
Matrix-assisted laser desorption/ionization (MALDI) time-of-flight (TOF) MS is a common and robust analytical platform for the analysis of lipids.23 MALDI TOF MS is advantageous for lipid analysis due to its fast analysis time (~seconds/spectra), low sample consumption (~μL/spot), tunability by matrix selection, high tolerance toward salts/buffers, high compatibility with the pulsed nature of TOF (high-resolution) mass spectrometers, amenability to automation, and complementarity to ESI platforms.24 The MALDI process creates pulsed packets of ions, which are uniquely compatible with the pulsed nature of how ions are introduced into the TOF mass analyzer. The TOF mass analyzer yields mass spectra that have high mass resolution and low detection limits.25 The formation of gas-phase ions via MALDI requires cocrystallization with a sample and a MALDI matrix. MALDI matrices are typically UV absorbing organic acids and are a crucial factor in facilitating gas-phase ionization of biomolecules during the laser ablation process. The type of MALDI matrix used is selected based on the structural features of the analyte of interest. Since the MALDI process is tolerant to salts and/or buffer additives, MALDI analysis is particularly compatible with the addition of alkali salts to either the MALDI matrix or during the sample preparation procedure.20,26,27 As a consequence, adduct formation can be biased toward the formation of a desired adduct, such as lithium. Lithium adduct formation during gas-phase ionization of lipids is advantageous for several notable reasons: (1) lithium is present at low levels endogenously,28 (2) lithium is present at low levels exogenously in laboratory ware and solvents,29 (3) lithium adduction is energetically favorable and promotes adduct consolidation,30-32 and (4) gas-phase fragmentation of lithium adducts produces information-rich fragmentation spectra.33,34
In order to take advantage of sphingolipid enrichment via mild base hydrolysis, enhanced detection via lithium adduct consolidation, and robust and efficient sphingolipid detection, we developed an analytical workflow combining a sphingolipid preparation procedure interfaced to MALDI TOF MS. Our workflow selectively enriched for sphingolipids by integrating a lithium hydroxide base hydrolysis step into the lipid extraction procedure to facilitate lithium adduct consolidation during the MALDI process. The result was an analytical method that provided rapid and high-confidence detection of sphingolipids from biological matrices. Our developed workflow was applied to the analysis of sphingomyelin and ceramide extracted from liver tissue from a murine obesity model. Our results demonstrated lithium hydroxide hydrolysis combined with MALDI TOF MS is a robust analytical platform for rapid detection of abundant sphingolipids from biological matrices.
MATERIALS AND METHODS
Materials.
LC–MS grade acetonitrile, methanol (MeOH), water, n-propanol, formic acid, and ammonium formate were purchased from Fisher Scientific (Pittsburgh, PA). HPLC grade tert-butyl methyl ether (MTBE) and chloroform (CHCl3) were purchased from Sigma-Aldrich (St. Louis, MO). 2,5-Dihydroxybenzoic acid (DHB; 99% purity) was purchased from Acros Organic (Fair Lawn, NJ). The following were purchased from Sigma-Alrich (St. Louis, MO): 2′,4′,6′-trihydroxyacetophenone (THAP) (MALDI MS grade), 2′,4′-dihydoxylatedacetophenone (DHAP) (99%), α-cyano-4-hydroxycinnamic acid (CHCA) (MALDI MS grade), N-(1-naphthyl)ethylenediamine dihydrochloride (NEDC) (ACS reagent, >98%), 9-aminoacridine (9-AA) (MALDI MS), lithium hydroxide (LiOH) (BioUltra grade), potassium hydroxide (KOH) (Reagent grade), and lithium chloride (LiCl) (ReagentPlus grade). Lipid standards were purchased from Avanti Polar Lipids, Inc. (Alabaster, AL). The lipid standards included EquiSPLASH LIPIDOMIX Quantitative Mass Spec Internal Standard (330731) and the following individual lipid standards: PC(34:0) (850360), LPC(17:0) (855676), Cer(d18:1/12:0) (860512), Cer(d18:1/16:0) (860516), Cer(d18:1/20:0) (860520), and Cer(d18:1/24:0) (860524). Porcine brain total lipid extract (131101) and bovine liver total liver extract (181104) were purchased from Avanti Polar Lipids, Inc. Expired human plasma was kindly donated by the University of Maryland Blood Bank. Mouse plasma was purchased from BioIVT (Hicksville, NY).
Liver Tissue from High-Fat-Diet Mouse Model.
Female C57BL/6J mice (6–8 weeks old) were purchased from Jackson Laboratories (Bar Harbor, Maine). Experimental animal studies were performed as approved by the Institutional Animal Care and Use Committee at the University of Maryland, Baltimore and under the supervision of the Veterinarians and Veterinary Resource Staff at the University of Maryland, Baltimore. A palm-olein-based high-fat diet (fat content of 45% energy) or a palm-olein-based low-fat diet (fat content of 10% energy), prepared according to the formulation of the American Institute of Nutrition (AIN-93M), was composed of food-grade quality casein, corn starch, maltodextrin, sucrose, palm olein, soybean oil, cellulose, mineral mix, vitamin mix, l-cystine, choline bitartrate, and TBHQ from various suppliers. The animal diet was manufactured and vacuum packaged by Tropical Animal Feed High-Tech Co, Ltd. (Nantong, China). Upon delivery, the diet was stored at −20 °C to prevent degradation of the lipids. The animal diet was brought to room temperature and weighed before being provided to the mice. Mice were provided the diet ad libitum for 8 weeks, which was exchanged for fresh diet every 2 days. Unconsumed food was weighed, and diet intake for each cage was calculated. After 8 weeks on the modified diet, the mice were euthanized by exsanguination. The livers were removed and stored at −80 °C.
Total Lipid Extraction (without Base Hydrolysis).
Total lipid extracts from 10 mg of homogenized liver tissue or 25 μL of plasma were prepared using a modified MTBE lipid extraction protocol.35 Briefly, 250 μL of ice-cold methanol and 10 μL of internal standard mixture (EquiSPLASH lipidomix) were added to each liver tissue (or plasma) sample followed by incubation at 4 °C and 650 rpm shaking for 15 min. Next, 500 μL of ice-cold MTBE was added followed by incubation at 4 °C for 1 h with 650 rpm shaking. Then, 500 μL of cold water was added slowly, and the resulting extract was maintained at 4 °C with 650 rpm shaking for 15 min. Phase separation was completed by centrifugation at 8000 rpm for 8 min at 4 °C. The organic phase was removed and set aside on ice. The aqueous phase was re-extracted with 200 μL of MTBE followed by 15 min of incubation at 4 °C with 650 rpm shaking. Phase separation was completed by centrifugation at 8000 rpm for 8 min at 4 °C. The organic phase was removed and combined with the previous organic extract. The organic extract was dried under a steady stream of nitrogen at 30 °C. The recovered lipids were reconstituted in 200 μL of CHCl3/MeOH (1:1, v/v) containing 200 μM of butylated hydroxytoluene (BHT) and stored at −20 °C until analysis. The aqueous phase was used to determine the protein content of the liver tissue samples via a BCA kit (bicinchoninic acid assay, Thermo Fisher Scientific, Rockford, USA).
Lithium Hydroxide (LiOH) Mild Base Hydrolysis.
A 200 μL volume of total lipid extract (prepared as described above) was diluted with 200 μL of CHCl3/MeOH (1:1, v/v, 200 μM BHT). Then, 80 μL of 1 M LiOH(aq) was added and incubated for 2 h at 37 °C with shaking at 400 rpm. Next, 160 μL of ice-cold H2O was added, and the mixture was vortexed for 20 s. The mixture was centrifuged at 8000 rpm for 8 min at 4 °C. The bottom organic layer was removed and dried under a steady stream of nitrogen in a disposable glass culture tube at 30 °C. Note, careful removal of the organic layer is crucial; any residuals from the aqueous layer will result in salt contamination. Samples were then resuspended in CHCl3/MeOH (1:1, v/v, containing 200 μM BHT) and stored at −20 °C until analysis.
Potassium Hydroxide (KOH) Mild Base Hydrolysis.
The same procedure as described for LiOH was followed for the KOH hydrolysis preparations with the replacement of LiOH(aq) with KOH(aq).
Matrix-Assisted Laser Desorption/Ionization (MALDI) Time-of-Flight (TOF) Mass Spectrometry (MS).
Prior to MALDI TOF MS analysis, samples were spotted on an MTP 384 ground steel Bruker MALDI plate using the two-layer/overlay method: 0.4 μL of sample was deposited and allowed to dry, followed by deposition of 0.4 μL of matrix solution. Matrix solutions included 10 mg/mL of DHB and 10 mg/mL of THAP, with and without 10 mM LiCl(aq). All matrix solutions were made in n-propanol/MeOH (1:1, v/v). MALDI TOF MS analysis was done using an ultrafleXtreme mass spectrometer (Bruker Daltonics, Bremen, Germany) in positive reflectron mode. Laser properties included a medium smartbeam at a frequency of 1 kHz for 6000 shots per sample. The laser power used was 62–64% for THAP and 50%–52% for DHB. Random walk, partial sample mode was enabled. The m/z range was set to 440–1600. Sphingomyelin and ceramide abundance were calculated using a one-point calibration curve based on the addition of the internal standard mixture (EquiSPLASH lipidomix, SM(d36:2-d9) and Cer(d33:1-d7)), respectively. The lithium adduct ([M + Li]+) was used for the calculation of abundance for both the analyte and internal standard. Data was analyzed via Bruker’s flexAnalysis Version 3.4 (Build 50). Univariate analysis was done using Prism 6 (GraphPad, La Jolla, CA).
MALDI Fourier Transform Ion Cyclotron Resonance (FT-ICR) Mass Spectrometry.
Sample and matrix application followed the procedure outlined for above (MALDI TOF MS). The MALDI FT-ICR experiments were done using a solariX-XR 12 T FT-ICR mass spectrometer equipped with a dual electrospray ionization (ESI) and MALDI source (Bruker Daltonics, Bremen, Germany). The data set size was 1 MW (~0.5 s transient length), the detection was in magnitude mode with ramped excitation, and the m/z range was 200–3000. The MALDI source had the following parameters: the laser was set to 1 kHz at a laser power of ~30% (instrument specific setting), smartwalk with selective accumulation was enabled, and 500 laser shots per acquisition and 15 scans were summed. All data were acquired and processed with Data-Anaylsis 4.2 (Bruker Daltonics).
Ultrahigh-Performance Liquid Chromatography (UHPLC) High-Resolution Tandem Mass Spectrometry (HR-MS/MS).
Prior to analysis, liver tissue extracts (described above) were diluted 10-fold with acetonitrile:n-propanol:water (1:2:1, v/v/v). The liver tissue extracts were analyzed by UHPLC HR-MS/MS on an Agilent 1290 Infinity LC coupled to an Agilent 6560 Quadrupole Time-of-Flight (Q-TOF) mass spectrometer (Santa Clara, CA). The separation was achieved using an InfinityLab Poroshell 120 EC-18 (1.9 μm; 2.1 × 100 mm) column (Agilent, Santa Clara, CA). Mobile phase A was 10 mM ammonium acetate and 0.2 mM ammonium fluoride in water/methanol (9:1, v/v), and mobile phase B was 10 mM ammonium acetate and 0.2 mM ammonium fluoride in acetonitrile/methanol/n-propanol (2:3:5, v/v/v). The gradient was held at 70% B for 1 min, ramped to 86% B in 2.5 min, held at 86% B for 6.5 min, ramped to 100% B in 1 min, held at 100% B for 6 min, ramped to 70% B in 0.1 min, and held at 70% B for 1.9 min. The flow rate was 0.4 mL/min. The column was maintained at 55 °C, and the autosampler was kept at 5 °C. A 2 μL injection was used for positive ion mode. Mass spectrometry analysis was separated into two workflows: (1) lipid identification of a pooled sample using an iterative MS/MS acquisition and (2) lipid (relative) quantitation of all samples using high-resolution, accurate mass MS1 acquisition and spiked internal standards. The MS parameters for the iterative workflow were as follows: extended dynamic range, 2 GHz; gas temperature, 200 °C; gas flow, 10 L/min; nebulizer, 50 psi; sheath gas temperature, 300 °C; sheath gas flow, 12 L/min; VCap, 3.5 kV (+); nozzle voltage, 250 V; reference mass m/z 121.0509, m/z 1221.9906 (+); MS and MS/MS range m/z 100–1700; acquisition rate, 3 spectra/s; isolation, narrow (~1.3 m/z); collision energy 20 eV (+); max precursors/cycle, 3; precursor-abundance-based scan speed, 25 000 counts/spectrum; ms/ms threshold, 5000 counts and 0.001%; active exclusion enabled yes; purity, stringency 70%, cut off 0%; isotope model, common organic molecules; static exclusion ranges, m/z 40 to 151. Sphingomyelin and ceramide abundance were calculated using a one-point calibration curve based on the addition of the internal standard mixture (EquiSPLASH lipidomix, SM(d36:2-d9) and Cer(d33:1-d7)), respectively. The protonated minus water adduct ([M + H − H2O]+) was used for calculation of abundance for both the analyte and internal standard. LC–MS data from the iterative MS/MS workflow was analyzed for lipid identification via Agilent’s Lipid Annotator (v 1.0). The LC–MS data from the MS1 workflow were processed using Agilent’s MassHunter Profinder (v 10.0). Univariate analysis was done using Prism 6 (GraphPad, La Jolla, CA).
RESULTS
MALDI Matrix Selection.
We first investigated the choice of which MALDI matrix would be most appropriate for ionization of sphingolipids in the positive ion mode when considering the addition of lithium to the matrix solvent. A number of matrices including DHB, THAP, DHAP, CHCA, 9-AA, and NEDC were evaluated as a single matrix and binary mixtures. 9-AA and NEDC are commonly used in the negative ion mode and were considered in the positive ion mode for utility in future dual polarity experiments. DHB and THAP as single matrices outperformed all other matrices in the positive ion mode (data not shown for other matrices). Representative MALDI TOF mass spectra using DHB and THAP without the addition of lithium for the analysis of liver total lipid extracts are shown in Supporting Information (SI) Figure S1. Both matrices resulted in mass spectra that were representative of liver lipid content and consistent with the presence of high-abundance glycerophosphatidylcholine (PC). Although the mass spectra were similar, there were some discernible differences between the use of DHB and THAP in both the presence and relative abundance of the lipids observed. Lipids have a high affinity for alkali salts and tend to form multiple adducts during the MALDI process. The use of THAP yielded a mass spectrum that had a higher percentage of sodium and potassium cation formation when compared to the use of DHB (Figure S2).
The addition of lithium in the form of lithium chloride (LiCl) at a concentration of 10 mM into the DHB and THAP solvent mixture resulted in varying degrees of lithium adduction for the liver total lipid extract (Figure S3). The THAP + LiCl spectrum displayed fairly universal lithium adduct consolidation with minor amounts of sodium adduction for the most abundant lipids (Figure S3B). The DHB + LiCl combination resulted in the lithium adduct as the most abundant adduct, but the protonated and sodiated adducts were routinely observed (Figure S3A). Of note, the addition to lithium to both matrices favorably increased triacylglycerol (TG) ionization. The use of THAP with LiCl preferentially biased ionization toward lithium adduct consolidation. Yet, the lipids we were most interested in, sphingolipids, were still a challenge to detect on the MALDI TOF platform. In fact, only one sphingomyelin (SM(34:1)) was routinely detected in the liver total lipid extracts. We also verified the THAP + LiCl matrix mixture preferentially ionized ceramides in a lipid standard mixture. Ceramides via the use of both DHB and THAP are routinely observed as sodiated ([M + Na]+) adducts and to a lesser extent as protonated minus water ([M + H − H2O]+) adducts in MALDI spectra (Figure S4A,B). Conversely, the addition of LiCl to both DHB and THAP demonstrated effective lithium adduct consolidation for ceramides (Figure S4C,D). The combination of THAP + LiCl had a much higher efficiency for generating abundant, well-resolved lithium adducts when compared to DHB + LiCl.
Mild Base Hydrolysis.
The analysis of sphingolipids on a MALDI-TOF platform is challenging due to the low relative endogenous abundance of sphingolipids compared to the relatively high-abundance glycerophospholipids and glycerolipids present in most biological matrices. This is evident in Figures S1 and 1A by the limited number of sphingolipids detected. A common strategy to enrich for sphingolipids in a total lipid extract is to incorporate a mild base hydrolysis step during the lipid extraction procedure. This is routinely done using mild alkaline conditions via potassium hydroxide (KOH) where the basic reaction conditions preferentially hydrolyze susceptible glycerophospholipid and glycerolipid ester linkages while preserving the less susceptible amide linkages found in sphingolipids. The use of KOH for liver total lipid extracts resulted in a MALDI TOF mass spectrum that was devoid of glycerophospholipids and glycerolipids and subsequently enriched in sphingomyelin (SM) detected as potassium adducts (Figure 1B). The substitution of KOH with lithium hydroxide (LiOH) resulted in a mass spectrum with effective glycerophospholipid and glycerolipid hydrolysis and enrichment in SM similar to KOH (Figure 1C) with the notable difference of lithium adduct formation. The SM that is detected via the use of base hydrolysis (Figure 1B,C) is present in the nonhydrolyzed spectrum (Figure 1A) yet are obscured by the more abundant multiadducted glycerophospholipids. The zoomed in view of the m/z range covering the detection of a very long acyl chain SM highlights the advantage of using base hydrolysis for SM detection on the MALDI TOF platform (Figure 2). SM detection, in nonalkaline hydrolysis conditions, is further confounded via the nitrogen rule.36 SM, containing two nitrogen atoms, has an odd nominal m/z value (per the nitrogen rule). PC, having one nitrogen, has an even nominal m/z value. The second isotope of PC (containing one 13C) has an odd m/z value and overlaps with the monoisotopic m/z value of SM. Refer to the inset table in Figure 2. Although the TOF mass spectrometer used in these experiments routinely achieved high resolution (>15 000), the difference of abundance and ionization efficiency between PC and SM rendered SM detection via MALDI TOF near impossible without the inclusion of mild alkaline hydrolysis. Another useful measure for evaluating sphingolipid detection is the comparison of the signal-to-noise ratio (SNR). For example, the SNR for SM(d34:1) as the protonated adduct ([M + H]+, m/z 703.6) with DHB and THAP (without lithium) was 15 and 8 (Figures S1A and 1A), respectively. Conversely, the SNR for SM(d34:1) as the lithium adduct ([M + Li]+, m/z 709.6) using the LiOH–THAP method was 265 (Figure 1C). This represents a SNR approximately 20 times greater when using the LiOH–THAP method compared to the more traditional DHB for SM detection.
Figure 1.

MALDI TOF mass spectra of liver total lipid extract with THAP as the matrix. (A) MALDI TOF mass spectrum without mild base hydrolysis. (B) MALDI TOF mass spectrum with KOH hydrolysis. (C) MALDI TOF mass spectrum with LiOH hydrolysis. Tables to the right of mass spectra correspond to the adjacent mass spectrum. Green corresponds to protonated ([M + H]+) and sodiated ([M + Na]+) adducts. Red corresponds to potassiated ([M + K]+) adducts. Blue corresponds to lithiated ([M + Li]+) adducts. Lipid identifications were based on accurate mass database matching using LIPIDMAPS. Lipid identification listed as sum composition. TLE, total lipid extract; LPC, lysophosphatidylcholine; PC, glycerophosphatidylcholine; SM, sphingomyelin; ppm, parts per million; S/N, signal-to-noise; Res., mass resolution; Intens., intensity.
Figure 2.
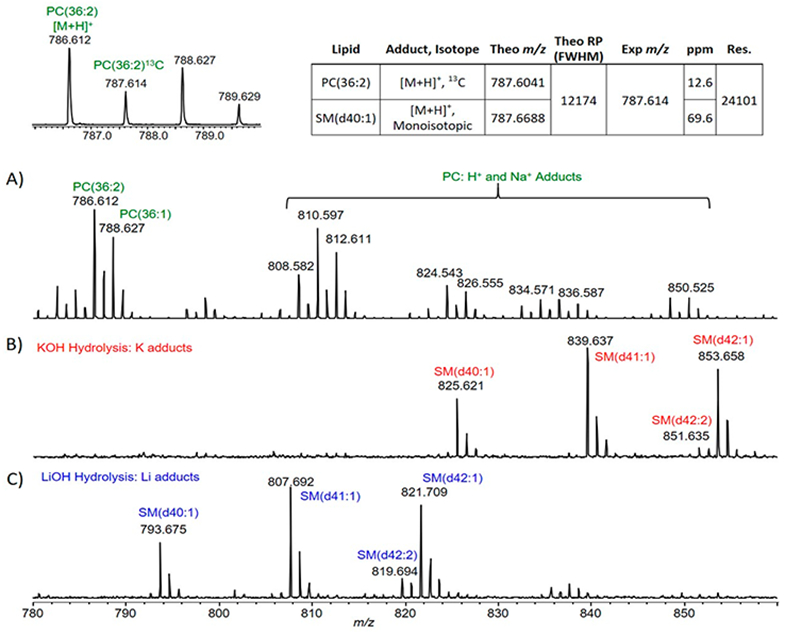
MALDI TOF mass spectra of liver total lipid extract from Figure 1 with zoomed m/z region of 780–860. (A) MALDI TOF mass spectrum without mild base hydrolysis. Inset mass spectrum zoomed to cover m/z region of 785–790 indicating monoisotopic and second isotope peaks for PC(36:2). Inset table describes the second isotope of PC(36:2) and the monoisotopic peak of SM(d40:1) both as [M + H]+. (B) MALDI TOF mass spectrum with KOH hydrolysis. (C) MALDI TOF mass spectrum with LiOH hydrolysis. (B,C) do not contain PC lipids due to effective base hydrolysis. Green, [M + H]+ and [M + Na]+; Red, [M + K]+; Blue, [M + Li]+. PC, glycerophosphatidylcholine; SM, sphingomyelin; theo m/z, theoretically determined m/z value; theo RP, theoretical resolving power needed to resolve 787.6041 and 787.6688 at full width half-maximum (fwhm); ppm, parts per million; Res., experimentally determined mass resolution at m/z 787.614.
The overwhelming advantage of lithium adduction over potassium adduction for liver total lipid extracts was observed when considering ceramide detection. Ceramides are present in considerably lower abundance across biological matrices when compared to SM.37 The detection of ceramides without the inclusion of solid-phase extraction, chromatography, or base hydrolysis is an analytical challenge.38 This challenge is further extended when using MALDI TOF MS for ceramide detection. The low abundance of ceramide species combined with the presence of matrix clusters in the m/z range of ceramides makes the use of MALDI TOF MS difficult. This was evident with nonhydrolysis conditions and with the use of KOH (Figures 1B and 3A). Even with effective removal of high-abundance glycerophospholipids and glycerolipids, the detection of ceramide was not accomplished. Conversely, the use of LiOH during the base hydrolysis step resulted in a mass spectrum (Figure 3B) that contained high-confidence detection of ceramide species. The use of LiOH, THAP, and MALDI-TOF MS provided an effective platform for SM and ceramide detection from liver total lipid extracts.
Figure 3.

MALDI TOF mass spectra of liver total lipid extract with THAP as the matrix. (A) MALDI TOF mass spectrum without mild base hydrolysis. (B) MALDI TOF mass spectrum with KOH hydrolysis. (C) MALDI TOF mass spectrum with LiOH hydrolysis. Tables to the right of mass spectra correspond to the adjacent mass spectrum. Green corresponds to protonated ([M + H]+) and sodiated ([M + Na]+) adducts. Red corresponds to potassiated ([M + K]+) adducts. Blue corresponds to lithiated ([M + Li]+) adducts. Lipid identifications were based on accurate mass database matching using LIPIDMAPS. Lipid identification listed as sum composition. TLE, total lipid extract; LPC: lysophosphatidylcholine; PC, glycerophosphatidylcholine; SM, sphingomyelin; ppm, parts per million; S/N, signal-to-noise; Res., mass resolution; Intens., intensity.
The LiOH hydrolysis, THAP, and MALDI TOF MS platform was transferred to the detection of sphingolipids in brain total lipid extracts and plasma. Analogous to the liver total lipid extracts, LiOH hydrolysis of brain and plasma effectively removed the high-abundance glycerophospholipids and glycerolipids and permitted detection of sphingolipids (Figures 4 and S5). The mass spectrum of brain total lipid extract without hydrolysis was populated with high-abundance PC and glycerophosphatidylethanolamine (PE) (Figure 4A). The inclusion of LiOH for mild base hydrolysis enabled robust detection of hexosylceramide (HexCer), with and without hydroxylation, and SM (Figure 4B). Sphingolipids detected in base hydrolyzed samples were present in the samples without the hydrolysis, yet they were not observed due to endogenous abundance and ionization competition from glycerophospholipids. The identities of the HexCer were confirmed by ultrahigh-resolution mass spectrometry on a MALDI FT-ICR mass spectrometer (Figure S6) and tandem mass spectrometry (data not shown). The plasma samples tested contained blood drawn from human and mouse. An example mass spectrum for human plasma is shown in Figure S5.
Figure 4.

MALDI TOF mass spectra of brain total lipid extract with THAP as the matrix. (A) MALDI TOF mass spectrum without mild base hydrolysis. (B) MALDI TOF mass spectrum with LiOH hydrolysis. Table to the right of mass spectra corresponds to the identified sphingolipids in the LiOH hydrolysis preparation (B). Green, [M + H]+ and [M + Na]+; Blue, [M + Li]+. Lipid identifications were based on accurate mass database matching using LIPIDMAPS. Sphingolipid identifications were confirmed by MALDI FT-ICR MS (Figure S6). Lipid identification listed as sum composition. TLE, total lipid extract; PC, glycerophosphatidylcholine; SM, sphingomyelin; HexCer, hexosylceramide; ppm, parts per million; S/N, signal-to-noise; Res., mass resolution; Intens., intensity. *elevated mass accuracy was confirmed with MALDI FT-ICR (Figure S6).
Application to Liver Tissue for Sphingolipid Detection from Obesity Mouse Model.
We applied our LiOH hydrolysis lipid extraction procedure to the analysis of sphingolipids from liver tissue of mice on either a low- or high-fat diet. The extracted sphingolipids were analyzed by MALDI TOF MS with THAP as the MALDI matrix. There were three biological replicates per diet (n = 3), and all samples were spiked with the EquiSplash internal standard mixture. The EquiSplash standard contains a mixture of deuterated lipids representing the most abundant glycerophospholipid, glycerolipid, and sphingolipid subclasses. Of note, the mixture contains deuterated sphingomyelin (SM(d36:2-d9)) and ceramide (Cer(d33:1-d7)). Example mass spectra comparing the sphingolipid profiles for the low- and high-fat diets are reported in Figure 5. A total of five ceramide and eight sphingomyelin structures were identified. Qualitatively, the low- and high-fat-diet mass spectra look similar. The addition of the internal standard mixture allowed for calculation of SM and ceramide abundance relative to the spiked concentration of SM(d36:2-d9) and Cer(d33:1-d7), respectively. The reported abundance is based on a one-point calibration analogous to untargeted LC–MS/MS lipidomic workflows (Figure 6A). The % coefficient of variation (CV) for the majority of the detected ceramide and SM species was under 20%, and all reported CVs were under 40%. Statistical analysis of the calculated concentrations demonstrated that there were four individual sphingolipid species (one ceramide and three sphingomyelins) that were statistically different when comparing low- and high-fat diets (Figure 6B).
Figure 5.

MALDI TOF mass spectra of liver total lipid extracts from mice on a low-fat diet (A) or a high-fat diet (B). Liver extracts were prepared using LiOH hydrolysis. THAP was the MALDI matrix. Tables to the right of mass spectra correspond to the adjacent mass spectrum. Lipid identifications were based on accurate mass database matching using LIPIDMAPS. Lipid identification listed as sum composition. TLE, total lipid extract; Cer, ceramide; SM, sphingomyelin; ppm, parts per million; Rel. Int., relative intensity; Res., mass resolution.
Figure 6.

Statistical evaluation of identified sphingolipids from liver total lipid extracts from mice on a low- or high-fat diet. (A) The calculated abundance for Cer and SM from the MALDI TOF experiments. Units are in pmol/mg of tissue. (B) Cer and SM that were statistically different between the low- and high-fat diets from the MALDI TOF experiments. (C) Cer and SM that were statistically different between the low- and high-fat diets from the LC HR-MS/MS experiments. The same samples were analyzed for both mass spectrometry platforms. There were three biological replicates (n = 3) per diet. Significance was calculated using a Student t test with p < 0.05 as significant. * p < 0.05, *** p < 0.005. SEM, standard error of the mean; CV, coefficient of variation; N, number of biological replicates; SP, sphingolipid.
The MALDI TOF data was compared to an untargeted LC–MS/MS lipidomic workflow. The LC–MS/MS workflow consisted of a C18 separation interfaced to a high-resolution, tandem mass spectrometer (Q-TOF). Lipid identification was achieved using chromatographic retention time, accurate mass measurement, and tandem mass spectrometry. The same samples that included the use of LiOH during the lipid extraction procedure were used for both the MALDI TOF and the LC–MS/MS experiments; yet, minimal lithium adduction was observed in the LC–MS/MS spectra. The sphingolipid adduct formation consisted of predominately protonated ([M + H]+) adducts for SM and protonated minus H2O ([M + H − H2O]+) adducts for ceramides. The lack of lithium adduction was a result of a dilution effect during the LC gradient and subsequent lack of lithium present at the point of ionization. The abundance of the identified lipids was achieved using a one-point calibration based on the known concentration of the spiked internal standard (EquiSplash). The calculated concentrations from the LC–MS/MS experiment confirmed the results of the MALDI TOF data (Figure 6).
DISCUSSION
The use of MALDI TOF MS for lipid analysis is advantageous for several notable reasons, of which the benefits are both general to the MALDI process and specific to lipid analysis. The MALDI process is fast, affords low sample amounts, is tunable by matrix selection and addition of alkali salts, and provides high-resolution mass spectra when interfaced to TOF MS. Furthermore, the MALDI process readily ionizes lipids from biological matrices, producing robust and reproducible mass spectra. Lipids show a high affinity to alkali metals during the MALDI process, forming adducts that can be heavily influenced by the choice of matrix, solvents, and presence of endogenous and exogenous salts.20,23,26
DHB is the most common matrix used for MALDI lipid analysis especially in the positive ion mode.23,26 The use of DHB in MALDI TOF MS analysis of total lipid extracts yields a high-quality mass spectrum (refer to Figure S1) dominated by abundant glycerophospholipids observed primarily as protonated ([M + H]+) and sodiated ([M + Na]+) adducts. Less abundant adducts such as [M + K]+, [M − H + 2Na]+, and [M − H + Na + K]+ are commonly observed as well. The presence of a lipid ion series consisting of multiple alkali adducts results in a complex mass spectrum where distinguishing between adducts complicates spectral interpretation and impacts sensitivity by spreading the analyte signal across multiple adducts. The formation of multiple adducts is not unique to DHB, and the use of a specific matrix to influence adduct formation to bias analyte ionization has been previously reported.26
The use of THAP, typically reserved for carbohydrate and nucleic acid MALDI analysis,39,40 has been used sparingly for lipid MALDI analysis.32 THAP is considered a “cold” matrix and shown to have strong cationization properties.32,41,42 In comparison to DHB, the use of THAP as the MALDI matrix for lipid analysis results in a more diverse array of cationization as evident by a greater percentage of sodiated and potassiated adducts compared to protonation (Figure S2). THAP, as a MALDI matrix, has also been shown to exhibit a higher salt concentration tolerance and is amenable to adduct consolidation via the use of lithium. The preferable formation of [analyte + Li]+ over [analyte + H]+ in the presence of THAP + Li has been previously rationalized by the considerably lower binding energy of Li+ to THAP compared to H+ to THAP.31 In effect, the higher dissociation potential of [THAP + Li]+ enables excess Li+ and favorably promotes lithium adduct formation during the MALDI process. The use of THAP as a MALDI matrix combined with the addition of lithium was shown to be advantageous for the selective detection of most lipid classes from total lipid extracts and complex phospholipid mixtures.32
The use of MALDI TOF MS for sphingolipid detection from total lipid extracts has received less attention when compared to electrospray ionization (ESI) MS.43-48 Sphingolipid detection is complicated by the relative low abundance of sphingolipids especially in comparison to high-abundance, favorably ionized glycerophospholipids.12,49 The few reports that have used MALDI for sphingolipid analysis have incorporated a chemical and/or enzymatic hydrolysis step prior to sample analysis. The chemical hydrolysis involved using sodium or potassium hydroxide, under mild basic conditions, to effectively cleave ester-linked acyl chains while preserving amide-linked acyl lipids. This process served to enrich the sample for sphingolipid detection. Of note, the use of alkaline (mild base) hydrolysis is a common technique for LC–MS/MS analysis of sphingolipids and does not result in degradation or unwanted breakdown products of the total lipid extracts.10,13 Our use of mild base hydrolysis was consistent with literature where we observed efficient hydrolysis of glycerol-based lipids and nonobservable degradation of sphingolipids. Alternatively, the Han lab has published a series of papers describing the use of lithium methoxide (referred to as alkaline methanolysis) for mild base hydrolysis to effectively enrich for sphingolipid detection using shotgun lipidomics via ESI-MS/MS.12,17,50 The advantage of the alkaline methanolysis over alkaline hydrolysis was the formation of fatty acid methyl esters upon hydrolysis with methoxide. The fatty acid methyl esters were then removed via repeated organic partitioning with hexane. Moreover, the infusion experiments were carried out with the addition of limited lithium hydroxide to promote lithium adduct formation. Although alkaline methanolysis has been shown to be an effective strategy in shotgun ESI-MS/MS lipidomics, its application to MALDI TOF MS was limited due to the increased solvent extraction steps’ which in turn greatly extended sample preparation time, yielded differential partitioning of ceramide (in hexane extraction), and failed to preserve lithium during the extraction process (data not shown). These side effects of lithium methanolysis negated the benefits of our developed lithium-facilitated MALDI TOF MS analysis of sphingolipids.
One potential drawback to using mild base hydrolysis is that it is an irreversible chemical reaction. The analysis of intact glycerolipids and glycerophospholipids is not possible after alkaline hydrolysis. However, the total lipid extraction and mild base hydrolysis are two separate procedures. Therefore, prior to mild base hydrolysis, one could aliquot a portion of the lipid extract for a global lipidomics approach and still proceed with mild base hydrolysis for sphingolipid analysis.
The interaction of alkali cations with amide and ester functional groups is well-established.51,52 Lithium cations more strongly interact with amides compared to sodium and potassium cations. In addition, the Li + amide interaction is energetically more favorable to the Li + ester interaction. This data robustly supports the aforementioned experimental lipidomic data highlighting the advantages of lithium adduction during mass spectrometry analysis of sphingolipids. Our newly developed sample preparation procedure that incorporated lithium into the base hydrolysis step and preserved its presence throughout the extraction/hydrolysis procedure ensured excess lithium during the MALDI process. This allowed us to take advantage of THAP’s propensity to produce lithiated adducts and the favorable energetics of the Li +amide functional group. The end result was efficient detection of sphingomyelin, ceramide, and hexosylceramide from biofluids and tissue using MALDI TOF MS. The inclusion of an internal standard mixture provided a means for the calculation of sphingolipid abundance relative to the spiked internal standard concentration as commonly done with untargeted lipidomic workflows.53 The calculation of sphingolipid abundance was further enhanced by the reduced spectral complexity of the lithium adduct consolidation, where the presence of only one adduct ([M + Li]+) simplifies quantitation.
Our innovative sample preparation and analysis procedure was applied to the analysis of sphingolipids from liver tissue excised from low- and high-fat-fed mice. Our developed workflow enabled us to determine sphingomyelin and ceramide abundance from liver tissue and assess differential expression between a low- and high-fat-diet mouse model. The elevated levels of sphingomyelin and ceramide in the mouse obesity model were confirmed by LC–MS/MS-based lipidomics54 and were consistent with the literature.55-57 The MALDI TOF MS platform provided a rapid means to profile sphingomyelin and ceramide from a biologically relevant tissue matrix. Our data indicates that the use of LiOH combined with THAP for MALDI TOF analysis is a robust and efficient analytical tool for sphingolipid detection. Of note, as with other untargeted lipidomic methods (e.g., LC–MS/MS), our LiOH–THAP MALDI method does not provide full or absolute quantitation of sphingolipids. Rather, it is best suited for rapid profiling of sphingolipids where abundance is most meaningful to determine differential expression between groups.
The comparative use of low- and high-fat diets is an important mouse model for studying the significant public health concern of obesity.58 Obesity is a major contributor of health outcomes by exacerbating other chronic diseases such as cardiovascular diseases, type 2 diabetes, certain types of cancers, and in some cases viral infections.59-62 The obesity rates in the United States are over 40% for adults and near 20% for kids.63,64 The primary driver of obesity in the US is the Western diet, which is relatively high in fat content. Thus, the use of animal models that comparatively utilize low- and high-fat diets is an important resource for gaining mechanistic insight into the pathophysiology of obesity-related diseases.
A promising avenue for pursing molecular insight into disease is via the analysis of sphingolipids from biologically relevant tissue and biofluids. Sphingolipids are not only important components of cellular membranes, conferring critical biophysical properties, but also are intimately involved in cellular signaling and regulatory functions.3 Sphingolipid metabolism is a tightly regulated cellular process, and subsequent disruption of sphingolipid homeostasis leads to changes in individual sphingolipid abundance.4 High-fat diets, which are associated with nutritional overload, trigger changes in energy metabolism, including sphingolipid abundance, and impair cellular homeostasis and function.58 A number of sphingolipids (e.g., ceramide and sphingomyelin) are differentially expressed both at the tissue and plasma level in rodent high-fat-diet models.55,57 Furthermore, sphingolipid abundance can be elevated and/or repressed via specific targeting of sphingolipid enzymes. For example, overexpression of the liver specific sphingomyelinase synthase 2 (SMS2) in mice on a high-fat diet showed elevated plasma sphingomyelin.65 Conversely, SMS2 knockout mice on a high-fat diet showed decreased plasma sphingomyelin levels.65 Furthermore, SM and ceramide are differentially expressed at the tissue level for liver, adipose, skeletal muscle, and heart in a variety of high-fat-diet rodent models.66-69 This data suggests that sphingolipid metabolism is impacted from the deleterious effects of high-fat diets and detection of individual sphingolipids from tissue, and plasma offers unique insight into the pathobiology of obesity induced by a high-fat diet. Therefore, the development of an analytical workflow that specifically targets sphingolipids that are readily detected from biological matrices is a major contribution for assessing the importance of sphingolipid metabolism not only in obesity as demonstrated herein but also in other disease conditions as well.
CONCLUSION
Our newly developed workflow involving an innovative sample preparation procedure combined with MALDI TOF MS analysis is uniquely suited for rapid detection of major sphingolipids where modulation of genetic, pharmacological, and/or environmental parameters can be efficiently assessed. The use of lithium-based hydrolysis, optimization of aqueous content during liquid–liquid extraction, and selection of THAP as the MALDI matrix provided selective detection of sphingolipids as lithiated adducts from total lipid extracts. This type of specialized workflow is highly suitable for not only a high-fat-induced obesity mode but can be readily applied to other model systems where sphingolipid homeostasis is disrupted by disease and/or injury (e.g., neurodegeneration, cardiovascular disease, liver injury, cancer, and viral infection). The developed MALDI TOF MS approach for sphingolipid analysis is complementary to other detection platforms and when used in conjunction with well-defined animal model systems layered with the appropriate analytical and biochemical controls is uniquely positioned to be a valuable asset in the sphingolipidomic toolbox.
Supplementary Material
Figure S1. MALDI TOF mass spectra for liver total lipid extract.
Figure S2. MALDI TOF mass spectra for liver total lipid extract from Figure S1 with zoomed m/z region.
Figure S3. MALDI TOF mass spectra for liver total lipid extract with matrix doped with lithium chloride (LiCl).
Figure S4. MALDI TOF mass spectra for ceramide standard mixture with and without LiCl.
Figure S5. MALDI TOF mass spectra for total lipid extracts of human plasma with THAP as MALDI matrix.
Figure S6. MALDI FT-ICR mass spectrum for brain total lipid extract with LiOH hydrolysis (PDF)
ACKNOWLEDGMENTS
The authors acknowledge the University of Maryland School of Pharmacy Faculty Start-up funds (J.W.J.), an American Society of Mass Spectrometry Research Award (J.W.J.), and the University of Maryland School of Pharmacy Mass Spectrometry Center (SOP1841-IQB2014) (J.W.J.). This work is also partially supported by the Joint Fund to Promote Cross-Straits Scientific and Technological Cooperation, NSFC (U1905202) (B.L.) and the 111 Project (B17018) (Z.X.).
ABBREVIATIONS
- 9-AA
9-aminoacridine
- BHT
butylated hydroxytoluene
- Cer
ceramide
- CHCA
α-cyano-4-hydroxycinnamic acid
- CHCl3
chloroform
- CV
% coefficient of variation
- DHAP
2′,4′-dihydoxyacetophenone
- DHB
2,5-dihydroxybenzoic acid
- ESI
electrospray ionization
- FT-ICR
Fourier transform ion cyclotron resonance
- GL
glycerolipid
- GP
glycerophospholipid
- HexCer
hexosylceramide
- HPLC
high-pressure liquid chromatography
- HR-MS/MS
high-resolution tandem mass spectrometry
- KOH
potassium hydroxide
- LC–MS
liquid chromatography–mass spectrometry
- LiCl
lithium chloride
- LiOH
lithium hydroxide
- LPC
lysophosphatidylcholine
- MALDI
matrix-assisted laser desorption/ionization
- MeOH
methanol
- MS
mass spectrometry
- MS/MS
tandem mass spectrometry
- MTBE
tert-butyl methyl ether
- NEDC
N-(1-naphthyl)ethylenediamine dihydrochloride
- PC
glycerophosphatidylcholine
- PE
glycerophosphatidylethanolamine
- Q-TOF
quadrupole time-of-flight
- SM
sphingomyelin
- SMS2
sphingomyelinase synthase 2
- SP
sphingolipids
- TG
triacylglycerol
- THAP
2′,4′,6′-trihydroxyacetophenone
- TLE
total lipid extract
- TOF
time-of-flight
- UHPLC
Ultrahigh-performance liquid chromatography
Footnotes
Supporting Information
The Supporting Information is available free of charge at https://pubs.acs.org/doi/10.1021/jasms.0c00322.
The authors declare no competing financial interest.
Contributor Information
Anh Tran, Department of Pharmaceutical Sciences, University of Maryland School of Pharmacy, Baltimore, Maryland 21201, United States.
Liting Wan, School of Food Science and Engineering, Guangdong Province Key Laboratory for Green Processing of Natural Products and Product Safety, South China University of Technology, Guangzhou 510640, China; Department of Microbial Pathogenesis, University of Maryland School of Dentistry, Baltimore, Maryland 21201, United States.
Zhenbo Xu, School of Food Science and Engineering, Guangdong Province Key Laboratory for Green Processing of Natural Products and Product Safety, South China University of Technology, Guangzhou 510640, China; Overseas Expertise Introduction Center for Discipline Innovation of Food Nutrition and Human Health (111 Center), Guangzhou 510640, China.
Janette M. Haro, Department of Microbial Pathogenesis, University of Maryland School of Dentistry, Baltimore, Maryland 21201, United States
Bing Li, School of Food Science and Engineering, Guangdong Province Key Laboratory for Green Processing of Natural Products and Product Safety, South China University of Technology, Guangzhou 510640, China.
Jace W. Jones, Department of Pharmaceutical Sciences, University of Maryland School of Pharmacy, Baltimore, Maryland 21201, United States.
REFERENCES
- (1).Wenk MR Lipidomics: new tools and applications. Cell 2010, 143 (6), 888–895. [DOI] [PubMed] [Google Scholar]
- (2).van Meer G; Voelker DR; Feigenson GW Membrane lipids: where they are and how they behave. Nat. Rev. Mol. Cell Biol 2008, 9 (2), 112–124. [DOI] [PMC free article] [PubMed] [Google Scholar]
- (3).Hannun YA; Obeid LM Sphingolipids and their metabolism in physiology and disease. Nat. Rev. Mol. Cell Biol 2018, 19 (3), 175–191. [DOI] [PMC free article] [PubMed] [Google Scholar]
- (4).Breslow DK; Weissman JS Membranes in balance: mechanisms of sphingolipid homeostasis. Mol. Cell 2010, 40 (2), 267–279. [DOI] [PMC free article] [PubMed] [Google Scholar]
- (5).Piccinini M; Scandroglio F; Prioni S; Buccinna B; Loberto N; Aureli M; Chigorno V; Lupino E; DeMarco G; Lomartire A; Rinaudo MT; Sonnino S; Prinetti A Deregulated sphingolipid metabolism and membrane organization in neurodegenerative disorders. Mol. Neurobiol 2010, 41 (2–3), 314–340. [DOI] [PubMed] [Google Scholar]
- (6).Kawabori M; Kacimi R; Karliner JS; Yenari MA Sphingolipids in cardiovascular and cerebrovascular systems: Pathological implications and potential therapeutic targets. World J. Cardiol 2013, 5 (4), 75–86. [DOI] [PMC free article] [PubMed] [Google Scholar]
- (7).Shah C; Yang G; Lee I; Bielawski J; Hannun YA; Samad F Protection from high fat diet-induced increase in ceramide in mice lacking plasminogen activator inhibitor 1. J. Biol. Chem 2008, 283 (20), 13538–13548. [DOI] [PMC free article] [PubMed] [Google Scholar]
- (8).Garcia-Ruiz C; Colell A; Mari M; Morales A; Calvo M; Enrich C; Fernandez-Checa JC Defective TNF-alpha-mediated hepatocellular apoptosis and liver damage in acidic sphingomyelinase knockout mice. J. Clin. Invest 2003, 111 (2), 197–208. [DOI] [PMC free article] [PubMed] [Google Scholar]
- (9).Ryland LK; Fox TE; Liu X; Loughran TP; Kester M Dysregulation of sphingolipid metabolism in cancer. Cancer Biol. Ther 2011, 11 (2), 138–149. [DOI] [PubMed] [Google Scholar]
- (10).Peng B; Weintraub ST; Coman C; Ponnaiyan S; Sharma R; Tews B; Winter D; Ahrends R A Comprehensive High-Resolution Targeted Workflow for the Deep Profiling of Sphingolipids. Anal. Chem 2017, 89 (22), 12480–12487. [DOI] [PubMed] [Google Scholar]
- (11).Wang JR; Zhang H; Yau LF; Mi JN; Lee S; Lee KC; Hu P; Liu L; Jiang ZH Improved sphingolipidomic approach based on ultra-high performance liquid chromatography and multiple mass spectrometries with application to cellular neurotoxicity. Anal. Chem 2014, 86 (12), 5688–5696. [DOI] [PubMed] [Google Scholar]
- (12).Han X; Jiang X A review of lipidomic technologies applicable to sphingolipidomics and their relevant applications. Eur. J. Lipid Sci. Technol 2009, 111 (1), 39–52. [DOI] [PMC free article] [PubMed] [Google Scholar]
- (13).Sullards MC; Allegood JC; Kelly S; Wang E; Haynes CA; Park H; Chen Y; Merrill AH Jr. Structure-specific, quantitative methods for analysis of sphingolipids by liquid chromatography-tandem mass spectrometry: “inside-out” sphingolipidomics. Methods Enzymol 2007, 432, 83–115. [DOI] [PubMed] [Google Scholar]
- (14).Saigusa D; Shiba K; Inoue A; Hama K; Okutani M; Iida N; Saito M; Suzuki K; Kaneko T; Suzuki N; Yamaguchi H; Mano N; Goto J; Hishinuma T; Aoki J; Tomioka Y Simultaneous quantitation of sphingoid bases and their phosphates in biological samples by liquid chromatography/electrospray ionization tandem mass spectrometry. Anal. Bioanal Chem 2012, 403 (7), 1897–1905. [DOI] [PubMed] [Google Scholar]
- (15).Ryan E; Nguyen CQN; Shiea C; Reid GE Detailed Structural Characterization of Sphingolipids via 193 nm Ultraviolet Photodissociation and Ultra High Resolution Tandem Mass Spectrometry. J. Am. Soc. Mass Spectrom 2017, 28 (7), 1406–1419. [DOI] [PubMed] [Google Scholar]
- (16).Züllig T; Trötzmüller M; Köfeler HC Lipidomics from sample preparation to data analysis: a primer. Anal. Bioanal. Chem 2020, 412 (10), 2191–2209. [DOI] [PMC free article] [PubMed] [Google Scholar]
- (17).Jiang X; Cheng H; Yang K; Gross RW; Han X Alkaline methanolysis of lipid extracts extends shotgun lipidomics analyses to the low-abundance regime of cellular sphingolipids. Anal. Biochem 2007, 371 (2), 135–145. [DOI] [PMC free article] [PubMed] [Google Scholar]
- (18).Haynes CA; Allegood JC; Park H; Sullards MC Sphingolipidomics: methods for the comprehensive analysis of sphingolipids. J. Chromatogr. B: Anal. Technol. Biomed. Life Sci 2009, 877 (26), 2696–2708. [DOI] [PMC free article] [PubMed] [Google Scholar]
- (19).Constantopoulos TL; Jackson GS; Enke CG Effects of salt concentration on analyte response using electrospray ionization mass spectrometry. J. Am. Soc. Mass Spectrom 1999, 10 (7), 625–634. [DOI] [PubMed] [Google Scholar]
- (20).Griffiths RL; Bunch J A survey of useful salt additives in matrix-assisted laser desorption/ionization mass spectrometry and tandem mass spectrometry of lipids: introducing nitrates for improved analysis. Rapid Commun. Mass Spectrom 2012, 26 (13), 1557–1566. [DOI] [PubMed] [Google Scholar]
- (21).Hsu FF; Turk J Characterization of phosphatidylethanolamine as a lithiated adduct by triple quadrupole tandem mass spectrometry with electrospray ionization. J. Mass Spectrom 2000, 35 (5), 595–606. [DOI] [PubMed] [Google Scholar]
- (22).Han X; Gross RW Quantitative analysis and molecular species fingerprinting of triacylglyceride molecular species directly from lipid extracts of biological samples by electrospray ionization tandem mass spectrometry. Anal. Biochem 2001, 295 (1), 88–100. [DOI] [PubMed] [Google Scholar]
- (23).Fuchs B; Süss R; Schiller J An update of MALDI-TOF mass spectrometry in lipid research. Prog. Lipid Res 2010, 49 (4), 450–475. [DOI] [PubMed] [Google Scholar]
- (24).Hillenkamp F; Peter-Katalinić J MALDI MS: a practical guide to instrumentation, methods, and applications, 2nd ed.; Wiley, 2013. [Google Scholar]
- (25).Schiller J; Süss R; Arnhold J; Fuchs B; Lessig J; Müller M; Petković M; Spalteholz H; Zschörnig O; Arnold K Matrix-assisted laser desorption and ionization time-of-flight (MALDI-TOF) mass spectrometry in lipid and phospholipid research. Prog. Lipid Res 2004, 43 (5), 449–488. [DOI] [PubMed] [Google Scholar]
- (26).Leopold J; Popkova Y; Engel KM; Schiller J Recent Developments of Useful MALDI Matrices for the Mass Spectrometric Characterization of Lipids. Biomolecules 2018, 8 (4), 173. [DOI] [PMC free article] [PubMed] [Google Scholar]
- (27).Calvano CD; Monopoli A; Cataldi TRI; Palmisano F MALDI matrices for low molecular weight compounds: an endless story? Anal. Bioanal. Chem 2018, 410 (17), 4015–4038. [DOI] [PubMed] [Google Scholar]
- (28).Lehmann K Endogenous lithium levels. Pharmacopsychiatry 1994, 27 (3), 130–132. [DOI] [PubMed] [Google Scholar]
- (29).Keller BO; Sui J; Young AB; Whittal RM Interferences and contaminants encountered in modern mass spectrometry. Anal. Chim. Acta 2008, 627 (1), 71–81. [DOI] [PubMed] [Google Scholar]
- (30).Zhang J; Ha T-K; Knochenmuss R; Zenobi R Theoretical Calculation of Gas-Phase Sodium Binding Energies of Common MALDI Matrices. J. Phys. Chem. A 2002, 106 (28), 6610–6617. [Google Scholar]
- (31).Suzuki J; Sato A; Yamamoto R; Asano T; Shimosato T; Shima H; Kondo JN; Yamashita K.-i.; Hashimoto K; Fujino T Matrix-assisted laser desorption ionization using lithium-substituted mordenite surface. Chem. Phys. Lett 2012, 546, 159–163. [Google Scholar]
- (32).Stübiger G; Belgacem O Analysis of lipids using 2,4,6-trihydroxyacetophenone as a matrix for MALDI mass spectrometry. Anal. Chem 2007, 79 (8), 3206–3213. [DOI] [PubMed] [Google Scholar]
- (33).Wang C; Wang M; Han X Applications of mass spectrometry for cellular lipid analysis. Mol. BioSyst 2015, 11 (3), 698–713. [DOI] [PMC free article] [PubMed] [Google Scholar]
- (34).Hsu FF; Turk J Structural determination of sphingomyelin by tandem mass spectrometry with electrospray ionization. J. Am. Soc. Mass Spectrom 2000, 11 (5), 437–449. [DOI] [PubMed] [Google Scholar]
- (35).Matyash V; Liebisch G; Kurzchalia TV; Shevchenko A; Schwudke D Lipid extraction by methyl-tert-butyl ether for high-throughput lipidomics. J. Lipid Res 2008, 49 (5), 1137–1146. [DOI] [PMC free article] [PubMed] [Google Scholar]
- (36).McLafferty FW; Turecek F Interpretation of mass spectra, 4th ed.; University Science Books: Sausalito, CA, 1993. [Google Scholar]
- (37).Gault CR; Obeid LM; Hannun YA An overview of sphingolipid metabolism: from synthesis to breakdown. Adv. Exp. Med. Biol 2010, 688, 1–23. [DOI] [PMC free article] [PubMed] [Google Scholar]
- (38).Merrill AH Jr.; Sullards MC Opinion article on lipidomics: Inherent challenges of lipidomic analysis of sphingolipids. Biochim. Biophys. Acta, Mol. Cell Biol. Lipids 2017, 1862 (8), 774–776. [DOI] [PMC free article] [PubMed] [Google Scholar]
- (39).Harvey DJ Matrix-assisted laser desorption/ionization mass spectrometry of carbohydrates. Mass Spectrom. Rev 1999, 18 (6), 349–450. [DOI] [PubMed] [Google Scholar]
- (40).Kühn-Hölsken E; Lenz C; Sander B; Lührmann R; Urlaub H Complete MALDI-ToF MS analysis of cross-linked peptide-RNA oligonucleotides derived from nonlabeled UV-irradiated ribonucleoprotein particles. RNA 2005, 11 (12), 1915–1930. [DOI] [PMC free article] [PubMed] [Google Scholar]
- (41).Schulz E; Karas M; Rosu F; Gabelica V Influence of the matrix on analyte fragmentation in atmospheric pressure MALDI. J. Am. Soc. Mass Spectrom 2006, 17 (7), 1005–1013. [DOI] [PubMed] [Google Scholar]
- (42).Lavanant H; Lange C Sodium-tolerant matrix for matrix-assisted laser desorption/ionization mass spectrometry and post-source decay of oligonucleotides. Rapid Commun. Mass Spectrom 2002, 16 (20), 1928–1933. [DOI] [PubMed] [Google Scholar]
- (43).Fujiwaki T; Tasaka M; Yamaguchi S Quantitative evaluation of sphingomyelin and glucosylceramide using matrix-assisted laser desorption ionization time-of-flight mass spectrometry with sphingosylphosphorylcholine as an internal standard. Practical application to tissues from patients with Niemann-Pick disease types A and C, and Gaucher disease. J. Chromatogr. B: Anal. Technol. Biomed. Life Sci 2008, 870 (2), 170–176. [DOI] [PubMed] [Google Scholar]
- (44).Hori A; Yamashita M; Yamaura M; Hongo M; Honda T; Hidaka H Rapid quantitative analysis of human serum sphingomyelin species using MALDI-TOF mass spectrometry with lipid hydrolase treatment. Clin. Chim. Acta 2016, 453, 95–99. [DOI] [PubMed] [Google Scholar]
- (45).Ma X; Liu G; Wang S; Chen Z; Lai M; Liu Z; Yang J Evaluation of sphingolipids changes in brain tissues of rats with pentylenetetrazol-induced kindled seizures using MALDI-TOF-MS. J. Chromatogr. B: Anal. Technol. Biomed. Life Sci 2007, 859 (2), 170–177. [DOI] [PubMed] [Google Scholar]
- (46).Mika A; Gołebiowski M; Szafranek J; Rokicki J; Stepnowski P Identification of lipids in the cuticle of the parasitic nematode Anisakis simplex and the somatic tissues of the Atlantic cod Gadus morhua. Exp. Parasitol 2010, 124 (3), 334–340. [DOI] [PubMed] [Google Scholar]
- (47).Pyttel S; Zschörnig K; Nimptsch A; Paasch U; Schiller J Enhanced lysophosphatidylcholine and sphingomyelin contents are characteristic of spermatozoa from obese men-A MALDI mass spectrometric study. Chem. Rhys. Lipids 2012, 165 (8), 861–865. [DOI] [PubMed] [Google Scholar]
- (48).Qu S; Barrett-Wilt G; Fonseca LM; Rankin SA A profile of sphingolipids and related compounds tentatively identified in yak milk. J. Dairy Sci 2016, 99 (7), 5083–5092. [DOI] [PubMed] [Google Scholar]
- (49).Merrill AH Jr.; Sullards MC; Allegood JC; Kelly S; Wang E Sphingolipidomics: high-throughput, structure-specific, and quantitative analysis of sphingolipids by liquid chromatography tandem mass spectrometry. Methods 2005, 36 (2), 207–224. [DOI] [PubMed] [Google Scholar]
- (50).Jiang X; Han X Characterization and direct quantitation of sphingoid base-1-phosphates from lipid extracts: a shotgun lipidomics approach. J. Lipid Res 2006, 47 (8), 1865–1873. [DOI] [PMC free article] [PubMed] [Google Scholar]
- (51).Balasubramanian D; Misra BC Relative affinities of alkali metal ions to the ligands in ionophores. FEBS Lett. 1974, 41 (1), 78–80. [DOI] [PubMed] [Google Scholar]
- (52).Balasubramanian D; Shaikh R On the interaction of lithium salts with model amides. Biopolymers 1973, 12 (7), 1639–1650. [Google Scholar]
- (53).Holčapek M; Liebisch G; Ekroos K Lipidomic Analysis. Anal. Chem 2018, 90 (7), 4249–4257. [DOI] [PubMed] [Google Scholar]
- (54).Koelmel JP; Li X; Stow SM; Sartain MJ; Murali A; Kemperman R; Tsugawa H; Takahashi M; Vasiliou V; Bowden JA; Yost RA; Garrett TJ; Kitagawa N Lipid Annotator: Towards Accurate Annotation in Non-Targeted Liquid Chromatography High-Resolution Tandem Mass Spectrometry (LC-HRMS/MS) Lipidomics Using A Rapid and User-Friendly Software. Metabolites 2020, 10 (3), 101. [DOI] [PMC free article] [PubMed] [Google Scholar]
- (55).Kurek K; Piotrowska DM; Wiesiołek-Kurek P; Łukaszuk A; Chabowski A; Górski J; Zendzian-Piotrowska M Inhibition of ceramide de novo synthesis reduces liver lipid accumulation in rats with nonalcoholic fatty liver disease. Liver Int. 2014, 34 (7), 1074–1083. [DOI] [PubMed] [Google Scholar]
- (56).Li Z; Zhang H; Liu J; Liang CP; Li Y; Li Y; Teitelman G; Beyer T; Bui HH; Peake DA; Zhang Y; Sanders PE; Kuo MS; Park TS; Cao G; Jiang XC Reducing plasma membrane sphingomyelin increases insulin sensitivity. Mol. Cell. Biol 2011, 31 (20), 4205–4218. [DOI] [PMC free article] [PubMed] [Google Scholar]
- (57).Chocian G; Chabowski A; Zendzian-Piotrowska M; Harasim E; Łukaszuk B; Górski J High fat diet induces ceramide and sphingomyelin formation in rat’s liver nuclei. Mol. Cell. Biochem 2010, 340 (1–2), 125–131. [DOI] [PubMed] [Google Scholar]
- (58).Choi S; Snider AJ Sphingolipids in High Fat Diet and Obesity-Related Diseases. Mediators Inflammation 2015, 2015, 520618. [DOI] [PMC free article] [PubMed] [Google Scholar]
- (59).Honce R; Schultz-Cherry S Impact of Obesity on Influenza A Virus Pathogenesis, Immune Response, and Evolution. Front. Immunol 2019, 10, 1071. [DOI] [PMC free article] [PubMed] [Google Scholar]
- (60).Stone TW; McPherson M; Gail Darlington L Obesity and Cancer: Existing and New Hypotheses for a Causal Connection. EBioMedicine 2018, 30, 14–28. [DOI] [PMC free article] [PubMed] [Google Scholar]
- (61).Ortega FB; Lavie CJ; Blair SN Obesity and Cardiovascular Disease. Circ. Res 2016, 118 (11), 1752–1770. [DOI] [PubMed] [Google Scholar]
- (62).Al-Goblan AS; Al-Alfi MA; Khan MZ Mechanism linking diabetes mellitus and obesity. Diabetes, Metab. Syndr. Obes.: Targets Ther 2014, 7, 587–591. [DOI] [PMC free article] [PubMed] [Google Scholar]
- (63).Hales CM; Carroll MD; Fryar CD; Ogden CL Prevalence of Obesity and Severe Obesity Among Adults: United States; 2017–2018; NCHS Data Brief, No. 360; U.S. Dept. of Health and Human Services, February 2020. [PubMed] [Google Scholar]
- (64).Hales CM; Carroll MD; Fryar CD; Ogden CL Prevalence of Obesity Among Adults and Youth: United States, 2015–2016; NCHS Data Brief, No. 288; U.S. Dept. of Health and Human Services, October 2017. [PubMed] [Google Scholar]
- (65).Liu J; Zhang H; Li Z; Hailemariam TK; Chakraborty M; Jiang K; Qiu D; Bui HH; Peake DA; Kuo MS; Wadgaonkar R; Cao G; Jiang XC Sphingomyelin synthase 2 is one of the determinants for plasma and liver sphingomyelin levels in mice. Arterioscler., Thromb., Vasc. Biol 2009, 29 (6), 850–856. [DOI] [PMC free article] [PubMed] [Google Scholar]
- (66).Eisinger K; Krautbauer S; Hebel T; Schmitz G; Aslanidis C; Liebisch G; Buechler C Lipidomic analysis of the liver from high-fat diet induced obese mice identifies changes in multiple lipid classes. Exp. Mol. Pathol 2014, 97 (1), 37–43. [DOI] [PubMed] [Google Scholar]
- (67).Turner N; Kowalski GM; Leslie SJ; Risis S; Yang C; Lee-Young RS; Babb JR; Meikle PJ; Lancaster GI; Henstridge DC; White PJ; Kraegen EW; Marette A; Cooney GJ; Febbraio MA; Bruce CR Distinct patterns of tissue-specific lipid accumulation during the induction of insulin resistance in mice by high-fat feeding. Diabetologia 2013, 56 (7), 1638–1648. [DOI] [PubMed] [Google Scholar]
- (68).Park M; Wu D; Park T; Choi CS; Li RK; Cheng KK; Xu A; Sweeney G APPL1 transgenic mice are protected from high-fat diet-induced cardiac dysfunction. Am. J. Physiol Endocrinol Metab 2013, 305 (7), E795–804. [DOI] [PubMed] [Google Scholar]
- (69).Liu Y; Turdi S; Park T; Morris NJ; Deshaies Y; Xu A; Sweeney G Adiponectin corrects high-fat diet-induced disturbances in muscle metabolomic profile and whole-body glucose homeostasis. Diabetes 2013, 62 (3), 743–752. [DOI] [PMC free article] [PubMed] [Google Scholar]
Associated Data
This section collects any data citations, data availability statements, or supplementary materials included in this article.
Supplementary Materials
Figure S1. MALDI TOF mass spectra for liver total lipid extract.
Figure S2. MALDI TOF mass spectra for liver total lipid extract from Figure S1 with zoomed m/z region.
Figure S3. MALDI TOF mass spectra for liver total lipid extract with matrix doped with lithium chloride (LiCl).
Figure S4. MALDI TOF mass spectra for ceramide standard mixture with and without LiCl.
Figure S5. MALDI TOF mass spectra for total lipid extracts of human plasma with THAP as MALDI matrix.
Figure S6. MALDI FT-ICR mass spectrum for brain total lipid extract with LiOH hydrolysis (PDF)