

Abstract
Purpose/Aim:
The amount of membrane-bound α-crystallin increases significantly with age and cataract formation, accompanied by a corresponding decline in the level of α-crystallin in the lens cytoplasm. The purpose of this research is to evaluate the binding affinity of α-crystallin to the phospholipid membranes as well as the physical properties of the membranes after α-crystallin binding.
Materials and Methods:
The continuous wave and saturation recovery electron paramagnetic resonance (EPR) methods were used to obtain the information about the binding affinity and the physical properties of the membrane. In this approach, the cholesterol analogue spin label CSL was incorporated in the membrane and the binding of α-crystallin to the membrane was monitored by this spin label. Small uni-lamellar vesicles were prepared from 1-palmitoyl-2-oleoylphosphatidylcholine (POPC) with 1% of CSL. The measured membrane properties included the mobility parameter, fluidity and the oxygen transport parameter.
Results:
The binding affinity (Ka) of α-crystallin with the POPC membrane was estimated to be 4.9 ± 2.4 μM−1. The profiles of mobility parameter showed that mobility parameter decreased with an increase in the binding of α-crystallin. The profiles of spin-lattice relaxation rate showed that the spin-lattice relaxation rate decreased with an increase in binding. These results show that the binding of α-crystallin makes the membrane more immobilized near the head group region of the phospholipids. Furthermore, the profiles of the oxygen transport parameter indicated that the oxygen transport parameter decreased with an increase of binding, indicating the binding of α-crystallin forms a barrier for the passage of non-polar molecules which supports the barrier hypothesis.
Conclusions:
The binding of α-crystallin to the membrane alters the physical properties of the membranes, and this plays a significant role in modulating the integrity of the membranes. EPR techniques are useful in studying α-crystallin membrane interactions.
Keywords: α-crystallin, phospholipid membrane, EPR, binding, fluidity
1. Introduction
Epidemiological studies have shown that cataract development is a multifactorial process involving genetic and environmental factors1,2. It has been reported that ionizing radiation (IR) exposure is an important environmental factor in cataract development3. IR generates free radical and induces oxidative stress that damages lens protein resulting in protein aggregation, precipitation, and loss of lens transparency3. Oxidation of lipids in the membrane via oxidative stress leads to the disruptions of membrane structure3. In addition to genetics, factors that can cause cataract formation are age4,5, vitrectomy6,7, and hyperbaric oxygen treatment8–10. It is widely postulated that cataract formation results from any type of oxidative stress that perturbs the structure of lens fiber-cell membranes, disrupts the function of intrinsic proteins, and promotes the aggregation of cytosolic proteins, crystallins4,10,11. Aggregation of crystallins is the significant factor in cataract formation12,13. It is believed that the associations between fiber-cell plasma membrane and crystallins are an important phenomenon in the aging lens by which crystallin insolubilization occurs14–16. It has been reported that all water insoluble crystallins in aged human lenses are membrane bound17.
The three classes of crystallins are α-, x-, and γ, which account for nearly 90% of the lens proteins18–20. Among them, α-crystallin comprises up to 40% of total lens proteins18,21 and has the strongest affinity toward lens membranes22–27. Several reports indicate that levels of α-crystallin in the lens cytoplasm decline with age and cataract progression, and are accompanied by a corresponding increase in the amount of membrane-bound α-crystallin15,28,29. A recent clinical study showed that the level of the unbound form of α-crystallin decreased with cataract progression29. The association of α-crystallin with the membrane is accompanied by increased light scattering. It was shown that during aging, and in the case of cataract formation, the association of α-crystallin with membrane and light scattering increases22,30,31. It has also been hypothesized that the binding of α-crystallin to the fiber cell plasma membrane contributes to the development of nuclear cataracts by occluding membrane pores and forming a barrier to diffusion5,14,32.
Several studies have been performed to investigate the binding of α-crystallin to lens membrane22–28,33–38. It has also been proposed earlier that lipid moiety alone of the lens membrane may be responsible for α-crystallin membrane binding34,36,38,39. However, the mechanism by which α-crystallin associates with membrane’s lipid is unclear. Here we have developed the Electron Paramagnetic Resonance (EPR) approach to investigate the binding of α-crystallin to pure phospholipid membrane (protein free membrane). The EPR approach allows us to estimate the binding affinity (Ka) as well as the physical properties of membrane after the binding of α-crystallin. The physical properties of membrane studied here include mobility parameter, fluidity parameter and the oxygen transport parameter (OTP). The EPR approach uses cholesterol analog spin label (CSL) near the membrane surface which gives us the unique opportunity to obtain the information about the membrane surface occupied by α-crystallin. Here the lipid membrane chosen for the study is phosphatidylcholine (PC) membrane because PC is the most abundant phospholipid (PL) in eye lenses of short-life-span animals40.
2. Materials and Methods
2.1. Materials
One-palmitoy-2-oleoyl-sn-glycero-3-phosphatidylcholine (POPC) was purchased from Avanti Polar Lipids, Inc. (Alabaster, AL, USA). Cholesterol analog cholestane spin label (CSL) was obtained from Molecular Probes (Eugene, OR, USA). We have chosen CSL spin-label in the proposed research because the nitroxide moiety of CSL is close to the membrane surface and it was reported earlier by another research group34 that the headgroup region of the membrane becomes less mobile with binding of α-crystallin. Bovine eye lens α-crystallin and other chemicals (of at least reagent grade) were purchased from Sigma-Aldrich (St. Louis, MO, USA).The α-crystallin (C4163) purchased from Sigma-Aldrich was used without any further purification. The molecular weight of α-crystallin was estimated to be 20.35 kDa based on the information provided by Sigma-Aldrich via phone (i.e, αA = 19.8 kDa, αB =22 kDa, αA:αB = 3:1). As estimated by other research groups41,42, the isolation of α-crystallin from native bovine eye lens consists of about 6% impurities. The possibility of the binding of impurities to the membrane cannot be discarded; however, with α-crystallin being the most abundant fraction, the change in the lipid organization and dynamics sensed by CSL in the membrane is mostly due to α-crystallin. The possible effect of impurities on Ka and membrane properties can be eliminated by using recombinant pure α-crystallin. We plan to use recombinant pure α-crystallin in our future studies, as used by other research groups35,43.
2.2. Preparation of Small Unilamellar Vesicles (SUVs)
The small unilamellar vesicles (SUVs) were prepared by sonication of the dispersion of large multilamellar vesicle (LMV) suspensions44 made of POPC containing 1 mol % of CSL. Chloroform solutions of POPC and CSL were mixed to attain the desired spin-label concentration. A chloroform solution with a final volume of 75 μL was added to the test tube of 1.2 mL of Hepes buffer (10 mM Hepes, 100 mM NaCl, pH=7.4) at room temperature. LMVs were obtained by the standard rapid solvent exchange method45,46. Sonication was performed using a probe-tip sonicator (Fisher Scientific, Model 550). Five to seven 15 s sonication cycles followed by 15 s cooling in ice were sufficient to transfer the milky suspension of LMVs into a slightly hazy transparent solution. Sonication produces SUVs approximately 30 nm in diameter44. The final concentration of POPC was 25 mg/mL. 3.54 mg/mL stock of α-crystallin was prepared in a Hepes buffer.
2.3. α-Crystallin Membrane Interaction
The continuous wave (CW) EPR and saturation recovery (SR) EPR methods are powerful tools that can provide a great deal of information on the binding of α-crystallin with membrane. In this approach, the cholesterol analogue CSL is incorporated in the membrane and the binding of α-crystallin to the membrane is monitored by this spin label. Fig. 1 is a schematic drawing of an α-crystallin bound membrane along with a CSL. Here, the membrane is the SUVs with only the outer membrane surface exposed to α-crystallin. The cholesterol analogue spin label (CSL, see Fig. 1 for its location in the membrane) is incorporated in the membrane, and the EPR signal coming from CSL provides information about the percentage of the membrane surface occupied by α-crystallin. The EPR signal from CSL also gives the information about the change in the physical properties (mobility, fluidity and the oxygen transport parameter) of membrane after the binding of α-crystallin.
Figure 1.
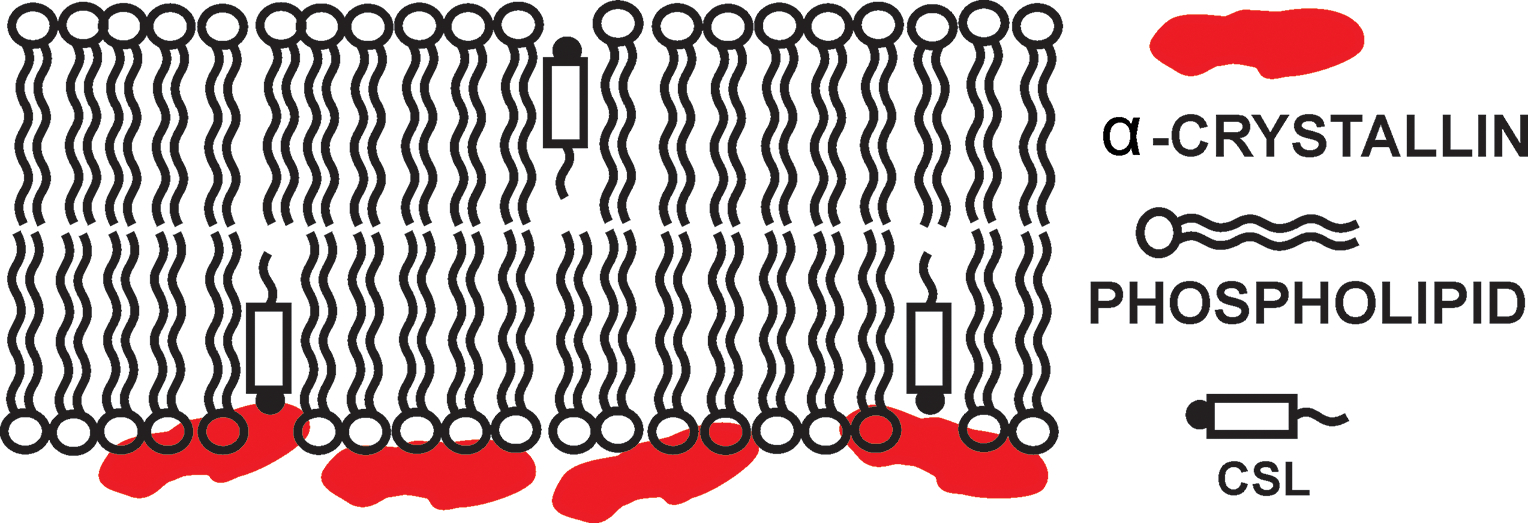
Schematic drawing showing the binding of α- crystallin in the membrane along with the approximate locations of cholesterol analogue spin label (CSL) in the membrane. The nitroxide moieties of spin labels are indicated by black dots.
2.4. Preparation of Samples for EPR measurements
A fixed concentration of POPC (9.4 mM) with varying concentrations of α-crystallin (0 – 53μM) were mixed in total volume of 70 μL and incubated for 16 h at 37°C with gentle shaking in a Corning LSE benchtop shaking incubator (Corning. NY, USA). The sample was then transferred to a 0.6mm i.d. capillary made of gas-permeable methylpentene polymer (TPX)47, which was used for CW and SR EPR measurements. To measure time course of binding, both the concentration of POPC (9.4 mM) and α-crystallin (35 μM) were fixed and incubated with gentle shaking at 37°C with varying times. The samples at different time intervals were then transferred to TPX capillary for CW EPR measurements. All CW and SR EPR measurements were performed at 37 °C.
2.5. EPR measurements
CW EPR spectra were recorded with a Bruker EMX spectrometer equipped with temperature-control accessories. All spectra were obtained with modulation amplitude of 1.0 G and incident microwave power of 5.0 mW. Samples were thoroughly deoxygenated, yielding correct EPR lineshapes.
SR measurements were performed at X-band on a home-built spectrometer with major hardware improvements and equipped with a loop-gap resonator (LGR)48. One of the improvements was that the pump arm power amplifier was replaced with a new power amplifier to provide more saturating pump power to the sample. With this upgrade to the equipment, the pump arm in the SR system is capable of delivering a pulse width as narrow as 10 ns at a 1 W power level to the LGR48. We used the maximal available pump power of 1 W for our measurements. This high pump power is especially significant when the experiment is done with the samples equilibrated with air (30% and 50% air in the current project). Equilibration with air shortened the spin-lattice relaxation time (T1) value, and the availability of this level of pump power ensures saturation of the sample with the narrow pump pulse widths needed to measure the shorter T1s values accurately. T1s of spin label were determined by analyzing the SR signal of the central line obtained by short-pulse SR EPR at X-band49,50. The concentration of oxygen in the sample was controlled by equilibration with the same gas that was used for the temperature control (i.e., a controlled mixture of nitrogen and dry air adjusted with flow meters [Matheson Gas Products, model 7631H-604])47. Typically, 105–106 decays were acquired with 2048 data points on each decay with sampling interval 5 ns or 10 ns. The total accumulation time was typically 2–5 min. SR signals were fitted by single- and double exponential functions. Single exponentials fits were sufficient.
2.6. Theory outline for evaluation of OTP
The OTP, W(x), was introduced as a convenient quantitative measure of the rate of the collision between the spin label and molecular oxygen by Kusumi et al.51 as
| (1) |
where the T1s are the spin-lattice relaxation times of the nitroxides in samples equilibrated with atmospheric air and nitrogen, respectively. The collision rate is also proportional to the local oxygen concentration C(x) and the local oxygen-diffusion coefficient D(x) at a “depth” x in the membrane that is in equilibrium with atmospheric air:
| (2) |
where ro is the interaction distance between oxygen and the nitroxide moiety of the spin label (4.5 Å)52 and p is the probability that an observable event occurs when a collision occurs (A is remarkably independent of the hydrophobicity and viscosity of the solvent and of spin label species53–55). Kusumi et al.51 concluded that the OTP is a useful monitor of membrane fluidity that reports on translational diffusion of small molecules. To obtain the OTP, in principle, two SR measurements could be performed for the sample equilibrated with nitrogen and air (see Eq. [1]). However, the T1 for samples equilibrated with air is too short to be measured with great accuracy. Thus, SR measurements were carried out as a function of oxygen concentration i.e. percent air up to 50% air and extrapolation to 100% air was performed to obtain the final values of the OTP. The SR measurement was performed at 0 % air (100 % N2), 30 % air, 50 % air and T1−1 was plotted as function of % air to estimate the OTP as shown in Fig. 8B. This approach was used earlier to estimate OTP in model and biological membranes49,56,57.
Figure 8.

A) Profiles of the T1−1 (the spin-lattice relaxation rate) obtained at 37 °C with CSL spin label in the phospholipid membrane incubated with varying amount of α-crystallin. B) T1−1 for CSL in phospholipid membrane incubated with 0 μM α-crystallin plotted as % air in the equilibrating gas mixture. The plot shows a linear dependence up to 50% air, and extrapolation of linear plot is performed to 100% air to indicate a way to calculate OTP. The same procedure is used to calculate OTP for phospholipid membrane incubated with varying amount of α-crystallin C) Profiles of OTP obtained at 37 °C with CSL spin label in the phospholipid membrane incubated with varying amount of α-crystallin. Incubation was done at 37 °C for 16 hrs with POPC concentration fixed to 9.4 mM. Error bars are estimated from the average of three independent experiments. As discussed in Sect. 2.1, there may be some contribution of the impurities in the change in membrane properties and this can be eliminated by using recombinant pure α-crystallin.
3. Results
3.1. Effect of incubation time on the binding of α-crystallin and the membrane surface occupied by α-crystallin
To examine the time dependence of binding of α-crystallin with membrane, 35 μM of α-crystallin was incubated with 9.4 mM of POPC in total volume of 70 μL of Hepes buffer. The incubation was done at 37°C for up to 16 hr with gentle shaking. The samples were transferred to TPX capillary at different incubation times and the CW EPR measurements were performed. Fig. 2A shows the normalized EPR spectra of CSL in membrane with α-crystallin binding at different incubation times. Low field EPR line signal intensity decreases with an increased incubation time and saturates at about 8 hrs as demonstrated in Fig. 2B. EPR spectra at 0 hr (Fig. 2) was used as control representing the EPR signal for membrane alone (membrane was incubated without α-crystallin) and thus represents the unbound contribution. EPR spectra at different incubation times (concentration of α-crystallin and POPC is fixed) represent the bound plus unbound contribution. Since our EPR spin label CSL is near the membrane surface and the α-crystallin is bound on the membrane surface, the percentage of CSL spin label affected on the membrane surface by the binding of α-crystallin is estimated as:
| (3) |
where Uo is the low field EPR line peak to peak signal intensity from unbound contribution and (Bo+ Uo) is the low field EPR line peak to peak signal intensity from bound plus unbound contribution (see Fig. 2C). Because our membranes are SUVs of ~30 nm44, approximately 60% of the CSL spin labels are in the outer membrane surface and 40% of the CSL spin labels are in the inner membrane surface. Only the spin labels that are on the outer membrane surface are affected by binding of α-crystallin. So, the corrected % spin labels are affected or the % of outer membrane surface occupied by α-crystallin is obtained by multiplying equation (3) by the correction factor (100/60):
| (4) |
Figure 2.

A) EPR spectra of CSL in membrane with α-crystallin binding at different incubation time. All the samples were incubated at 37 °C. The concentration of POPC and α-crystallin used was fixed at 9.4 mM and 35 μM, respectively, in the total volume of 70 μL (The sample at 0 hr is membrane incubated without α-crystallin and is used as a control). B) Fragment of EPR spectra demonstrating the change in molecular motion of membrane with increase in incubation time. C) Low field EPR line showing the peak to peak intensity of unbound (Uo) and bound plus unbound (Bo+Uo) contributions.
Using equation (4), the percentage of the membrane surface occupied by α-crystallin at different incubation times is obtained. Fig 3. shows that percentage of membrane surface occupied by α-crystallin increases with an increase of incubation time. This indicates that binding increases with incubation time and reaches a maximum at about 8 hours (see Fig. 3).
Figure 3.

The membrane surface occupied by α-crystallin increases with an increase in incubation time and is maximum about 8 hours. Error bars are estimated from the average of three independent experiments.
3.2. Ka of α-crystallin to phospholipid membrane
The Ka of α-crystallin with the POPC membrane was determined by varying the concentration of α-crystallin and by keeping the concentration of POPC fixed. POPC concentration was fixed at 9.4 mM and α-crystallin concentration was varied from 0 to 53 μM. The α-crystallin and the membrane mixture were incubated for 16 hrs at 37°C with gentle shaking. Fig. 4A shows normalized CW EPR spectra for the CSL in membrane with varying concentrations of α-crystallin. Low field EPR line signal intensity decreases with an increase in α-crystallin concentration and saturates at about 18 μM as demonstrated in Fig. 4B. Peak to peak signal intensity of low field EPR line at 0 μM α-crystallin concentration was used as control representing the unbound contribution (Uo). Similarly peak to peak signal intensity of low field EPR line at 0.07, 0.31, 1.40, 18, 35, and 53 μM α-crystallin concentrations represent the contribution from bound plus unbound (Bo+ Uo). Fig. 5 shows the percentage membrane surface occupied by α-crystallin at different α-crystallin concentrations and is obtained by using equation 4 and Fig. 4. Since the outer membrane surface is identical throughout the vesicle, α-crystallin can bind to any region of the membrane surface with equal probability indicating that there is only one possible binding site, so we have used one-site ligand binding function to estimate Ka. Data points in Fig. 5 are fitted with one-site ligand binding function and Ka is estimated to be 4.9 ± 2.4 μM−1. One-site ligand binding function was used earlier to estimate Ka for saturation binding curves58,59. Previously, Mulders et al.37 labelled α-crystallin with [35S] methionine and estimated Ka of 7.69 μM−1 for α-crystallin with alkali-washed lens plasma membrane.
Figure 4.

A) EPR spectra of CSL in membrane with varying concentration of α-crystallin. The concentration of POPC was fixed at 9.4 mM. The mixture of α-crystallin and membranes samples were incubated at 37 °C for 16 hrs. B) Fragment of EPR spectra demonstrating the change in molecular motion of membrane with an increase in α-crystallin concentration. Membrane samples containing 0 μM of α-crystallin are used as control.
Figure 5.

Binding of α-crystallin with phospholipid membrane. The concentration of α-crystallin was varied and POPC was fixed at 9.4 mM. The membrane surface occupied by α-crystallin is estimated using equation 4 and Fig. 4. Error bars are estimated from the average of three independent experiments. Data points are fitted with one-site ligand binding model in GraphPad Prism (San Diego, CA) to estimate the binding affinity (Ka).
Also from Fig. 5, the maximum membrane surface occupied by α-crystallin for POPC membrane is about ~10% and the binding is saturable. To the best of our knowledge, our attempt is the first to estimate the membrane surface occupied by α-crystallin. Previously, Mulders et al.37 labelled α-crystallin with [35S] methionine and incubated with various concentrations of the egg yolk lecithin vesicle (i.e., phosphatidylcholine vesicle) and found about ~10% α-crystallin bound. Several groups have investigated the binding of α-crystallin with phospholipid vesicles (protein free vesicle)24,34–36,38. Tang et al.38 and Borchman et al.34 used fluorophore NBD-PE to investigate the binding of α-crystallin with protein free vesicle, and they observed the saturable binding. Similarly, Cobb et al.35 conjucated α-crystallin to the AlexaFluor350™ fluorescent tag and found saturable binding for protein free vesicle.
3.3. Mobility of membrane after binding of α-crystallin
Fig. 6A shows the representative CW EPR spectra of CSL in POPC membrane incubated with 53 μM of α-crystallin for 16 hrs at 37°C. The concentration of POPC was fixed at 9.4 mM. The values used for the calculation of mobility parameter60, h+ and h0, are measured directly from the spectra as shown in figure 6. The mobility parameter (h+/h0) includes contribution of both orientation and rotational mobility of the CSL molecules60. We have used the mobility parameter previously to estimate the mobility of the membrane at varying cholesterol concentrations56,61,62. Fig. 6B shows the profiles of mobility parameter with varying concentrations of α-crystallin. Mobility parameter decreases sharply with an increase in α-crystallin concentration and saturates at about 18 μM. This indicates the rate of motion of the membrane decreases as more and more α-crystallin binds the membrane. Because the nitroxide moiety of CSL is located near the membrane surface (see Fig. 1), it reflects orientation and rotational motion near the membrane surface. This indicates the binding of α-crystallin makes the membrane more immobilized near the head group region of the PL.
Figure 6.

A) Representative EPR spectra of CSL from phospholipid membrane incubated with α-crystallin (53 μM) at 37 °C for 16 hrs. Spectra was recorded at 37 °C. Measured values used to calculate the mobility parameter are indicated. B) Mobility parameter (h+/ho) obtained at 37 °C, is plotted as a function of α-crystallin concentration. The POPC concentration was fixed to 9.4 mM. Error bars are estimated from the average of three independent experiments. As discussed in Sect. 2.1, there may be some contribution of the impurities in the change in membrane properties and this can be eliminated by using recombinant pure α-crystallin.
Previously, we have used CSL spin label in POPC membrane with varying cholesterol concentrations (0 mol % to 75 mol %) to investigate the mobility of POPC membrane in the presence of cholesterol63. We also saw a sharp decrease in mobility parameter that saturates at about 50 mol % of cholesterol (see Fig. 7B in ref63). If we compare the effect of α-crystallin binding in membrane mobility vs the effect of cholesterol in membrane mobility, then the decrease in membrane mobility by increasing α-crystallin concentration from 0 μM to 18 μM is comparable to the decrease in membrane mobility by increasing cholesterol concentration from 33 mol % to 66 mol % (see Fig. 7B in ref63 for cholesterol data).
Figure 7.

Representative SR signals with fitted curves and residuals (the experimental signal minus the fitted curve) for CSL in phospholipid membrane (concentration of POPC was fixed to 9.4 mM) incubated with 0 μM α-crystallin (A) and with 53 μM α-crystallin (B). Incubation was done at 37 °C for 16 hrs. Signals were recorded at 37°C for samples equilibrated with 100% nitrogen, and with a gas mixture of 50% air and 50% nitrogen (A, B). SR signals were satisfactorily fitted to a single-exponential function both in the absence and presence of molecular oxygen with time constants of 2.52 ± 0.01 μs (A, 100% N2), 2.74 ± 0.01 μs (B, 100% N2), 0.68 ± 0.004 μs (A, 50% AIR), 0.78 ± 0.004 μs (B, 50% AIR), (both the upper and lower residuals are for a single-exponential fit).
Borchman et al.34 used fluorophore NBD-PE that partitions near the membrane head group region to investigate the binding of α-crystallin to bovine lens lipid vesicles. They found that the head group region becomes less mobile with binding of α-crystallin34, which is in agreement with our findings.
3.4. Fluidity and OTP of membrane after binding of α-crystallin
The spin-lattice relaxation rate (T1−1) obtained from the SR EPR measurements of lipid spin labels in deoxygenated samples depends primarily on the rotational correlation time of the nitroxide moiety within the lipid bilayer64,65. Thus, T1−1 can be used as a convenient quantitative measure of membrane fluidity that reflects the local motional properties of the lipid alkyl chain62,66–69. Previously, we have used T1−1 as a convenient quantitative measure of fluidity using phospholipid analog (n-PC, 9-SASL) and cholesterol analog (CSL) spin labels in model and eye lens lipid membranes56,62,66–70. Representative saturation recovery EPR signal of CSL in membrane incubated with 0 μM α-crystallin and 53 μM α-crystallin are shown in Fig. 7 (The concentration of POPC was fixed to 9.4 mM). Measurements were performed for deoxygenated samples (100 % N2) and samples equilibrated with selected air/nitrogen mixture. All saturation-recovery EPR signals shown in Fig. 7 were satisfactorily fit to a single exponential function. As can be seen from residuals (the experimental signal minus the fitting curve) in all cases, the single-exponential fit was excellent.
T1−1’s obtained from the deoxygenated samples for varying α-crystallin concentrations allows us to construct fluidity profiles as shown in Fig. 8A. Fig. 8A shows that membrane fluidity decreases with an increase in α-crystallin concentration. This indicates that as more and more α-crystallin binds the membrane, the membrane becomes less mobile near the head group region of the PL. This finding is in agreement with mobility measurement presented in Section 3.3.
Previously, we have observed with CSL spin label in the membrane that membrane fluidity decrease with increase in cholesterol concentration from 0 mol % to 50 mol % (see Fig. 7C in ref 63). If we compare the decrease in membrane fluidity by α-crystallin binding in membrane vs the decrease in membrane fluidity by increasing cholesterol content from 0 mol % to 50 mol % in membrane. Then the overall change in T1−1 value is 0.031μs−1 (see. Fig. 8A) with α-crystallin binding, whereas the overall change in T1−1 value is ~0.014 μs−1 (see Fig. 7C in ref 63) with 50 mol % cholesterol content increase. The change in T1−1 is about twice as big (double) with α-crystallin binding in comparison with increasing cholesterol content to 50 mol %, which indicates that the effect on membrane fluidity is greater with α-crystallin binding in comparison with 50 mol % cholesterol content increase in membrane.
SR EPR measurements were taken at 0% air (i.e., 100 % N2), 30 % air, and 50 % air and then extrapolation to 100% air is performed to obtain the final values of the OTPs.
The theory for the OTP is described in Sect. 2.6. Representative SR signals at 100 % N2 and 50 % air is shown in Fig. 7. Fig. 8C shows the profiles of OTP in the membrane with varying concentrations of α-crystallin. The OTP decreases with an increase with α-crystallin concentration which indicates that the binding of α-crystallin forms a barrier to oxygen transport. This barrier increases as more and more α-crystallin binds with the membrane. Our results are in strong agreement with the barrier hypothesis proposed earlier5,14,32, where binding of α-crystallin to membrane occludes membrane pores forming a barrier to diffusion. As proposed earlier, blocking of membrane pores could induce oxidative conditions in the lens center which leads to the development of nuclear cataract5,14,32.
4. Discussion
Several studies have reported that with age and cataract formation the amount of membrane bound α-crystallin increases14,15,28,29,32. A recent clinical study has also shown that if the level of unbound α-crystallin in the lens is higher, then there is a lower risk to have lens opacification or need for the cataract surgery29. Clinical study further confirmed that α-crystallin levels decrease over time with age and this decrease in α-crystallin leads to cataract29. The decreased α-crystallin level in lens cytoplasm will increase the amount of membrane bound α-crystallin which increases light scattering and induces cataract formation. So, it is very crucial to understand the mechanism on the fundamental level that promotes or inhibits α-crystallin to bind the lens membranes.
Previously, Tang et. al38 investigated the binding of α-crystallin to disterolphosphatidylcholine (DSPC), sphingomyelin (SM), and egg-PC membrane. They found that the binding α-crystallin depends upon the hydrocarbon chain order. Cobb et. al35 investigated the binding of α-crystallin to lipids with varying lipid structural order and saturation of acyl chain. Their finding suggests that the binding of α-crystallin to lipid membrane is independent of lipid bilayer fluidity and over-all structural order. Borchman et. al34 investigated the binding of α-crystallin with bovine lens lipids and found that lipid headgroups become less mobile with binding which is in agreement with our data presented here. The florescence approaches previously employed utilized the fluorophore NBD-PE which resides on the polar head group region of the membrane38 or the α-crystallin was conjugated to the Alexfluor350™ fluorescent tag35, to investigate the binding of α-crystallin to lipid membrane. As mentioned in the previous study, these florescence approaches include ultracentrifugation steps where bound α-crystallin pellet was used for analysis. These techniques may result in incomplete pelleting of the vesicles that could underestimate the amount of bound α-crystallin35. Here we have developed the EPR approach where the CSL spin label is located near the surface of the membrane and gives the information about the binding of α-crystallin as well as the physical properties of membrane after the binding of α-crystallin. The EPR approach avoids the centrifugation steps and has the unique ability to give the information about the membrane surface occupied by α-crystallin.
In addition, the EPR approach also gives new information about the mobility, fluidity, and OTP of the membrane after α-crystallin binding. As discussed in Sect. 3.4, OTP gives the information about barrier in the membrane and this barrier increases with α-crystallin binding. Although the study performed here was for the protein free membrane, we can speculate that binding of α-crystallin to lens membrane will occlude the pores of aquaporin-0 (AQP0) and connexins (Cx46 and Cx50), the most abundant integral transmembrane proteins in human lens fiber cell membranes71–73. AQP0 control transport of water and some neutral solutes74. Connexins form gap junctions between lens fiber cells and control the exchange of ions and small metabolites between lens cells75. Thus, occluding the membrane pores would result in a barrier to diffusion of these small molecules which ultimately could lead to the development of nuclear cataracts14.
Our results (see Fig .5) as well as the work of others34,38 observed the saturation binding of α-crystallin to protein free lipid vesicles. For the POPC membranes, the phospholipid head group has a neutral charge and the interior hydrocarbon chains are hydrophobic. As reported earlier37,76 α-crystallin has a hydrophobic regions on its surface, thus it is likely that the binding of α-crystallin to the membrane is lipid-specific and is through hydrophobic interaction. Previously, Tang et. al38 reported that the binding of α-crystallin to protein free membranes depends on the hydrocarbon chain order, Cobb and Petrash27 postulated that the binding of α-crystallin to lens membrane is predominantly through hydrophobic interactions, and Ifeanyi and Takemoto77 demonstrated that the binding of α-crystallin to lens membrane is specific and saturable.
α-crystallin consists of αA- and αB- crystallin subunits with 3 αA to 1 αB molar ratio in adult bovine lens18. α-crystallin forms highly polydisperse oligomers18,41 in which subunits are known to exchange between the oligomer41,78–80. This oligomer are a dynamic system where the size of the oligomer changes dynamically by adding or removing the monomer or small oligomers41,81. Srinivas et. al82 studied the thermal stability of α-crystallin using differential scanning calorimetry and found that the unfolding temperature between 58–61°C for 3:1 heteropolymer and αA-crystallin homopolymer and also observe no precipitation upon thermal unfolding. Based on this thermodynamic stability of α-crystallin, it is very likely that the soluble α-crystallin (not bound to the membrane) is stable at 37 °C for 16 hours. We think that the α-crystallin that is in the solution after binding saturation is achieved will interact with membrane bound α-crystallin via subunit exchange. However looking at the higher binding affinity values (Fig .5) we speculate that the subunit exchange takes place only between the soluble α-crystallin and solvent exposed subunits of membrane bound alpha-crystallin. Previously, Cobb and Petrash16 used fluorescence resonance energy transfer and demonstrated that the subunit exchange takes between solvent exposed regions of membrane bound α-crystallin and the soluble α-crystallin.
α-crystallin belongs to the small heat shock protein family and serves as chaperone, binding with the denatured proteins preventing their aggregation78,79,82. Subunit exchange between the α-crystallin oligomers is required to main the chaperone like activity16,78. It has been reported that the subunit exchange depends upon temperature79,80 and reached complete equilibrium within 4 hour for alpha αA-crystallin subunits79 whereas for mixing of isolated bovine αA and αB crystallin the exchange reaction continues until 24 hours80. For αA-crystallin subunit exchange, the rate constant was estimated to 0.075 min−1 at 37 °C79. It has also been reported that the rate of subunit exchange in αA-crystallin changes depending upon the size and concentration of polypeptide bound to the αA-crystallin79. Based on these earlier findings, we speculate that when binding of α-crystallin to membranes increases with time (Fig. 3), the rate of subunit exchange between membrane bound α-crystallin and soluble α-crystallin may change.
The CSL spin labels are located in both regions in the membrane i.e. in the region where α-crystallin is bound to the membrane and in the region where α-crystallin is not bound in the membrane. Therefore, we expect to have two values of the T1−1’s from these two regions; however, we get only one average T1−1 value (see Fig. 8A). This indicates that the exchange rate of CSL spin labels in membranes between the bound α-crystallin and unbound α-crystallin is greater than T1−1 giving an averaged T1−1. This exchange rate between these bound and unbound α-crystallin regions in the membrane is faster when compared with the spin–lattice relaxation rate of lipid spin labels in membranes between 105 and 106 s−1 (T1 from 1 to 10 μs). This faster exchange rate implies that the bound α-crystallin membrane regions should be small, allowing us to hypothesize that it is likely that the α-crystallin monomer or smaller oligomers with few subunits are participating in binding rather than the larger oligomers of α-crystallin.
Autoxidation of the phospholipid membrane is very slow process and it depends on the number of double bonds on the acyl chain83. The accumulation of phospholipid peroxidation products was reported earlier using a thiobarbituric acid assay for autoxidation of 1-palmitoyl-2-arachidonoyl-phosphatidylcholine (PAPC) membrane83. The phospholipid peroxidation products was very low for the first 75 hours of autoxidation of PAPC membrane83. In the PAPC molecule, there are four double bonds in one acyl chain (arachidonic) and the second acyl chain (palmitic) is fully saturated whereas in the case of the POPC molecule that is used in this project, has only one double bond in one acyl chain (oleic) and the second chain (palmitic) is fully saturated. Thus, it is very likely that POPC autoxidation will not occur in 16-hour incubation at 37 °C. We measured the EPR signal of CSL in POPC membrane (~30 nm SUVs) at 0 hour and after 16-hour incubation at 37 °C and found that there is no significant change in the EPR signal indicating the stability of the SUVs.
5. Conclusions
In this study, we have demonstrated the EPR approach to estimate Ka of α-crystallin to phospholipid membranes. The unique ability of the EPR approach to get the information about the membrane surface occupied by α-crystallin is also demonstrated. In addition, the physical properties of membrane after the binding of α-crystallin were also obtained. The physical properties include mobility parameter, fluidity parameter and OTP which decrease as more and more α-crystallin binds to the membrane. All these findings contribute to better undersetting of α-crystallin association with the membrane at the molecular level.
Acknowledgments
Research reported in this publication was supported by the National Institutes of Health (USA) under Grants R01 EY030067, R01 EY015526, and P41 EB001980.
Footnotes
Declaration of Interest
The authors report no conflicts of interest.
REFERENCES
- 1.Hejtmancik JF, Kantorow M. Molecular genetics of age-related cataract. Exp Eye Res 2004;79:3–9. [DOI] [PMC free article] [PubMed] [Google Scholar]
- 2.Shiels A, Hejtmancik JF. Genetic origins of cataract. Arch Ophthalmol 2007;125:165–173. [DOI] [PubMed] [Google Scholar]
- 3.Uwineza A, Kalligeraki AA, Hamada N, Jarrin M, Quinlan RA. Cataractogenic load - A concept to study the contribution of ionizing radiation to accelerated aging in the eye lens. Mutat Res 2019;779:68–81. [DOI] [PubMed] [Google Scholar]
- 4.Bron AJ, Vrensen GF, Koretz J, Maraini G, Harding JJ. The ageing lens. Ophthalmologica 2000;214:86–104. [DOI] [PubMed] [Google Scholar]
- 5.Truscott RJ. Age-related nuclear cataract-oxidation is the key. Exp Eye Res 2005;80:709–725. [DOI] [PubMed] [Google Scholar]
- 6.Hsuan JD, Brown NA, Bron AJ, Patel CK, Rosen PH. Posterior subcapsular and nuclear cataract after vitrectomy. J Cataract Refract Surg 2001;27:437–444. [DOI] [PubMed] [Google Scholar]
- 7.Chung CP, Hsu SY, Wu WC. Cataract formation after pars plana vitrectomy. Kaoh J Med Sci 2001;17:84–89. [PubMed] [Google Scholar]
- 8.Huang L, Estrada R, Yappert MC, Borchman D. Oxidation-induced changes in human lens epithelial cells. 1. Phospholipids. Free Radic Biol Med 2006;41:1425–1432. [DOI] [PubMed] [Google Scholar]
- 9.Palmquist BM, Philipson B, Barr PO. Nuclear cataract and myopia during hyperbaric oxygen therapy. Br J Ophthalmol 1984;68:113–117. [DOI] [PMC free article] [PubMed] [Google Scholar]
- 10.Freel CD, Gilliland KO, Mekeel HE, Giblin FJ, Costello MJ. Ultrastructural characterization and Fourier analysis of fiber cell cytoplasm in the hyperbaric oxygen treated guinea pig lens opacification model. Exp Eye Res 2003;76:405–415. [DOI] [PubMed] [Google Scholar]
- 11.Truscott RJ, Augusteyn RC. Changes in human lens proteins during nuclear cataract formation. Exp Eye Res 1977;24:159–170. [DOI] [PubMed] [Google Scholar]
- 12.Moreau KL, King JA. Protein misfolding and aggregation in cataract disease and prospects for prevention. Trends Mol Med 2012;18:273–282.22520268 [Google Scholar]
- 13.Zhao L, Chen XJ, Zhu J, Xi YB, Yang X, Hu LD, Ouyang H, Patel SH, Jin X, Lin D, et al. Corrigendum: Lanosterol reverses protein aggregation in cataracts. Nature 2015;526:595. [DOI] [PubMed] [Google Scholar]
- 14.Friedrich MG, Truscott RJ. Large-scale binding of alpha-crystallin to cell membranes of aged normal human lenses: a phenomenon that can be induced by mild thermal stress. Invest Ophthalmol Vis Sci 2010;51:5145–5152. [DOI] [PMC free article] [PubMed] [Google Scholar]
- 15.Chandrasekher G, Cenedella RJ. Protein associated with human lens ‘native’ membrane during aging and cataract formation. Exp Eye Res 1995;60:707–717. [DOI] [PubMed] [Google Scholar]
- 16.Cobb BA, Petrash JM. alpha-Crystallin chaperone-like activity and membrane binding in age-related cataracts. Biochemistry 2002;41:483–490. [DOI] [PMC free article] [PubMed] [Google Scholar]
- 17.Chandrasekher G, Cenedella RJ. Protein associated with human lens ‘native’ membrane during aging and cataract formation. Exp Eye Res 1995;60:707–717. [DOI] [PubMed] [Google Scholar]
- 18.Horwitz J, Bova MP, Ding LL, Haley DA, Stewart PL. Lens alpha-crystallin: function and structure. Eye (Lond) 1999;13 Pt 3b):403–408. [DOI] [PubMed] [Google Scholar]
- 19.Santhoshkumar P, Raju M, Sharma KK. alphaA-crystallin peptide SDRDKFVIFLDVKHF accumulating in aging lens impairs the function of alpha-crystallin and induces lens protein aggregation. PLoS One 2011;6:e19291. [DOI] [PMC free article] [PubMed] [Google Scholar]
- 20.Alpha-crystallin Horwitz J.. Exp Eye Res 2003;76:145–153. [DOI] [PubMed] [Google Scholar]
- 21.Nagaraj RH, Nahomi RB, Mueller NH, Raghavan CT, Ammar DA, Petrash JM. Therapeutic potential of alpha-crystallin. Biochim Biophys Acta 2016;1860:252–257. [DOI] [PMC free article] [PubMed] [Google Scholar]
- 22.Boyle DL, Takemoto L. EM immunolocalization of alpha-crystallins: association with the plasma membrane from normal and cataractous human lenses. Curr Eye Res 1996;15:577–582. [DOI] [PubMed] [Google Scholar]
- 23.Cenedella RJ, Fleschner CR. Selective association of crystallins with lens ‘native’ membrane during dynamic cataractogenesis. Curr Eye Res 1992;11:801–815. [DOI] [PubMed] [Google Scholar]
- 24.Grami V, Marrero Y, Huang L, Tang D, Yappert MC, Borchman D. alpha-Crystallin binding in vitro to lipids from clear human lenses. Exp Eye Res 2005;81:138–146. [DOI] [PubMed] [Google Scholar]
- 25.Tang D, Borchman D, Yappert MC, Cenedella RJ. Influence of cholesterol on the interaction of alpha-crystallin with phospholipids. Exp Eye Res 1998;66:559–567. [DOI] [PubMed] [Google Scholar]
- 26.Chandrasekher G, Cenedella RJ. Properties of alpha-crystallin bound to lens membrane: probing organization at the membrane surface. Exp Eye Res 1997;64:423–430. [DOI] [PubMed] [Google Scholar]
- 27.Cobb BA, Petrash JM. Characterization of alpha-crystallin-plasma membrane binding. J Biol Chem 2000;275:6664–6672. [DOI] [PMC free article] [PubMed] [Google Scholar]
- 28.Su SP, McArthur JD, Friedrich MG, Truscott RJ, Aquilina JA. Understanding the alpha-crystallin cell membrane conjunction. Mol Vis 2011;17:2798–2807. [PMC free article] [PubMed] [Google Scholar]
- 29.Datiles MB 3rd, Ansari RR, Yoshida J, Brown H, Zambrano AI, Tian J, Vitale S, Zigler JS Jr., Ferris FL 3rd, West SK, et al. Longitudinal Study of Age-Related Cataract Using Dynamic Light Scattering: Loss of alpha-Crystallin Leads to Nuclear Cataract Development. Ophthalmology 2016;123:248–254. [DOI] [PMC free article] [PubMed] [Google Scholar]
- 30.Cenedella RJ, Fleschner CR. Selective association of crystallins with lens ‘native’ membrane during dynamic cataractogenesis. Curr Eye Res 1992;11:801–815. [DOI] [PubMed] [Google Scholar]
- 31.Tang D, Borchman D, Yappert MC. Alpha-crystallin/lens lipid interactions using resonance energy transfer. Ophthalmic Res 1999;31:452–462. [DOI] [PubMed] [Google Scholar]
- 32.Friedrich MG, Truscott RJ. Membrane association of proteins in the aging human lens: profound changes take place in the fifth decade of life. Invest Ophthalmol Vis Sci 2009;50:4786–4793. [DOI] [PubMed] [Google Scholar]
- 33.Sato H, Borchman D, Ozaki Y, Lamba OP, Byrdwell WC, Yappert MC, Paterson CA. Lipid-protein interactions in human and bovine lens membranes by Fourier transform Raman and infrared spectroscopies. Exp Eye Res 1996;62:47–53. [DOI] [PubMed] [Google Scholar]
- 34.Borchman D, Tang D. Binding capacity of alpha-crystallin to bovine lens lipids. Exp Eye Res 1996;63:407–410. [DOI] [PubMed] [Google Scholar]
- 35.Cobb BA, Petrash JM. Factors influencing alpha-crystallin association with phospholipid vesicles. Mol Vis 2002;8:85–93. [PMC free article] [PubMed] [Google Scholar]
- 36.Ifeanyi F, Takemoto L. Interaction of lens crystallins with lipid vesicles. Exp Eye Res 1991;52:535–538. [DOI] [PubMed] [Google Scholar]
- 37.Mulders JW, Stokkermans J, Leunissen JA, Benedetti EL, Bloemendal H, de Jong WW. Interaction of alpha-crystallin with lens plasma membranes. Affinity for MP26. Eur J Biochem 1985;152:721–728. [DOI] [PubMed] [Google Scholar]
- 38.Tang D, Borchman D, Yappert MC, Cenedella RJ. Influence of cholesterol on the interaction of alpha-crystallin with phospholipids. Exp Eye Res 1998;66:559–567. [DOI] [PubMed] [Google Scholar]
- 39.Ward KA. Alpha-crystallin incorporates to form proteoliposomes. Invest Ophthalmol Vis Sci 1996;37:S599. [Google Scholar]
- 40.Deeley JM, Mitchell TW, Wei X, Korth J, Nealon JR, Blanksby SJ, Truscott RJ. Human lens lipids differ markedly from those of commonly used experimental animals. Biochim Biophys Acta 2008;1781:288–298. [DOI] [PubMed] [Google Scholar]
- 41.Ryazantsev SN, Poliansky NB, Chebotareva NA, Muranov KO. 3D structure of the native alpha-crystallin from bovine eye lens. Int JBiol Macromol 2018;117:1289–1298. [DOI] [PubMed] [Google Scholar]
- 42.Horwitz J, Huang QL, Ding L, Bova MP. Lens alpha-crystallin: chaperone-like properties. Methods Enzymol 1998;290:365–383. [DOI] [PubMed] [Google Scholar]
- 43.Lampi KJ, Fox CB, David LL. Changes in solvent accessibility of wild-type and deamidated betaB2-crystallin following complex formation with alphaA-crystallin. Exp Eye Res 2012;104:48–58. [DOI] [PMC free article] [PubMed] [Google Scholar]
- 44.Mainali L, Vasquez-Vivar J, Hyde JS, Subczynski WK. Spin-labeled small unilamellar vesicles with the T1-sensitive saturation-recovery EPR display as an oxygen sensitive analyte for measurement of cellular respiration. Appl Magn Reson 2015;46:885–895. [DOI] [PMC free article] [PubMed] [Google Scholar]
- 45.Buboltz JT. A more efficient device for preparing model-membrane liposomes by the rapid solvent exchange method. Rev Sci Instrum 2009;80:124301. [DOI] [PubMed] [Google Scholar]
- 46.Buboltz JT, Feigenson GW. A novel strategy for the preparation of liposomes: rapid solvent exchange. Biochim Biophys Acta 1999;1417:232–245. [DOI] [PubMed] [Google Scholar]
- 47.Subczynski WK, Felix CC, Klug CS, Hyde JS. Concentration by centrifugation for gas exchange EPR oximetry measurements with loop-gap resonators. J Magn Reson 2005;176:244–248. [DOI] [PubMed] [Google Scholar]
- 48.Mainali L, Camenisch TG, Hyde JS, Subczynski WK. Saturation recovery EPR spin-labeling method for quantification of lipids in biological membrane domains. Appl Magn Reson 2017;48:1355–1373. [DOI] [PMC free article] [PubMed] [Google Scholar]
- 49.Subczynski WK, Hyde JS, Kusumi A. Oxygen permeability of phosphatidylcholine-cholesterol membranes. Proc Natl Acad Sci USA 1989;86:4474–4478. [DOI] [PMC free article] [PubMed] [Google Scholar]
- 50.Yin JJ, Subczynski WK. Effects of lutein and cholesterol on alkyl chain bending in lipid bilayers: a pulse electron spin resonance spin labeling study. Biophys J 1996;71:832–839. [DOI] [PMC free article] [PubMed] [Google Scholar]
- 51.Kusumi A, Subczynski WK, Hyde JS. Oxygen transport parameter in membranes as deduced by saturation recovery measurements of spin-lattice relaxation times of spin labels. Proc Natl Acad Sci USA 1982;79:1854–1858. [DOI] [PMC free article] [PubMed] [Google Scholar]
- 52.Windrem DA, Plachy WZ. The diffusion-solubility of oxygen in lipid bilayers. Biochim Biophys Acta 1980;600:655–665. [DOI] [PubMed] [Google Scholar]
- 53.Hyde JS, Subczynski WK. Simulation of EPR spectra of the oxygen-sensitive spin-label probe CTPO. J Magn Res 1984;56. [Google Scholar]
- 54.Hyde JS, Subczynski WK. Spin-label oximetry In: Berliner LJ, Reuben J, editors. Biological Magnetic Resonance. New York: Plenum Press; 1989. pp 399–425. [Google Scholar]
- 55.Subczynski WK, Hyde JS. Diffusion of oxygen in water and hydrocarbons using an electron spin resonance spin-label technique. Biophys J 1984;45:743–748. [DOI] [PMC free article] [PubMed] [Google Scholar]
- 56.Raguz M, Mainali L, Widomska J, Subczynski WK. Using spin-label electron paramagnetic resonance (EPR) to discriminate and characterize the cholesterol bilayer domain. Chem Phys Lipids 2011;164:819–829. [DOI] [PMC free article] [PubMed] [Google Scholar]
- 57.Mainali L, O’Brien WJ, Subczynski WK. Detection of cholesterol bilayer domains in intact biological membranes: Methodology development and its application to studies of eye lens fiber cell plasma membranes. Exp Eye Res 2019;178:72–81. [DOI] [PMC free article] [PubMed] [Google Scholar]
- 58.Schultz KM, Feix JB, Klug CS. Disruption of LptA oligomerization and affinity of the LptA-LptC interaction. Protein Sci 2013;22:1639–1645. [DOI] [PMC free article] [PubMed] [Google Scholar]
- 59.Schultz KM, Lundquist TJ, Klug CS. Lipopolysaccharide binding to the periplasmic protein LptA. Protein Sci 2017;26:1517–1523. [DOI] [PMC free article] [PubMed] [Google Scholar]
- 60.Schreier S, Polnaszek CF, Smith IC. Spin labels in membranes. Problems in practice. Biochim Biophys Acta 1978;515:395–436. [DOI] [PubMed] [Google Scholar]
- 61.Raguz M, Mainali L, Widomska J, Subczynski WK. The immiscible cholesterol bilayer domain exists as an integral part of phospholipid bilayer membranes. Biochim Biophys Acta 2011;1808:1072–1080. [DOI] [PMC free article] [PubMed] [Google Scholar]
- 62.Mainali L, Raguz M, Subczynski WK. Phases and domains in sphingomyelin-cholesterol membranes: structure and properties using EPR spin-labeling methods. Eur Biophys J 2012;41:147–159. [DOI] [PMC free article] [PubMed] [Google Scholar]
- 63.Raguz M, Mainali L, Widomska J, Subczynski WK. Using spin-label electron paramagnetic resonance (EPR) to discriminate and characterize the cholesterol bilayer domain. Chem Phys Lipids 2011;164:819–829. [DOI] [PMC free article] [PubMed] [Google Scholar]
- 64.Robinson BH, Haas DA, Mailer C. Molecular dynamics in liquids: spin-lattice relaxation of nitroxide spin labels. Science 1994;263:490–493. [DOI] [PubMed] [Google Scholar]
- 65.Mailer C, Nielsen RD, Robinson BH. Explanation of spin-lattice relaxation rates of spin labels obtained with multifrequency saturation recovery EPR. J Phys Chem A 2005;109:4049–4061. [DOI] [PubMed] [Google Scholar]
- 66.Mainali L, Raguz M, Camenisch TG, Hyde JS, Subczynski WK. Spin-label saturation-recovery EPR at W-band: applications to eye lens lipid membranes. J Magn Reson 2011;212:86–94. [DOI] [PMC free article] [PubMed] [Google Scholar]
- 67.Mainali L, Feix JB, Hyde JS, Subczynski WK. Membrane fluidity profiles as deduced by saturation-recovery EPR measurements of spin-lattice relaxation times of spin labels. J Magn Reson 2011;212:418–425. [DOI] [PMC free article] [PubMed] [Google Scholar]
- 68.Mainali L, Hyde JS, Subczynski WK. Using spin-label W-band EPR to study membrane fluidity profiles in samples of small volume. J Magn Reson 2013;226:35–44. [DOI] [PMC free article] [PubMed] [Google Scholar]
- 69.Subczynski WK, Raguz M, Widomska J. Studying lipid organization in biological membranes using liposomes and EPR spin labeling. Methods Mol Biol 2010;606:247–269. [DOI] [PMC free article] [PubMed] [Google Scholar]
- 70.Mainali L, Raguz M, O’Brien WJ, Subczynski WK. Properties of membranes derived from the total lipids extracted from the human lens cortex and nucleus. Biochim Biophys Acta 2013;1828:1432–1440. [DOI] [PMC free article] [PubMed] [Google Scholar]
- 71.Bassnett S, Shi Y, Vrensen GF. Biological glass: structural determinants of eye lens transparency. Philos Trans Royal Soc Lond Ser B Biol Sci 2011;366:1250–1264. [DOI] [PMC free article] [PubMed] [Google Scholar]
- 72.Gonen T, Cheng Y, Sliz P, Hiroaki Y, Fujiyoshi Y, Harrison SC, Walz T. Lipid-protein interactions in double-layered two-dimensional AQP0 crystals. Nature 2005;438:633–638. [DOI] [PMC free article] [PubMed] [Google Scholar]
- 73.Reichow SL, Gonen T. Lipid-protein interactions probed by electron crystallography. Curr Opin Struct Biol 2009;19:560–565. [DOI] [PMC free article] [PubMed] [Google Scholar]
- 74.Agre P Nobel Lecture. Aquaporin water channels. Biosci Rep 2004;24:127–163. [DOI] [PubMed] [Google Scholar]
- 75.Mathias RT, White TW, Gong X. Lens gap junctions in growth, differentiation, and homeostasis. Physiol Rev 2010;90:179–206. [DOI] [PMC free article] [PubMed] [Google Scholar]
- 76.Reddy GB, Kumar PA, Kumar MS. Chaperone-like activity and hydrophobicity of alpha-crystallin. IUBMB Life 2006;58:632–641. [DOI] [PubMed] [Google Scholar]
- 77.Ifeanyi F, Takemoto L. Specificity of alpha crystallin binding to the lens membrane. Curr Eye Res 1990;9:259–265. [DOI] [PubMed] [Google Scholar]
- 78.Bova MP, McHaourab HS, Han Y, Fung BK. Subunit exchange of small heat shock proteins. Analysis of oligomer formation of alphaA-crystallin and Hsp27 by fluorescence resonance energy transfer and site-directed truncations. J Biol Chem 2000;275:1035–1042. [DOI] [PubMed] [Google Scholar]
- 79.Bova MP, Ding LL, Horwitz J, Fung BK. Subunit exchange of alphaA-crystallin. J Biol Chem 1997;272:29511–29517. [DOI] [PubMed] [Google Scholar]
- 80.van den Oetelaar PJ, van Someren PF, Thomson JA, Siezen RJ, Hoenders HJ. A dynamic quaternary structure of bovine alpha-crystallin as indicated from intermolecular exchange of subunits. Biochemistry 1990;29:3488–3493. [DOI] [PubMed] [Google Scholar]
- 81.Alpha-crystallin Horwitz J.. Exp Eye Res 2003;76:145–153. [DOI] [PubMed] [Google Scholar]
- 82.Srinivas P, Narahari A, Petrash JM, Swamy MJ, Reddy GB. Importance of eye lens alpha-crystallin heteropolymer with 3:1 alphaA to alphaB ratio: stability, aggregation, and modifications. IUBMB Life 2010;62:693–702. [DOI] [PMC free article] [PubMed] [Google Scholar]
- 83.Zareba M, Widomska J, Burke JM, Subczynski WK. Nitroxide free radicals protect macular carotenoids against chemical destruction (bleaching) during lipid peroxidation. Free Radic Biol Med 2016;101:446–454. [DOI] [PMC free article] [PubMed] [Google Scholar]