

Summary
Pancreatic ductal adenocarcinoma (PDAC) cells require substantial metabolic rewiring to overcome nutrient limitations and immune surveillance. However, the metabolic pathways necessary for pancreatic tumor growth in vivo are poorly understood. To address this, we performed metabolism-focused CRISPR screens in PDAC cells grown in culture or engrafted in immunocompetent mice. While most metabolic gene essentialities are unexpectedly similar under these conditions, a small fraction of metabolic genes are differentially required for tumor progression. Among these, loss of heme synthesis reduces tumor growth due to a limiting role of heme in vivo, an effect independent of tissue origin or immune system. Our screens also identify autophagy as a metabolic requirement for pancreatic tumor immune evasion. Mechanistically, autophagy protects cancer cells from CD8+ T cell killing through TNFα-induced cell death in vitro. Altogether, this resource provides metabolic dependencies arising from microenvironmental limitations and the immune system, nominating potential anti-cancer targets.
eTOC Blurb
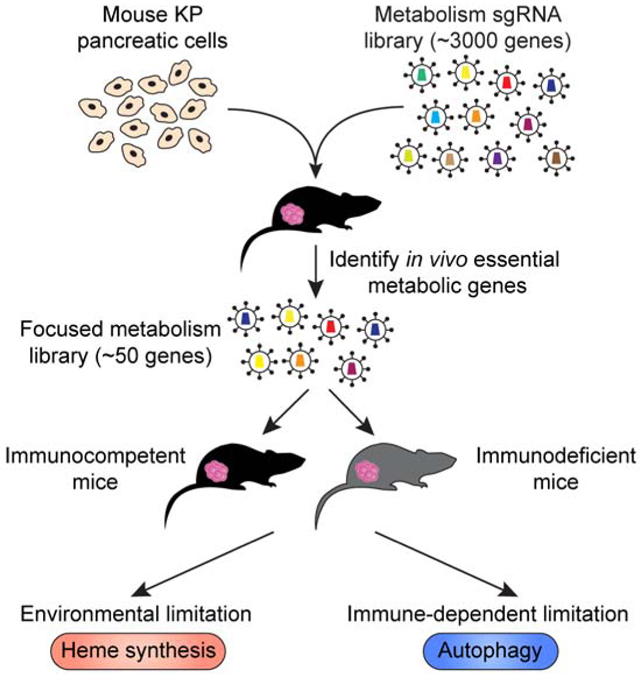
Using in vivo CRISPR screens, Zhu et al. map metabolic genes essential for pancreatic cancer cells to grow in culture and as tumors. While most essentialities are similar under these conditions, our screens identify heme synthesis and autophagy as metabolic requirements specific to the tumor environment.
Graphical Abstract
Introduction
Recent isotope labeling studies argue that the metabolism of human tumors is different from that of cancer cells in culture (Faubert et al., 2017; Hui et al., 2017). The tumor microenvironment in part drives this difference as cancer cells frequently starve for nutrients and oxygen due to dysfunctional vasculature. Indeed, changes in environmental nutrients and oxygen in culture can cause widespread effects on cancer cell metabolism (Alvarez et al., 2017; Birsoy et al., 2014; Cantor et al., 2017; Vande Voorde et al., 2019). Additionally, solid tumors are extraordinarily complex, containing diverse cell types including vascular cells, fibroblasts and immune cells. Many non-cancerous cell types are in constant interaction with each other and provide metabolic support for growth and evasion of immune surveillance (Kishton et al., 2017). These observations raise the possibility that much of the work done in culture conditions may not reflect the cellular and nutrient complexities of human tumors. Despite recent attempts to recapitulate cancer metabolic states in vivo (Sullivan et al., 2019), nutrient composition of most human tumor types remains to be defined and the metabolic pathways that cancer cells require to proliferate in the context of the stromal and immune cells remain poorly understood.
Pancreatic ductal adenocarcinoma (PDAC) is an aggressive disease characterized by a dense desmoplastic stroma, severe hypoxia and an immunosuppressive microenvironment (Ryan et al., 2014). Mutations in KRAS and TP53 are frequent in PDACs and contribute to metabolic changes that support anabolic processes as well as nutrient scavenging (Perera and Bardeesy, 2015). Previous work have identified metabolic pathways involved in PDAC progression such as autophagy, cysteine uptake and alanine metabolism (Badgley et al., 2020; Sousa et al., 2016; Yang et al., 2018). However, we currently lack a complete understanding of essential metabolic pathways during pancreatic tumor progression or how environmental factors cause each of these dependencies. Such a study would identify potential therapeutic targets for these cancers with limited treatment options.
To address this, we performed genetic screens in a murine KrasG12D/Trp53R172H mutant (KP) PDAC cell line model using a metabolism-focused CRISPR library and compared metabolic dependencies of cancer cells grown in culture or as tumors. These screens reveal a surprising similarity between essential metabolic genes for growth in vitro versus in vivo, suggesting that culture systems may be reasonable models for studying metabolic dependencies. Furthermore, we find several metabolic pathways as differentially required for tumor progression and determine selective pressures that may result in each metabolic dependency. Our analysis identifies heme synthesis as an in vivo liability due to environmentally induced upregulation of the heme-degrading enzyme Hmox1, an effect independent of the tissue origin or immune system. These screens also pinpoint autophagy as the only metabolic requirement for immune evasion. Loss of autophagy decreases tumor growth only in the presence of an intact immune system and enhances CD8+ T cell killing in vitro. Mechanistically, autophagy loss sensitizes pancreatic tumors to TNFα-induced apoptosis. Altogether, our work provides a comparative compendium of metabolic essentialities of pancreatic cancer cells grown in culture or as tumors; and reveals potential targets that could be exploited for therapy.
Results and Discussion
Metabolism-focused CRISPR screens reveal essential genes for pancreatic cancer growth in culture versus in vivo
Pancreatic tumors rely on various cellular metabolic pathways to grow, but how nutrient environments modify these dependencies is not well understood. To begin to address potential differences in metabolic pathway dependencies of pancreatic cancer cells grown in tissue culture or as tumors, we constructed a metabolism focused mouse sgRNA library targeting a comprehensive set of ~2900 metabolic genes and performed parallel loss-of-function screens in a murine pancreas cancer cell line derived from a KrasG12D/Trp53R172H mutant (KP) PDAC mouse model (Figure 1A). This library contains sgRNAs targeting enzymes and small molecule transporters as previously reported (Birsoy et al., 2015), but also transcription factors and other regulators relevant to cellular metabolism. A full list of genes in the library is provided in Table S1. After transduction with the sgRNA library, we passaged the pool of knockout cells for 14 population doublings in culture but also formed subcutaneous tumors in an immunocompetent C57BL/6J mouse model. At the end of the screens, for each gene, we calculated its score as the median log2 fold change in the abundance of all sgRNAs targeting the gene. Despite the challenge of maintaining sgRNA representation in vivo, we were able to detect an overwhelming majority (> 99%) of sgRNAs from tumors, owing to the efficient engraftment of this syngeneic model (Table S1). Furthermore, indicating the robustness of the screening approach, cumulative sgRNA frequencies of cultured cancer cells showed only a slight enrichment in representation compared to those of tumors (Figure 1B). Gene sets related to metabolic processes such as glycolysis and glycosylation showed strong depletion (Figure S1A), consistent with the known essentiality of these pathways (Ohtsubo and Marth, 2006; Tsherniak et al., 2017; Xu et al., 2005). Notably, sgRNA abundances correlated remarkably well between tumors and cultured pancreatic cancer cells (r=0.761, p<0.001) (Figure 1C). These results suggest that, despite the nutritional and cellular differences between tumors and culture systems, a substantial fraction of metabolic essentialities of pancreatic cancer cells are similar and likely not determined by the tumor environment.
Figure 1. Metabolism-focused CRISPR screens in vivo reveal metabolic dependencies of pancreatic tumors.

A. Schematic of genetics screens to identify metabolic dependencies of KP pancreatic cancer specifically in vivo.
B. Cumulative frequency curve of represented guides in genetic screens.
C. Gene scores of in vivo versus in vitro genetic screens of KP pancreatic cancer growth.
D. Volcano plot of differential gene scores comparing in vivo against in vitro conditions (left). Top 20 genes scoring as differentially required in vivo. Gene involved in specific metabolic pathways are indicated (right).
E. Gene sets enriched in differentially required genes in vivo versus in vitro for pancreatic cancer growth. The heatmap generated by iPAGE represents the extent to which each gene set is enriched among the genes that are essential for tumor growth in vivo.
See also Figure S1.
Our screens also identify a small fraction of metabolic genes that are differentially required during tumor formation (~200 genes, ~7% of all screened genes) (Figure 1D). iPAGE analysis (Goodarzi et al., 2009) to search for the pathways most informative about the observed gene essentiality differences reveals that in vivo metabolic dependencies were enriched with gene modules associated with heme metabolism, oxidative phosphorylation, nucleotide synthesis and antigen presentation (Figures 1D & 1E). Among these are several metabolic genes previously reported to be selectively essential in tumors. For example, glucose transporters (Slc2a1) and electron transport chain components are necessary to enable cancer cell proliferation only under low glucose conditions of the tumor environment (Birsoy et al., 2014). Notably, genes involved in purine and pyrimidine metabolism such as Dhodh and Ppat score as essential, in line with findings that oncogenic Kras supports pancreatic cancer through regulation of nucleotide synthesis and inhibition of nucleotide metabolism slows down tumor growth in vivo (Santana-Codina et al., 2018). Finally, PDACs display high basal autophagic flux (Yang et al., 2014, 2018, 2011), inhibition of which decreases tumorigenicity in vivo. Interestingly, consistent with the higher lipid content of the serum in vivo (Weiss et al., 1986), several lipid synthesis genes, such as ATP citrate lyase (Acly) and hydroxysteroid 17-beta dehydrogenase 12 (Hsd17b12), known to be essential for cancer cell growth in culture were dispensable for tumor growth (Figures S1B & 1C). Reflecting these recently reported vulnerabilities; our screens provide a robust compendium of metabolic dependencies of pancreatic cancer cells in culture and as tumors.
The tissue of origin partly dictates metabolic essentialities in Kras-driven cancers
While environment may impact metabolic phenotypes of tumors, metabolic differences may also result from cell-autonomous factors such as driver mutations or tissue of origin. To address this for tissue of origin, we asked what portion of the metabolic dependencies of Kras-driven pancreatic cancer cells are shared by murine lung cancer cell lines with similar mutational profile. We therefore customized a highly focused sgRNA library encompassing only the top scoring guides in our initial screen (top 40 in vivo essential genes, top 10 in vitro essential genes with 10 sgRNAs per gene and 20 non-targeting control guides) (Figure 2A) and performed a similar screen in a Kras-driven lung cancer cell line. The use of a small focused library enables the use of multiple tumor types and better representation of sgRNAs. Surprisingly, comparison of sgRNA abundance reveals that only few of the metabolic essentialities were similar between the Kras-driven pancreas and lung cancer cells, suggesting that tissue of origin is an important determinant for metabolic dependencies in vivo (Figures 2B & 2C). Specifically, most metabolic dependencies of Kras-driven pancreatic tumors such as purine synthesis and autophagy were not differentially essential in Kras-driven lung tumors (Figure 2D). These findings are also consistent with previous work where tissue context dictates the use of different metabolic routes in mutant Kras-driven cancers (Mayers et al., 2016). Interestingly, among these, sgRNAs for heme synthesis genes (Uros, Cpox, Ppox and Hmbs) were depleted in both lung and pancreas tumors, indicating a generalized environmental pressure imposing the heme dependency regardless of tissue of origin (Figures 2B-D). Given the uncharacterized role of heme metabolism in pancreas cancer and its high score, we next focused our attention on heme synthesis.
Figure 2. The tissue of origin partly dictates metabolic essentialities in Kras-driven cancers.

A. Schematic of focused genetic screens to identify common and different essential metabolic genes for KP pancreatic and KP lung tumor growth in vivo.
B. Top 40 genes scoring as differentially required in vivo in pancreatic tumors aligned to their differential gene scores in KP lung tumors. Genes involved in purine or heme synthesis are indicated. Bars are median differential gene scores with interquartile range. Dots are individual differential guide scores.
C. Gene scores of in vivo KP pancreas tumor growth versus KP lung tumor growth in C57BL/6J mice. Genes involved in purine or heme synthesis are indicated.
D. Guide scores of the indicated genes in the focused in vivo screens from KP pancreas and KP lung tumors.
Heme synthesis is a metabolic dependency of Kras-driven cancer cells specifically in vivo
Our screens yielded heme synthesis as the only common metabolic essentiality in vivo for lung and pancreatic cancer growth, raising the possibility that a common environmental limitation may impose this dependency. Consistent with the screening results, while depletion of Hmbs showed only a modest effect on the proliferation of these cancer cell lines in culture (Figures 3A & 3B), Hmbs loss strongly reduced the sizes of the tumors in vivo (Figure 3C). As heme acts as a cofactor for several enzymes of the electron transport chain (ETC) (Fukuda et al., 2017; Lin et al., 2019), the slight defect in cell growth in vitro could be exacerbated when cells were seeded at a low confluency and could be rescued by the addition of hemin (oxidized heme), pyruvate or the expression of LbNOX, an NADH oxidase that increases NAD+/NADH ratio (Titov et al., 2016) (Figures S2A–D).
Figure 3. Heme synthesis is a metabolic dependency of Kras-driven tumors in vivo.

A. Immunoblot of HMBS in the indicated KP pancreas and KP lung cancer cell lines. GAPDH was used as loading control.
B. Fold change in cell number (log2) of the indicated KP pancreas and KP lung cancer cell lines after culturing in vitro for the indicated durations (mean ± SD, n=3). ***p < 0.001 versus sgControl.
C. Tumor weights of the indicated KP pancreas and KP lung tumors engrafted subcutaneously in C57BL/6J mice (box and whisker, n=8). *p < 0.05, ***p < 0.001 versus sgControl (left). Images of the indicated KP pancreas and KP lung tumors (right).
D. Immunoblot of HMOX1 in KP pancreas and KP lung cancer cells grown in vitro under normoxia, hypoxia (0.5% oxygen) for 48 hrs and in subcutaneous tumors. GAPDH was used as loading control.
E. Immunoblots of HMOX1 and HMBS in the indicated KP pancreas cell lines. GAPDH was used as loading control.
F. Relative tumor weights of the indicated KP pancreas Hmbs_KO tumors engrafted subcutaneously in C57BL/6J mice (box and whisker, n=23). *p < 0.05 versus Control (top). Representative image of the indicated KP pancreas Hmbs_KO tumors (bottom).
G. Schematic of competition assay using PDAC patient derived xenograft cells infected with the indicated sgRNAs. Cells were then engrafted subcutaneously in NSG mice (left). Relative fold change in sgRNA abundance (log2) from the PDX (mean ± SD, n=5). ***p < 0.001 versus sgControl (right).
H. Disease-free survival rates of TCGA PDAC patients with high or low heme synthesis gene expressions. Weighted average expressions of CPOX, HMBS, PPOX and UROS was used (low heme n=83, high heme n=28).
See also Figure S2.
We next asked why cancer cells require heme synthesis specifically in the tumor environment and which environmental factors in vivo may result in this dependency. Heme limitation in tumors may be a result of lower heme availability or an increase in heme degradation (Li and Stocker, 2009). In line with the latter possibility, we observed substantial upregulation of heme oxygenase-I (Hmox1), the rate-limiting enzyme in heme catabolism, in tumors and in hypoxia compared to cultured cancer cells in normoxia (Figure 3D). Heme catabolism and Hmox1 upregulation are highly associated with oxidative stress and hypoxia, conditions observed in the tumor microenvironment (Panchenko et al., 2000). While hypoxia-inducible factor (HIF) regulates many of the cancer cell responses under hypoxia, knocking out Hif1a or Hif2a did not prevent Hmox1 stabilization in this context (Figure S2E). Building upon these observations, we hypothesized that upregulation of Hmox1 proteins, though normally beneficial for tumors (Figures S2F–H), likely makes heme a limiting molecule for tumor growth due to increased heme degradation. To test this possibility, we knocked out Hmox1 in murine pancreatic cancer cells deficient for Hmbs and asked whether heme becomes a limiting metabolite for growth. Supporting this idea, blocking heme degradation by knocking out Hmox1 partially rescued growth inhibition of tumors expressing Hmbs sgRNAs (Figures 3E & 3F).
To translate our findings to a more relevant in vivo model, we next asked whether targeting heme synthesis impacts the growth of patient-derived xenografts (PDXs). For this, we performed an in vivo loss-of-function competition assay using a pool of sgRNAs targeting control genomic regions or the HMBS, CPOX heme synthesis genes and PPAT purine synthesis gene as a positive control. Consistently, sgRNAs targeting the heme synthesis genes, but not those of controls, strongly inhibited the growth of tumors derived from the KRAS mutant pancreas PDXs (Figure 3G). Notably, using heme synthesis genes as a combined signature for scoring samples in the TCGA-PAAD dataset revealed a significant association between higher expression of heme synthesis genes and lower disease-free survival compared to the group with lower expression (p=0.05) (Figure 3H). Taken together, our results identify heme synthesis as a metabolic liability imposed by the tumor microenvironment, independent of tissue of origin.
Identification of metabolic genes that are essential for pancreatic cancer immune evasion
We next asked whether any of the in vivo essential genes scored due to the presence of the immune system. As pancreatic tumors have immunosuppressive environments and are generally resistant to immunotherapy (Ryan et al., 2014), we hypothesized that a subset of the scoring metabolic genes may be involved in immune evasion and that their loss should enhance immune-mediated killing of cancer cells. To identify such genes, we repeated our genetic screens in immunodeficient NOD-SCID gamma (NSG) mice lacking mature T, B and natural killer (NK) cells and compared these hits to those obtained in immunocompetent mice (Figure 4A). Confirming the robustness of the screens, most genes scored similarly with a correlation of r=0.892 (Figure 4B).
Figure 4. Autophagy is an immune-dependent metabolic liability and enables immune evasion in PDAC.

A. Schematic of focused genetic screens to identify immune-dependent metabolic liabilities of KP pancreatic tumor growth in vivo.
B. Gene scores of in vivo KP pancreas tumor growth in immunodeficient NSG mice versus immunocompetent C57BL/6J mice.
C. Top 5 genes scoring as differentially required for KP pancreas tumor growth in immunocompetent mice compared to immunodeficient mice. Genes involved in TAP complex are indicated in blue. The autophagy gene Atg7 is indicated in red.
D. Immunoblots of ATG7 and LC3B in the indicated KP pancreas cell lines. GAPDH was used as loading control.
E. Tumor weights of the indicated KP pancreas Atg7_KO tumors engrafted subcutaneously in the indicated mice (box and whisker, n=8). **p < 0.01, ***p < 0.001 versus Atg7 addback (left). Image of the indicated KP pancreas Atg7_KO tumors from the indicated mice (right).
F. Immunohistochemical staining of cleaved-CASPASE-3 in the indicated KP pancreas Atg7_KO tumors engrafted subcutaneously in C57BL/6J mice. Representative images are shown. Scale bar, 230 μm.
G. Percentage of IFNγ+ activated CD8+ T cells (left) or and NK cells (right) extracted from the indicated KP pancreas Atg7_KO tumors engrafted subcutaneously in C57BL/6J mice (mean ± SD, n=5). *p < 0.05, ***p < 0.001 versus Atg7 addback.
H. Tumor weights of the indicated KP pancreas Atg7_KO tumors engrafted orthotopically in the pancreas of C57BL/6J mice (box and whisker, n=12). **p < 0.01 versus Atg7 addback (left). Representative image of the orthotopic KP pancreas Atg7_KO tumors from the indicated mice (right).
I. Relative cell count of the indicated OVA-expressing KP pancreas Atg7_KO cell lines after co-culturing with activated OT-I CD8+ T cells for 48 hrs at the indicated E:T ratios (mean ± SD, n=3). Counts were normalized to the average of the monocultured cells of the same line. ***p < 0.001 versus Atg7 addback.
See also Figure S3.
Among the top genes differentially essential for tumor growth in immunocompetent mice were Tap1 and Tapbp, genes required for the loading of antigen-derived peptides onto major histocompatibility complex (MHC) class I molecules for presentation (Figures 4B & 4C). In previously published work, loss of Tap proteins strongly blocks CD8+ T cell-mediated killing of cancer cells in co-culture assays in vitro (Kearney et al., 2018; Patel et al., 2017). However, our in vivo screens suggest that loss of key MHC class I-related genes has an opposite effect possibly because loss of MHC class I expression downstream of Tap1 (Figure S3A) and Tapbp deletion can promote the killing of tumor cells by NK cells (Wu and Lanier, 2003). The only other hit from our screen was Atg7, a key enzyme involved in macroautophagy (Figures 4B & 4C). Of note, a similar autophagy gene, Atg5, also scored in our initial screen (Figure S3B, Table S1), raising the possibility that autophagy may be a key process for immune evasion or immune-mediated cell death. As our screens did not result in any high scoring metabolic pathways in anabolic or catabolic pathways other than autophagy, these results argue that cancer cell metabolism may not be a major driver for immune evasion in mouse pancreatic cancers.
Pancreatic cancer cells display elevated autophagy, and inhibition of which suppresses tumor growth in xenografts (Guo et al., 2011; Perera et al., 2015) and genetically engineered mouse models (GEMM) (Yang et al., 2014, 2018, 2011). While several mechanisms have been proposed regarding how autophagy sustains pancreatic tumor growth (Amaravadi et al., 2016), the precise reason for the autophagy dependency of PDACs is not fully understood. Consistent with the previous findings, macroautophagy was dispensable for the growth of Kras mutant pancreatic cancer cells in culture (Eng et al., 2016) (Figure S3B). In contrast, Atg7 deficient tumors in immunocompetent C57BL/6J mice were substantially smaller compared to those expressing sgRNA resistant Atg7 cDNA (Figures 4D & 4E). Remarkably, this difference is dependent on the presence of lymphocytes, as the effect is completely abolished in NSG mice and mostly lost in Rag1-null mice, which lack mature T and B cells but not NK cells (Figure 4E, Figure S3C). Similar to the mouse pancreatic cell line, ATG7 loss in human KRAS mutant pancreatic tumors did not reduce tumor growth in NSG mice (Figures S3D & S3E). Immunohistochemical staining of tumor sections and immunoblotting showed increased caspase-3 cleavage in Atg7 deficient tumors (Figures 4F & S3F), suggesting an immune-mediated increase in cell death. While we did not observe any increase in CD8+ T cell infiltration into Atg7 deficient tumors (Figure S3G) or increases in the proportions of CD8+, CD4+ or NK cells within the infiltrating immune cells (Figures S3H–J), immune profiling showed an increase in IFNγ expression by both CD8+ T cells and NK cells (Figures 4G & S3K), in line with the small but significant decrease of tumor size in Rag1-null mice and the larger decrease in NSG mice. Notably, ATG7 expression may be a predictive factor for patient outcomes, as pancreas cancer patients with low ATG7 expression have significantly higher disease-free survival rates compared to patients with high ATG7 expression (Figure S3L). A similar growth difference between Atg7 deficient and proficient cells was observed in orthotopically injected tumors in the pancreas of C57BL/6J mice (Figure 4H). Finally, consistent with the increased IFNγ expression by CD8+ T cells, loss of Atg7 sensitized pancreatic cancer cells expressing ovalbumin (OVA) antigen to OT-I T cell receptor-transgenic CD8+ T cell-mediated killing in co-culture experiments (Figures 4I, S3M & S3N). Altogether, these results support a role for autophagy in PDAC immune evasion.
Autophagy enables tumor immune evasion by increasing TNFα resistance
We next sought to understand how Atg7 loss would enhance immune cell-mediated killing in pancreatic cancer cells. As presentation of neoantigens by MHC class I molecules enables detection of cancer cells by CD8+ T cells, autophagy inhibition may disrupt antigen presentation and promote immune evasion, as previously suggested (Loi et al., 2016; Yamamoto et al., 2020). However, we did not detect substantial differences in MHC-I protein levels or surface expression in either mouse or a subset of human pancreatic cancer cell lines when stimulated with IFNγ (Figures S4A–H). Autophagy inhibition has also been suggested to increase the expression of programmed death-ligand 1 (PD-L1) but we did not observe any change in surface PD-L1 upon loss of autophagy (Figure S4I). To investigate alternative pathways that may lead to resistance to immune-mediated killing, we analyzed the transcriptome of Atg7 deficient tumors and their isogenic counterparts complemented with Atg7 cDNA using RNA-sequencing. Remarkably, iPAGE analysis revealed a strong enrichment for immune response pathways that are upregulated upon autophagy loss including gene sets that respond to TNFα or IFNγ, raising the possibility that Atg7 loss may enhance the sensitivity of tumor cells to these cytokines (Figures 5A, S4J–L, Table S2).
Figure 5. Autophagy enables tumor immune evasion by increasing TNFα resistance.

A. RNAseq analysis of KP pancreas Atg7_KO tumors. Gene sets enriched in transcriptome of KP pancreas Atg7_KO tumors compared to Atg7 addback tumors engrafted subcutaneously in C57BL/6J mice (n=3). Immune-related gene sets are boxed in red.
B. Relative cell count of indicated KP pancreas Atg7_KO cell lines treated for 48 hrs with 100 ng/mL TNFα or 100 ng/mL IFNγ (mean ± SD, n=3). Counts were normalized to the average of the untreated cells of the same line. ***p < 0.001 versus Atg7 addback.
C. Relative cell count of indicated human pancreatic cancer MIA PaCa-2, PANC-1 and PATU-8988T cell lines treated for 48 hrs with 100 ng/mL, 200 ng/mL and 600 ng/mL TNFα respectively (mean ± SD, n=3). Counts were normalized to the average of the untreated cells of the same line. **p < 0.01, ***p < 0.001 versus wild type.
D. Immunoblot of CASPASE-8, cleaved CASPASE-8 and CASPASE-3 in the indicated KP pancreas Atg7_KO cell lines treated for 24 hrs with 100 ng/mL TNFα. GAPDH was used as loading control.
E. Immunoblot of TNFRSF1A in the indicated KP pancreas Atg7_KO cell lines. GAPDH was used as loading control.
F. Relative cell count of indicated KP pancreas Atg7_KO cell lines treated for 48 hrs with 100 ng/mL TNFα (mean ± SD, n=3). Counts were normalized to the average of the untreated cells of the same line. ***p < 0.001.
G. Relative cell count of KP pancreas cells treated for 48 hrs with 100 ng/mL TNFα or 50nM Bafilomycin A1 (BafA) (mean ± SD, n=3). Counts were normalized to the average of the untreated cells or those treated with BafA. ***p < 0.001.
H. Relative cell count of the indicated OVA-expressing KP pancreas Atg7_KO cell lines after co-culturing with activated OT-I CD8+ T cells for 48 hrs at the indicated E:T ratios with or without 40 μg/mL anti-TNFα (mean ± SD, n=3). Counts were normalized to the average of the untreated monocultured cells of the same line. ***p < 0.001 versus untreated cells.
See also Figures S4 & S5.
Building upon this observation, we asked whether autophagy protects cancer cells from cytokine-mediated cytotoxicity. Cell growth assays of pancreatic cancer cell lines with cytokines revealed that autophagy null PDAC cells are oversensitive to TNFα, but not to IFNγ (Figures 5B, 5C & S5A) and undergo Rip1-independent apoptosis upon TNFα treatment as assessed by immunoblotting of caspase-8 and caspase-3 cleavage (Figures 5D, S5B–S5D). While a change in the surface expression of the canonical receptor Tnfrsf1a may explain the protective effect of autophagy, we did not observe any differences in protein or surface expression levels of Tnfrsf1a in Atg7 null cells (Figures 5E & S5E). Furthermore, CRISPR mediated knock out of the canonical receptor Tnfrsf1a completely abolished the sensitivity of autophagy deficient cells to TNFα (Figure 5E). Knock out of the alternate receptor Tnfrsf1b did not affect the sensitivity of autophagy deficient cells (Figure S5F), suggesting that autophagy may be specifically regulating the downstream response to Tnfrsf1a. This effect could also be recapitulated through pharmacological inhibition of autophagy with bafilomycin A1 or in autophagy deficient KP lung cancer cells and was independent of any secreted factors, supporting a generalized cell-autonomous link between autophagy and TNFα sensitivity (Figures 5G & S5G–I). Notably, consistent with both pro-apoptotic and pro-survival effects of TNFα signaling on tumors in vivo (Wang and Lin, 2008), expression of Tnfrsf1a sgRNAs in the pancreatic cancer cells severely reduced tumor growth regardless of autophagy proficiency (Figure S5J).
Finally, we tested whether TNFα sensitivity accounts for the increased T-cell killing of autophagy deficient mouse pancreatic cancer cells in an antigen specific in vitro co-culture assay. Specifically, we used an OVA antigen-expressing pancreatic cancer cell line as a target cell and OT-I CD8+ T cells as the effector cells. Atg7 null cells and their Atg7 expressing counterparts were co-cultured with OT-I CD8+ T cells for 48 hrs in the presence or absence of a neutralizing anti-mouse TNFα antibody. The remaining live cancer cells were counted after co-culture and revealed that the oversensitivity of autophagy deficient cancer cells to CD8+ T cells was completely rescued by addition of the anti-TNFα neutralizing antibody (Figure 5H). Altogether, these results suggest that autophagy protects PDAC cells from cell death resulting from TNFα secreted by immune cells such as CD8+ T cells.
Conclusion
Using parallel loss-of-function screens, our study provides a comparative compendium of metabolic dependencies of pancreatic cancer cells grown in culture and as tumors. Surprisingly, the high degree of correlation between metabolic essentialities in vitro and in vivo suggests that culture conditions may recapitulate a substantial portion of the metabolic dependencies in tumors and may provide a reasonable approximation to study cancer metabolism. However, our work also identify a subset of metabolic dependencies unique to the tumor environment and shared by both Kras mutant pancreatic and lung cancer cells. In particular, we discovered heme synthesis as a common metabolic liability in tumors, indicating the significance of recent efforts to better model tumor nutrient conditions (Cantor et al., 2017; Vande Voorde et al., 2019). This is likely due to upregulation of Hmox1 through hypoxia or ROS, which imposes a stronger demand for heme availability in subcutaneously engrafted tumors. Interestingly, Hmox1 has previously been shown to be regulated by multiple stress conditions and signaling pathways (Alam and Cook, 2007). For example, lung tumors upregulate Hmox1 through activation of NRF2, the master regulator of the antioxidant response pathway (Lignitto et al., 2019). Despite this, the precise mechanism for Hmox1 upregulation in different tumor contexts remains to be identified.
Consistent with the strong impact of the tissue of origin on metabolism, most dependencies we identified in this work were specific to pancreatic cancer cells and not observed in lung cancers (Vander Heiden and DeBerardinis, 2017). Remarkably, among all the scoring pathways, autophagy was the only metabolic process that enabled pancreatic cancer cells to evade the immune system. While our experiments suggest a protective role for autophagy from TNFα-mediated cell death, previous work suggests that autophagy is also involved in MHC-I presentation and impacts the trafficking of surface MHC-I molecules (Loi et al., 2016; Yamamoto et al., 2020). Given that the effect of autophagy loss on MHC-I expression is variable in different cell lines, autophagy may enable immune evasion through multiple mechanisms depending on the context. Furthermore, the complexity of the tumor microenvironment does not preclude that a combination of MHC-I presentation and cytokine insensitivity both may play roles in immune evasion.
While loss of autophagy increases the TNFα sensitivity of pancreatic cancer cell lines, the exact mechanism of this enhanced sensitivity and how autophagy protects cells from cytokine mediated death are not well understood. Though several studies have associated autophagy with TNFα signaling in other cell types due to increased necroptosis (Lim et al., 2019) or Rip1-dependent apoptosis (Orvedahl et al., 2019), our results show a similar phenotype in pancreatic cancer cells independent of Rip1. These findings suggest that autophagy may be associated with other downstream TNFα adaptor proteins. TNFα is a multifunctional cytokine that has been shown to both promote and suppress tumor growth in different contexts (Wang and Lin, 2008). Consistent with this, blocking TNFα in vivo is disruptive to tumor growth and may mask the effect of autophagy loss on TNFα-mediated apoptosis. Future work is required to determine downstream adaptor proteins, which may improve our understanding of how autophagy protects cells from TNFα mediated cell death and lead to therapeutic strategies. Since many pancreatic cancers display high autophagic flux and have immunosuppressive environments, we reveal an underappreciated facet of targeting autophagy-associated immunomodulation of pancreatic tumor growth, which may be effectively combined with current immunotherapies. Altogether, our screens reveal metabolic dependencies arising from microenvironmental limitations and the immune system, providing a resource for potential metabolism based anti-cancer strategies.
Limitations of Study
We are aware of several limitations to our screening approach. As in vivo screening approach for a comprehensive CRISPR library requires a large number of tumors to achieve efficient representation of guides, we used subcutaneous tumors rather than orthotopic counterparts or GEMMs, which are physiologically more relevant. While it is possible that we may have missed some organ-specific metabolic liabilities, our screens still provide a valuable resource for the comparison of metabolic dependencies of pancreatic cancer cells in culture and in vivo. Indeed, the role of autophagy on immune evasion could be recapitulated by orthotopic injections into pancreas. Additionally, it should be noted that, within large-scale pooled CRISPR screens, we culture a population of knock-out cells with those that still express the functional gene product. This heterogeneity may enable the transfer of metabolites and growth factors and may mask certain dependencies under culture conditions. Though we did not observe proliferation defects in autophagy deficient cells in vitro, we do not rule out the possibility that other signaling pathways may be compensating for the metabolic defect (Towers et al., 2019). Finally, the number of cell lines used in this study is limited. Therefore, metabolic limitations and downstream mechanisms we identified may not be generalizable to all KP pancreas and lung tumors. We also mainly used engrafted tumor cells and not GEMMs, which can best recapitulate tumor biology even from an early initiation step. As new screening techniques emerge, more advanced genetic screens, especially in GEMMs, would enable us to better identify metabolic dependencies of individual tumor types in their natural context.
STAR Methods
Lead Contact
Further information and requests for resources and reagents should be directed to and will be fulfilled by the Lead Contact, Kıvanç Birsoy (kbirsoy@rockefeller.edu).
Materials Availability
CRISPR Cas9 sgRNA KO mouse metabolism library generated in this study has been deposited to Addgene (ID 160129). All other plasmids generated in this study can be requested from the Lead Contact.
Data and Code Availability
The RNAseq dataset generated in this study is available at GEO (accession number GSE158707).
Experimental Model and Subject Details
Cell culture
The female mouse cell lines KP panc and KP lung were kindly provided by Dr. Nabeel M. Bardeesy (Massachusetts General Hospital Cancer Center). Human cells lines AsPC-1, MIA-PaCa-2, PATU-8988T and HEK293T were purchased from the ATCC. Cell lines were verified to be free of mycoplasma contamination and the identities of all were authenticated by STR profiling. KP panc, KP lung and AsPC-1 cells were maintained in RPMI media (Gibco) containing 2 mM glutamine, 10% fetal bovine serum, 1% penicillin and streptomycin. MIA PaCa-2, PATU-8988T and HEK293T cells were maintained in DMEM media (Gibco) containing 4.5g/L glucose, 110mg/L pyruvate, 4mM glutamine, 10% fetal bovine serum, penicillin and streptomycin.
Mouse studies
All animal studies and procedures were conducted according to a protocol approved by the Institutional Animal Care and Use Committee (IACUC) at the Rockefeller University. All mice were maintained on a standard light-dark cycle with food and water ad libitum. All treatment studies were randomized and injections were performed by blinded investigators. Subcutaneous tumor growth experiments were performed by injecting subcutaneously into the flanks of female 6–8-week-old C57BL/6J, Rag1 KO or NOD scid gamma (NSG) mice (The Jackson Laboratory), unless otherwise indicated at 1–2 × 10⁶ cells in 100 uL 40% Matrigel (Corning). Mice were sacrificed and tumors were dissected after 2–3 weeks. In no cases did any tumor size surpass the limit permitted by our protocol (2 cm). The immune-dependent difference we observed is not due to rejection by mice of the opposite gender as almost identical results were obtained in C57BL/6J mice of both genders (Figure S3C). For orthotopic pancreas injections, mice were anaesthetized by an intraperitoneal injection of ketamine. A small incision was made on the upper left quadrant of the abdomen and the pancreas was externalized. Cells were suspended in 50 μl of Matrigel : PBS (1:1) solution and injected into the pancreatic tail with insulin syringes (29-gauge needle, BD). Approximately 1 × 10⁵ KP panc cells were injected and after the procedures, the peritoneum was closed with a 3–0 Vicryl Violet suture (Ethicon), and the skin was closed using the BD AutoClip Wound Closing System (BD). Mice were sacrificed and tumors were dissected after 2 weeks.
CRISPR-based screens
The metabolism and focused sgRNA libraries were designed and screens were performed as previously described (Garcia-Bermudez et al., 2019; Zhu et al., 2019). Focused sgRNA screens for KP panc and KP lung cell lines in C57BL/6J and NSG mice were carried out together. Oligonucleotides for sgRNAs were synthesized by CustomArray Inc. and amplified by PCR. For in vivo screens, library infected cells were injected subcutaneously into the flanks of 6–8-week-old C57BL/6J or NOD scid gamma (NSG) mice (The Jackson Laboratory) at 1 × 10⁶ cells in 100 uL 40% Matrigel. Tumors were grown for 2–3 weeks and gDNAs were extracted with DNeasy Blood & Tissue Kit (Qiagen). gDNAs from 4 tumors were pooled as one sample and amplified by PCR. PCR amplicons were then sequenced together with the initial and in vitro samples as per standard in vitro CRISPR-based screens. We then performed PCA analysis on normalized counts from each mouse, as well as the initial and in vitro samples. Based on this outlier analysis, one of the mice was filtered from the downstream analysis. Sequencing counts from in vivo tumor samples were then summed, normalized (count per million), and analyzed as a single condition. The fitness score for each guide was calculated as log2 ratio of normalized counts. The median of the guides was used as the fitness score for each gene, and t test was used to assess whether the guides were significantly deviating from 0. For iPAGE analysis of fitness scores between in vivo and in vitro screens, the differential scores across all genes were used as input to iPAGE with the following parameters: ebins=3, max_p=0.05, and using MSigDB c2 gene sets. A complete list of differential gene scores for each screen is provided in Table S1.
Immunoblot
Cell pellets were washed twice with ice-cold PBS prior to lysis in RIPA buffer (10 mM Tris-Cl pH 7.5, 150 mM NaCl, 1 mM EDTA, 1% Triton X-100, 0.1% SDS) supplemented with protease inhibitors and phosphatase inhibitors (Roche). For tumor tissue samples, 50 mg tissues were taken from each sample and homogenized in RIPA buffer by Bead Ruptor 24 (Omni International). Each lysate was sonicated and, after centrifugation for 5 min at 4°C and 20,000 x g, supernatants were collected. Sample protein concentrations were determined by using Pierce BCA Protein Assay Kit (Thermo Scientific) with bovine serum albumin as a protein standard. Samples were resolved on 12% or 10–20% SDS-PAGE gels and analyzed by immunoblotting as previously described(Birsoy et al., 2014).
Generation of knock-out and cDNA overexpression cell lines
sgRNAs (oligonucleotide sequences are indicated in Table S3) were cloned into lentiCRISPR-v2 linearized with BsmBI by T4 ligase (NEB). sgRNA expressing vector along with lentiviral packaging vectors Delta-VPR and CMV VSV-G were transfected into HEK-293T cells using the XTremeGene 9 transfection reagent (Roche). Similarly, for overexpression cell lines, gBlocks (IDT) containing the cDNA of interest were cloned into pMXS linearized with BamHI and NotI by Gibson Assembly (NEB). cDNA vectors along with retroviral packaging vectors gag-pol and CMV VSV-G were transfected into HEK-293T cells. The virus-containing supernatant was collected 48 hrs after transfection and passed through a 0.22 μm filter to eliminate cells. Target cells in 6-well tissue culture plates were infected in media containing 8 μg/mL of polybrene and a spin infection was performed by centrifugation at 2,200 rpm for 1 hour. Post-infection, virus was removed and cells were selected with puromycin or blasticidin. For Atg7 knockout cells, after selection, cells were single-cell diluted into the wells of a 96-well plate. Cells were grown for two weeks, and the resultant colonies were expanded. Clones were validated for loss of the relevant protein via immunoblotting.
Cell proliferation and survival assays
For cell proliferation assays with KP panc and KP lung cells, cells were plated in triplicates in 6-well plates at 10000 cells/well. Cells were dissociated with trypsin at the indicated days and counted by Z2 Coulter Counter (Beckman). 300000 cells/well were then plated in new plates and counted again at the indicated days. For survival assays with chemical treatments, cells were plated in triplicates in 12-well plates and allowed to adhere for 2 hrs before adding chemicals. Chemicals were added on the day of plating unless otherwise indicated. Cells were plated at 200000 cells/well and counted after 2 days or plated at 100000 cells/well and counted after 3 days.
Patient-derived pancreatic cancer xenografts
PDX model was described previously(Yamaguchi et al., 2019). Low passage PDX pancreatic tumor was chopped finely with a scalpel and placed in a 50 ml conical tube with a solution of Dulbecco’s Modified Eagle Medium (Gibco) supplemented with 10% v/v fetal bovine serum (Corning), L-+glutamine (2 mM; Gibco), penicillin-streptomycin (100 U/ml; Gibco), Amphotericin (1 μg/ml; Lonza), sodium pyruvate (1 mM; Gibco) and Collagenase, Type IV (200 U/ml; Worthington) and placed in a 37°C shaker at 220 rpm for 30 min. After centrifugation and removal of supernatant, the sample was subjected to ACK lysis buffer (Lonza) for 3 min at room temperature to remove red blood cells. After centrifugation and removal of ACK lysis buffer, the sample was subjected to a density gradient with Optiprep (1114542, Axis-Shield) to remove dead cells. The sample was washed in media and subjected to a 100-μm cell strainer and followed by a 70-μm cell strainer. Mouse cells were removed from the single-cell suspension via magnetic-associated cell sorting using the Mouse Cell Depletion Kit ((130–104-694, Miltenyi), resulting in a single-cell suspension of predominantly pancreatic cancer cells of human origin. 10 million PDX pancreatic cancer cells were transduced with the indicated sgRNA library and washed with PBS. Cells were resuspended in cold PBS with 50% Matrigel and one million cells were injected subcutaneously into NSG mice. When the tumors reached palpable size (70 mm3), mouse was euthanized and the tumors were removed and sectioned in a manner similar to the in vivo CRISPR-based screens.
Immunohistochemistry
Tumor samples were removed from mice at the time of sacrifice and fixed in 10% buffered formalin for 48 hrs. Samples were maintained in 70% ethanol. Fixed tumor samples were then embedded in paraffin, sectioned and stained with the indicated antibodies.
Immune profiling of tumors
Tumors were excised and digested for one hour at 37°C with 400U/ml of collagenase D (Roche). Hematopoietic cells enrichment was achieved by density gradient centrifugation with 40/90 Percoll (GE Healthcare Life Sciences) for 25 min at 2500rpm at 22°C with zero breaks. Interphase containing the hematopoietic cells was isolated and washed with PBE. Red cell lysis was performed with ACK lysis buffer (GIBCO). For cytokine staining, cells were incubated at 37°C for 4h in complete RPMI media supplemented with Brefeldin A (Sigma), phorbol 12-myristate 13-acetate (PMA) (Sigma) and Ionomycin (Sigma). After incubation cells were washed with PBE. Cells were incubated for 5 min with 1ug/ml of anti-CD16/32 (2.4G2, BioXcell) at room temperature. Cells were washed with PBS and stained with Zombie fixable viability dye (Biolegend) for 15 min at room temperature. Cells were washed with PBE and stained with appropriate surface markers antibodies for CD4 and CD8 T cells and NK cells for 20 min at 4°C. Cells were washed with PBE fixed and permeabilized with Cytofix/Cytoperm kit (BD). Intercellular staining for IFNγ and TNFα was performed for 30 min at 4°C. Cells were washed and resuspended in PBE. Samples were acquired on the BD FACSymphony. Data were analyzed using FlowJo v.10.0.8 software.
OT-I T cell co-culture
OT-I T cells were isolated from OT-I transgenic mice (The Jackson Laboratory) by extracting cells from lymph nodes using the CD8a+ T Cell Isolation Kit (Miltenyi Biotec) and following manufacturer’s instructions. T cells were cultured in T cell media (RPMI media (Gibco) containing 2 mM glutamine, 10% fetal bovine serum, 1% penicillin and streptomycin, 1 mM pyruvate, 50 μM 2-mercaptoethanol and 1X MEM Amino Acids Solution (Gibco) with 20 ng/mL IL-2). T cells were activated by Dynabeads Mouse T-Activator CD3/CD28 (Thermo Fisher Scientific) and allowed to proliferate for 6 days. One day prior to co-culture, KP panc cancer cells were seeded in 12-well plates at 50000 or 100000 cells/well with 100 ng/mL IFNγ. The following day, each well with cancer cells was changed to 500 μL fresh media. Activated CD8+ T cells were resuspended in the indicated E:T ratios and added to each well in 500 μL T cell media. After 48 hrs, T cells were washed off and cancer cells were counted. For flow cytometry of apoptotic cells, cancer cells were dissociated and washed with PBS. Cells were stained for 15 min at room temperature in the dark with APC Annexin V (BioLegend) and resuspended in PBS with DAPI. Cells were analyzed on a LSRFortessa (BD Biosciences).
Flow cytometry
For staining of MHC-I, cells were treated for 24 hrs with the indicated concentration of IFNγ and one million cells were resuspended in PBS supplemented with 0.5% BSA and 2mM EDTA (PBE). Cells were incubated for 5 min with 1ug/ml of anti-CD16/32 (2.4G2, BioXcell) at room temperature. Cells were washed with PBS and stained with Zombie fixable viability dye (Biolegend) 15 min at room temperature. Cells were washed with PBE and stained with PE anti-mouse H-2Kb/H-2Db or PE anti-human HLA-A,B,C (Biolegend) antibody for 20 min at 4°C. Cells were washed and resuspended in PBE. Samples were acquired on the BD FACSymphony. Data were analyzed using FlowJo v.10.0.8 software.
For staining of TNFRI, one million cells were resuspended in PBS supplemented with 1% BSA and 1mM EDTA (FACS buffer). Cells were washed with FACS buffer and stained with APC anti-mouse TNFRI (Biolegend) antibody for 15 min at 4°C in the dark. Cells were washed and resuspended in FACS buffer with 60 ng/mL DAPI. Samples were acquired on the BD FACSymphony. Data were analyzed using FlowJo v.10.0.8 software.
RNAseq
For in vitro samples, cells were cultured as indicated and RNA was extracted using RNeasy mini kit (Qiagen) following manufacturer’s protocol. For tumor samples, tumors were dissected 2 weeks after injection. A 20 mg tissue from each sample was homogenized using Bead Ruptor 24 (Omni International) and RNA was processed using RNeasy mini kit following manufacturer’s protocol. Purified total RNA was cleaned up and mRNA was sequenced by NextSeq High Output. For analysis, reads were mapped to the mouse transcriptome (mm10, Ensembl annotations) using STAR (v2.7). FeatureCounts (v1.6) was used to count exonic reads (with -O option) and DESeq2 v1.20 (R v3.5.1) was used to normalize and compare samples. PCA plots were generated using the plotPCA function (DESeq2) after variance stabilization and dispersion estimation. Log-fold changes across all genes were used as input to iPAGE with the following parameters: ebins=9, max_p=0.005, and using MSigDB h gene sets (i.e. the Hallmarks gene set collection).
Survival Analysis
TCGA-PAAD gene expression data (FPKM, downloaded from Genomic Data Commons on 10/13/2016) and the associated clinical data (cBioportal) were used to perform survival analysis. For gene signatures, the expression of each gene was first z-score normalized and the signature score was calculated as the weighted sum of the z-scores. Given the short survival of PAAD patients, the analysis was limited to 3 years. To determine the separation threshold, the samples were divided based on their signature score or expression levels at every value between the 10th and 90th percentiles. Survival analysis was then performed using the survdiff function (survival package in R) and the value with the lowest p-value was selected as the threshold. The function survfit was then used to perform the analysis at that threshold and visualize the Kaplan-Meier plot.
Immunofluorescence
For immunofluorescence assays in glass-bottom 8-well slides, cells were seeded at 7500 cells per well after pretreating the glass with fibronectin. 24 hours later, cells were treated with 70 ng/mL IFNγ. After 22 hours, cells were stained with anti-H-2Kb/H-2Db antibody (1:200, Biolegend) for 2h at 37°C before fixing with 4% paraformaldehyde in PBS for 10 min at room temperature. After three washes with PBS, cells on coverslips were permeabilized and blocked by incubation with 0.2% Triton-X in PBS + 5% normal donkey serum (NDS) for 1 hour at room temperature, shaking. Cells on coverslips were subsequently incubated with anti-H-2Kb/H-2Db 1:200 for 16 hours at 4°C before washing 3 times with PBS. Coverslips were then incubated with secondary (Alexa Fluor 568 antimouse) 1:500 in 5% NDS + 0.2% Triton in PBS for 1 hr and washed 3 times with PBS. Finally, coverslips were mounted onto slides with Prolong Gold Antifade mounting media (Invitrogen).
Confocal images were acquired with a Zeiss inverted LSM 780 laser scanning confocal microscope (Zeiss) using a 63x/1.4 DIC Plan-Apochromat oil immersion objective. Images were obtained with excitation and emission wavelengths as follows: DAPI 405–464, Alexa Fluor 568 561–605. The images are 1192 × 1192 pixels with a pixel depth of 16-bit, with a pixel size of 14.0204μm per pixel, a dwell time of 1.58μs, a pinhole size of 11.2 (1Airy unit), and a line averaging of 1.
Statistical Analysis
Sample size, mean, and significance p values are indicated in the text and figure legends. Error bars in the experiments represent standard deviation (SD) from either independent experiments or independent samples. Student’s t test was used for comparisons with single variable. ANOVA was used for comparisons with two or more variables. Statistical analyses were performed using GraphPad Prism 7 or reported by the relevant computational tools.
Supplementary Material
KEY RESOURCES TABLE
| REAGENT or RESOURCE | SOURCE | IDENTIFIER |
|---|---|---|
| Antibodies | ||
| HMBS | GeneTex | GTX113460, RRID:AB_10617763 |
| GAPDH | Cell Signaling Technology | 2118, RRID:AB_561053 |
| HMOX1 | Proteintech | 10701-1-AP, RRID:AB_2118685 |
| ATG7 | Cell Signaling Technology | 8558, RRID:AB_10831194 |
| LC3B | Cell Signaling Technology | 3868, RRID:AB_2137707 |
| Caspase-8 | Cell Signaling Technology | 4790, RRID:AB_10545768 |
| Cleaved caspase-8 | Cell Signaling Technology | 8592, RRID:AB_10891784 |
| Caspase-3 | Cell Signaling Technology | 9665, RRID:AB_2069872 |
| TNF-R1 | Cell Signaling Technology | 13377, RRID:AB_2798194 |
| FLAG M2 | Sigma-Aldrich | F1804, RRID:AB_262044 |
| Anti-mouse H-2Kb/H-2Db | BioLegend | 114602, RRID:AB_313593 |
| PE anti-mouse H-2Kb/H-2Db | BioLegend | 114607, RRID:AB_313598 |
| Anti-mouse H-2Kb | Dr. Jon Yewdell | |
| PE anti-human HLA-A,B,C | BioLegend | 311405, RRID:AB_314874 |
| PE anti-mouse PD-L1 | BioLegend | 124307, RRID:AB_2073557 |
| RIP | Cell Signaling Technology | 3493, RRID:AB_2305314 |
| Phospho-RIP (Ser166) | Cell Signaling Technology | 31122, RRID:AB_2799000 |
| BUV395 Rat Anti-Mouse CD45 | BD Biosciences | 564279, RRID:AB_2651134 |
| Brilliant Violet 605 anti-mouse CD8a | BioLegend | 100744, RRID:AB_2562609 |
| Brilliant Violet 711 anti-mouse CD3ε | BioLegend | 100349, RRID:AB_2565841 |
| Brilliant Violet 785 anti-mouse NK-1.1 | BioLegend | 108749, RRID:AB_2564304 |
| Brilliant Violet 421 anti-mouse CD4 | BioLegend | 100438, RRID:AB_11203718 |
| APC anti-mouse IFN-γ | BioLegend | 505810, RRID:AB_315404 |
| APC anti-mouse TNF-R1 | BioLegend | 113005, RRID:AB_2208780 |
| Anti-mouse CD16/CD32 | BioXCell | BE0307, RRID:AB_2736987 |
| Peroxidase Goat Anti-Rabbit IgG (H+L) | Jackson ImmunoResearch Labs | 111-035-144, RRID:AB_2307391 |
| m-IgGκ BP-HRP | Santa Cruz | sc-516102, RRID:AB_2687626 |
| Anti-Rabbit Secondary Antibody, Alexa Fluor 488 | Thermo Fisher | A21206, RRID:AB_141708 |
| Bacterial and Virus Strains | ||
| NEB Stable Competent E. coli | NEB | C3040 |
| Chemicals, Peptides, and Recombinant Proteins | ||
| RPMI 1640 | Gibco | 11875 |
| DMEM | Gibco | 11965 |
| Trypsin | Gibco | 25200 |
| Penicillin-Streptomycin | Gibco | 15140122 |
| FBS | Sigma | 12306C |
| Phusion High-Fidelity PCR Master Mix with HF Buffer | NEB | M0531 |
| BsmBI | NEB | R0580 |
| T4 DNA Ligase | NEB | M0202 |
| X-tremeGENE 9 DNA Transfection Reagent | Roche | 6365779001 |
| BamHI | NEB | R3136 |
| NotI | NEB | R3189 |
| Polybrene | Sigma | H9268 |
| Puromycin | Sigma | P8833 |
| Blasticidin | Invivogen | ant-bl |
| Matrigel Growth Factor Reduced | Corning | 354230 |
| MEM Amino Acids Solution (50X) | Thermo Fisher | 11130 |
| Normal donkey serum | Jackson ImmunoResearch | 017-000-121 |
| Recombinant Mouse IL-2 | BioLegend | 575404 |
| Dynabeads Mouse T-Activator CD3/CD28 | Thermo Fisher | 11456D |
| Recombinant Mouse IFN-γ | BioLegend | 575306 |
| Recombinant Human IFN-γ | BioLegend | 570206 |
| APC Annexin V | BioLegend | 640920 |
| DAPI | Thermo Fisher | D1306 |
| Zombie NIR Fixable Viability Dye | BioLegend | 423106 |
| Recombinant Mouse TNF-α | BioLegend | 575202 |
| Recombinant Human TNF-α | BioLegend | 570104 |
| Bafilomycin A1 | Cayman Chemical | 11038 |
| Hemin | Sigma-Aldrich | H9039 |
| Sodium pyruvate | Sigma-Aldrich | P2256 |
| Necrostatin-1 | Cayman Chemical | 11658 |
| Z-VAD-FMK | Selleckchem | S7023 |
| ProLong Gold Antifade Mountant | Thermo Fisher | P36934 |
| Fibronectin | Corning | 54008 |
| Critical Commercial Assays | ||
| DNeasy Blood & Tissue Kit | Qiagen | 69506 |
| Zyppy Plasmid Miniprep Kit | Zymo Research | D4019 |
| Pierce BCA Protein Assay Kit | Thermo Fisher Scientific | 23225 |
| CD8a+ T Cell Isolation Kit, mouse | Miltenyi Biotec | 130-104-075 |
| RNeasy Mini Kit | Qiagen | 74104 |
| Deposited Data | ||
| RNAseq data | This Study | GEO: GSE158707 |
| Experimental Models: Cell Lines | ||
| KP panc | Dr. Nabeel M. Bardeesy | N/A |
| KP lung | Dr. Nabeel M. Bardeesy | N/A |
| AsPC-1 | ATCC | N/A |
| MIA PACA-2 | ATCC | N/A |
| PATU-8988T | ATCC | N/A |
| Experimental Models: Organisms/Strains | ||
| Mouse: C57BL/6J | The Jackson Laboratory | 000664 |
| Mouse: B6.129S7-Rag1tm1Mom/J (Rag1 KO) | The Jackson Laboratory | 002216 |
| Mouse: C57BL/6-Tg(TcraTcrb)1100Mjb/J (OT-I) | The Jackson Laboratory | 003831 |
| Mouse: NOD.Cg-Prkdcscid Il2rgtm1Wjl/SzJ (NSG) | The Jackson Laboratory | 005557 |
| Oligonucleotides | ||
| DNA oligonucleotides and primers | This Study | See Table S3 |
| Recombinant DNA | ||
| CRISPR Cas9 sgRNA KO mouse metabolism library | This Study | N/A |
| CRISPR Cas9 sgRNA KO focused mouse metabolism library | This Study | N/A |
| pLenti CRISPR V2 | Addgene | 52961 |
| pMXS-IRES-Blast | Cell Biolabs | RTV-016 |
| pSECB | (Minton et al., 2018) | N/A |
| pLenti CRISPR V2 sgmHmbs | This Study | N/A |
| pSECB sgmHmox1 | This Study | N/A |
| pLenti CRISPR V2 sgmAtg7 | This Study | N/A |
| pLenti CRISPR V2 sgATG7 | This Study | N/A |
| pLenti CRISPR V2 sgmRipk1 | This Study | N/A |
| pLenti CRISPR V2 sgmTnfrsf1a | This Study | N/A |
| pLenti CRISPR V2 sgmTnfrsf1b | This Study | N/A |
| pLenti CRISPR V2 sgmHif1a | This Study | N/A |
| pLenti CRISPR V2 sgmEpas1 | This Study | N/A |
| pLenti CRISPR V2 sgmTap1 | This Study | N/A |
| pMXS-IRES-Blast mAtg7 | This Study | N/A |
| pMP71-eGFP-OVA | This Study | N/A |
| pMP71-eGFP | This Study | N/A |
| pMXS-IRES-Blast cytoLbNOX | This Study | N/A |
| pMXS-IRES-Blast mitoLbNOX | This Study | N/A |
| pMXS-IRES-Blast mHmox1 | This Study | N/A |
| pMXS-IRES-Blast mHmox1-H25A | This Study | N/A |
| Other | ||
| Z2 Coulter Counter | Beckman | Model Z2 |
| SpectraMax Microplate Reader | Molecular Devices | Model M3 |
| Primovert Microscope | Carl Zeiss | 415510-1105-000 |
| REVOLVE4 Microscope | Echo Laboratories | FJSD1001 |
Highlights.
CRISPR screens identify metabolic genes essential for pancreatic tumor growth
Most metabolic essentialities are similar in cells grown in culture and as tumors
Heme synthesis is limiting due to increased heme degradation in the tumor environment
Autophagy enables cancer cells to evade CD8+ T cell killing
Acknowledgements
We thank all members of the Birsoy Lab for helpful suggestions. We would like to thank members of the Rockefeller University Genomics Resource Center, Proteomics Resource Center, Bio-Imaging Resource Center, Flow Cytometry Resource Center and the Weill Cornell Laboratory of Comparative Pathology for their assistance. We also thank Sohail Tavazoie for his scientific input. This research is supported by the NIH Director’s New Innovator Award (DP2 CA228042-01) (KB), Pershing Square Sohn Foundation (KB), AACR NextGen Grant (K.B.) and Robertson Therapeutic Development Fund (X.G.Z.). X.G.Z. is supported by the Sackler Center for Biomedicine and Nutrition Research through the generosity of the Sackler Foundation. K.B. is a Searle Scholar, Pew-Stewart Scholar and Sidney Kimmel Scholar.
Footnotes
Declaration of Interests
K.B. is scientific advisor to Nanocare Pharmaceuticals and a consultant to Barer Institute.
Publisher's Disclaimer: This is a PDF file of an unedited manuscript that has been accepted for publication. As a service to our customers we are providing this early version of the manuscript. The manuscript will undergo copyediting, typesetting, and review of the resulting proof before it is published in its final form. Please note that during the production process errors may be discovered which could affect the content, and all legal disclaimers that apply to the journal pertain.
References
- Alam J, and Cook JL (2007). How many transcription factors does it take to turn on the heme oxygenase-1 gene? Am. J. Respir. Cell Mol. Biol. 36, 166–174. [DOI] [PubMed] [Google Scholar]
- Alvarez SW, Sviderskiy VO, Terzi EM, Papagiannakopoulos T, Moreira AL, Adams S, Sabatini DM, Birsoy K, and Possemato R. (2017). NFS1 undergoes positive selection in lung tumours and protects cells from ferroptosis. Nature 551, 639–643. [DOI] [PMC free article] [PubMed] [Google Scholar]
- Amaravadi R, Kimmelman AC, and White E. (2016). Recent insights into the function of autophagy in cancer. Genes Dev. 30, 1913–1930. [DOI] [PMC free article] [PubMed] [Google Scholar]
- Badgley MA, Kremer DM, Maurer HC, DelGiorno KE, Lee H-J, Purohit V, Sagalovskiy IR, Ma A, Kapilian J, Firl CEM, et al. (2020). Cysteine depletion induces pancreatic tumor ferroptosis in mice. Science 368, 85–89. [DOI] [PMC free article] [PubMed] [Google Scholar]
- Birsoy K, Possemato R, Lorbeer FK, Bayraktar EC, Thiru P, Yucel B, Wang T, Chen WW, Clish CB, and Sabatini DM (2014). Metabolic determinants of cancer cell sensitivity to glucose limitation and biguanides. Nature 508, 108–112. [DOI] [PMC free article] [PubMed] [Google Scholar]
- Birsoy K, Wang T, Chen WW, Freinkman E, Abu-Remaileh M, and Sabatini DM (2015). An essential role of the mitochondrial electron transport chain in cell proliferation is to enable aspartate synthesis. Cell 162, 540–551. [DOI] [PMC free article] [PubMed] [Google Scholar]
- Cantor JR, Abu-Remaileh M, Kanarek N, Freinkman E, Gao X, Louissaint A, Lewis CA, and Sabatini DM (2017). Physiologic medium rewires cellular metabolism and reveals uric acid as an endogenous inhibitor of UMP synthase. Cell 169, 258–272.e17. [DOI] [PMC free article] [PubMed] [Google Scholar]
- Eng CH, Wang Z, Tkach D, Toral-Barza L, Ugwonali S, Liu S, Fitzgerald SL, George E, Frias E, Cochran N, et al. (2016). Macroautophagy is dispensable for growth of KRAS mutant tumors and chloroquine efficacy. Proc. Natl. Acad. Sci. 113, 182–187. [DOI] [PMC free article] [PubMed] [Google Scholar]
- Faubert B, Li KY, Cai L, Hensley CT, Kim J, Zacharias LG, Yang C, Do QN, Doucette S, Burguete D, et al. (2017). Lactate metabolism in human lung tumors. Cell 171, 358–371.e9. [DOI] [PMC free article] [PubMed] [Google Scholar]
- Fukuda Y, Wang Y, Lian S, Lynch J, Nagai S, Fanshawe B, Kandilci A, Janke LJ, Neale G, Fan Y, et al. (2017). Upregulated heme biosynthesis, an exploitable vulnerability in MYCN-driven leukemogenesis. JCI Insight 2, e92409. [DOI] [PMC free article] [PubMed] [Google Scholar]
- Garcia-Bermudez J, Baudrier L, Bayraktar EC, Shen Y, La K, Guarecuco R, Yucel B, Fiore D, Tavora B, Freinkman E, et al. (2019). Squalene accumulation in cholesterol auxotrophic lymphomas prevents oxidative cell death. Nature 567, 118–122. [DOI] [PMC free article] [PubMed] [Google Scholar]
- Goodarzi H, Elemento O, and Tavazoie S. (2009). Revealing global regulatory perturbations across human cancers. Mol. Cell 36, 900–911. [DOI] [PMC free article] [PubMed] [Google Scholar]
- Guo JY, Chen H-Y, Mathew R, Fan J, Strohecker AM, Karsli-Uzunbas G, Kamphorst JJ, Chen G, Lemons JMS, Karantza V, et al. (2011). Activated Ras requires autophagy to maintain oxidative metabolism and tumorigenesis. Genes Dev. 25, 460–470. [DOI] [PMC free article] [PubMed] [Google Scholar]
- Hui S, Ghergurovich JM, Morscher RJ, Jang C, Teng X, Lu W, Esparza LA, Reya T, Le Zhan, Yanxiang Guo J, et al. (2017). Glucose feeds the TCA cycle via circulating lactate. Nature 551, 115–118. [DOI] [PMC free article] [PubMed] [Google Scholar]
- Kearney CJ, Vervoort SJ, Hogg SJ, Ramsbottom KM, Freeman AJ, Lalaoui N, Pijpers L, Michie J, Brown KK, Knight DA, et al. (2018). Tumor immune evasion arises through loss of TNF sensitivity. Sci. Immunol. 3, eaar3451. [DOI] [PubMed] [Google Scholar]
- Kishton RJ, Sukumar M, and Restifo NP. (2017). Metabolic regulation of T cell longevity and function in tumor immunotherapy. Cell Metab. 26, 94–109. [DOI] [PMC free article] [PubMed] [Google Scholar]
- Li C, and Stocker R. (2009). Heme oxygenase and iron: from bacteria to humans. Redox Rep. 14, 95–101. [DOI] [PubMed] [Google Scholar]
- Lignitto L, LeBoeuf SE, Homer H, Jiang S, Askenazi M, Karakousi TR, Pass HI, Bhutkar AJ, Tsirigos A, Ueberheide B, et al. (2019). Nrf2 activation promotes lung cancer metastasis by inhibiting the degradation of Bach1. Cell 178, 316–329.e18. [DOI] [PMC free article] [PubMed] [Google Scholar]
- Lim J, Park H, Heisler J, Maculins T, Roose-Girma M, Xu M, Mckenzie B, van Lookeren Campagne M, Newton K, and Murthy A. (2019). Autophagy regulates inflammatory programmed cell death via turnover of RHIM-domain proteins. ELife 8, e44452. [DOI] [PMC free article] [PubMed] [Google Scholar]
- Lin KH, Xie A, Rutter JC, Ahn Y, Lloyd-Cowden JM, Nichols AG, Soderquist RS, Koves TR, Muoio DM, MacIver NJ, et al. (2019). Systematic dissection of the metabolic-apoptotic interface in AML reveals heme biosynthesis to be a regulator of drug sensitivity. Cell Metab. 29, 1217–1231.e7. [DOI] [PMC free article] [PubMed] [Google Scholar]
- Loi M, Müller A, Steinbach K, Niven J, Barreira da Silva R, Paul P, Ligeon L-A, Caruso A, Albrecht RA, Becker AC, et al. (2016). Macroautophagy proteins control MHC class I levels on dendritic cells and shape anti-viral CD8+ T cell responses. Cell Rep. 15, 1076–1087. [DOI] [PubMed] [Google Scholar]
- Mayers JR, Torrence ME, Danai LV, Papagiannakopoulos T, Davidson SM, Bauer MR, Lau AN, Ji BW, Dixit PD, Hosios AM, et al. (2016). Tissue of origin dictates branched-chain amino acid metabolism in mutant Kras-driven cancers. Science 353, 1161–1165. [DOI] [PMC free article] [PubMed] [Google Scholar]
- Minton DR, Nam M, McLaughlin DJ, Shin J, Bayraktar EC, Alvarez SW, Sviderskiy VO, Papagiannakopoulos T, Sabatini DM, Birsoy K, et al. (2018). Serine catabolism by SHMT2 is required for proper mitochondrial translation initiation and maintenance of formylmethionyl-tRNAs. Mol. Cell 69, 610–621.e5. [DOI] [PMC free article] [PubMed] [Google Scholar]
- Ohtsubo K, and Marth JD (2006). Glycosylation in cellular mechanisms of health and disease. Cell 126, 855–867. [DOI] [PubMed] [Google Scholar]
- Orvedahl A, McAllaster MR, Sansone A, Dunlap BF, Desai C, Wang Y-T, Balce DR, Luke CJ, Lee S, Orchard RC, et al. (2019). Autophagy genes in myeloid cells counteract IFNγ-induced TNF-mediated cell death and fatal TNF-induced shock. Proc. Natl. Acad. Sci. 116, 16497–16506. [DOI] [PMC free article] [PubMed] [Google Scholar]
- Panchenko MV, Farber HW, and Korn JH (2000). Induction of heme oxygenase-1 by hypoxia and free radicals in human dermal fibroblasts. Am. J. Physiol.-Cell Physiol. 278, C92–C101. [DOI] [PubMed] [Google Scholar]
- Patel SJ, Sanjana NE, Kishton RJ, Eidizadeh A, Vodnala SK, Cam M, Gartner JJ, Jia L, Steinberg SM, Yamamoto TN, et al. (2017). Identification of essential genes for cancer immunotherapy. Nature 548, 537–542. [DOI] [PMC free article] [PubMed] [Google Scholar]
- Perera RM, and Bardeesy N. (2015). Pancreatic cancer metabolism: Breaking it down to build it back up. Cancer Discov. 5, 1247–1261. [DOI] [PMC free article] [PubMed] [Google Scholar]
- Perera RM, Stoykova S, Nicolay BN, Ross KN, Fitamant J, Boukhali M, Lengrand J, Deshpande V, Selig MK, Ferrone CR, et al. (2015). Transcriptional control of autophagy–lysosome function drives pancreatic cancer metabolism. Nature 524, 361–365. [DOI] [PMC free article] [PubMed] [Google Scholar]
- Ryan DP, Hong TS, and Bardeesy N. (2014). Pancreatic adenocarcinoma. N. Engl. J. Med. 371, 1039–1049. [DOI] [PubMed] [Google Scholar]
- Santana-Codina N, Roeth AA, Zhang Y, Yang A, Mashadova O, Asara JM, Wang X, Bronson RT, Lyssiotis CA, Ying H, et al. (2018). Oncogenic KRAS supports pancreatic cancer through regulation of nucleotide synthesis. Nat. Commun. 9, 4945. [DOI] [PMC free article] [PubMed] [Google Scholar]
- Sousa CM, Biancur DE, Wang X, Halbrook CJ, Sherman MH, Zhang L, Kremer D, Hwang RF, Witkiewicz AK, Ying H, et al. (2016). Pancreatic stellate cells support tumour metabolism through autophagic alanine secretion. Nature 536, 479–483. [DOI] [PMC free article] [PubMed] [Google Scholar]
- Sullivan MR, Danai LV, Lewis CA, Chan SH, Gui DY, Kunchok T, Dennstedt EA, Vander Heiden MG, and Muir A. (2019). Quantification of microenvironmental metabolites in murine cancers reveals determinants of tumor nutrient availability. ELife 8, e44235. [DOI] [PMC free article] [PubMed] [Google Scholar]
- Titov DV, Cracan V, Goodman RP, Peng J, Grabarek Z, and Mootha VK (2016). Complementation of mitochondrial electron transport chain by manipulation of the NAD+/NADH ratio. Science 352, 231–235. [DOI] [PMC free article] [PubMed] [Google Scholar]
- Towers CG, Fitzwalter BE, Regan D, Goodspeed A, Morgan MJ, Liu C-W, Gustafson DL, and Thorburn A. (2019). Cancer cells upregulate NRF2 signaling to adapt to autophagy inhibition. Dev. Cell 50, 690–703.e6. [DOI] [PMC free article] [PubMed] [Google Scholar]
- Tsherniak A, Vazquez F, Montgomery PG, Weir BA, Kryukov G, Cowley GS, Gill S, Harrington WF, Pantel S, Krill-Burger JM, et al. (2017). Defining a cancer dependency map. Cell 170, 564–576.e16. [DOI] [PMC free article] [PubMed] [Google Scholar]
- Vande Voorde J, Ackermann T, Pfetzer N, Sumpton D, Mackay G, Kalna G, Nixon C, Blyth K, Gottlieb E, and Tardito S. (2019). Improving the metabolic fidelity of cancer models with a physiological cell culture medium. Sci. Adv. 5, eaau7314. [DOI] [PMC free article] [PubMed] [Google Scholar]
- Vander Heiden MG, and DeBerardinis RJ (2017). Understanding the intersections between metabolism and cancer biology. Cell 168, 657–669. [DOI] [PMC free article] [PubMed] [Google Scholar]
- Wang X, and Lin Y. (2008). Tumor necrosis factor and cancer, buddies or foes? Acta Pharmacol. Sin. 29, 1275–1288. [DOI] [PMC free article] [PubMed] [Google Scholar]
- Weiss L, Hoffmann GE, Schreiber R, Andres H, Fuchs E, Körber E, and Kolb HJ (1986). Fatty-acid biosynthesis in man, a pathway of minor importance. Purification, optimal assay conditions, and organ distribution of fatty-acid synthase. Biol. Chem. Hoppe. Seyler 367, 905–912. [DOI] [PubMed] [Google Scholar]
- Wu J, and Lanier LL (2003). Natural killer cells and cancer. Adv. Cancer Res. 90, 127–156. [DOI] [PubMed] [Google Scholar]
- Xu R, Pelicano H, Zhou Y, Carew JS, Feng L, Bhalla KN, Keating MJ, and Huang P. (2005). Inhibition of glycolysis in cancer cells: a novel strategy to overcome drug resistance associated with mitochondrial respiratory defect and hypoxia. Cancer Res 10. [PubMed] [Google Scholar]
- Yamaguchi N, Weinberg EM, Nguyen A, Liberti MV, Goodarzi H, Janjigian YY, Paty PB, Saltz LB, Kingham TP, Loo JM, et al. (2019). PCK1 and DHODH drive colorectal cancer liver metastatic colonization and hypoxic growth by promoting nucleotide synthesis. ELife 8, e52135. [DOI] [PMC free article] [PubMed] [Google Scholar]
- Yamamoto K, Venida A, Yano J, Biancur DE, Kakiuchi M, Gupta S, Sohn ASW, Mukhopadhyay S, Lin EY, Parker SJ, et al. (2020). Autophagy promotes immune evasion of pancreatic cancer by degrading MHC-I. Nature 581, 100–105. [DOI] [PMC free article] [PubMed] [Google Scholar]
- Yang A, Rajeshkumar NV, Wang X, Yabuuchi S, Alexander BM, Chu GC, Von Hoff DD, Maitra A, and Kimmelman AC (2014). Autophagy is critical for pancreatic tumor growth and progression in tumors with p53 alterations. Cancer Discov. 4, 905–913. [DOI] [PMC free article] [PubMed] [Google Scholar]
- Yang A, Herter-Sprie G, Zhang H, Lin EY, Biancur D, Wang X, Deng J, Hai J, Yang S, Wong K-K, et al. (2018). Autophagy sustains pancreatic cancer growth through both cell-autonomous and nonautonomous mechanisms. Cancer Discov. 8, 276–287. [DOI] [PMC free article] [PubMed] [Google Scholar]
- Yang S, Wang X, Contino G, Liesa M, Sahin E, Ying H, Bause A, Li Y, Stommel JM, Dell’Antonio G, et al. (2011). Pancreatic cancers require autophagy for tumor growth. Genes Dev. 25, 717–729. [DOI] [PMC free article] [PubMed] [Google Scholar]
- Zhu XG, Nicholson Puthenveedu S, Shen Y, La K, Ozlu C, Wang T, Klompstra D, Gultekin Y, Chi J, Fidelin J, et al. (2019). CHP1 regulates compartmentalized glycerolipid synthesis by activating GPAT4. Mol. Cell 74, 45–58.e7. [DOI] [PMC free article] [PubMed] [Google Scholar]
Associated Data
This section collects any data citations, data availability statements, or supplementary materials included in this article.
Supplementary Materials
Data Availability Statement
The RNAseq dataset generated in this study is available at GEO (accession number GSE158707).