Abstract
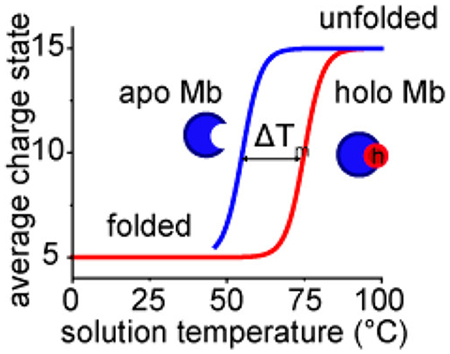
Thermal denaturation of holomyoglobin (hMb) in solution (10 mM ammonium acetate at pH = 4.5, 6.8, and 9.0) was monitored by ion mobility spectrometry (IMS) and mass spectrometry (MS) techniques to characterize the stability and investigate structural changes involved in unfolding. We utilize two experimental approaches to induce thermal denaturation: a variable-temperature electrospray ionization (vT-ESI) source that heats the bulk solution in the ESI emitter, and a variable-power 10.6 μm CO2 laser that rapidly heats nanodroplets produced by ESI. These two approaches sample different time scales of the denaturation process; long time scales (seconds to minutes) where the system is at equilibrium using the vT-ESI approach and shorter time scales (μs) by rapid droplet heating in which the system is in a pre-equilibrium state. Increasing the solution temperature (from 28 to 95 °C in the vT-ESI experiments) shifts the charge state distribution from low charge states ([M + 7H]7+ to [M + 9H]9+) to more highly charged species. This is accompanied by loss of the heme group to yield the apomyoglobin (aMb) species, indicating that the protein has unfolded. Monitoring the formation of aMb and the shift in average charge states of aMb and hMb with solution temperature allows for relative quantitation of their individual stabilities, highlighting the stabilizing effects of heme binding. We compare the degree of unfolding induced by heating the bulk solution (using vT-ESI) to the laser droplet heating approach and find that the rapid nature of the laser heating approach allows for transient pre-equilibrium states to be sampled.
Graphical Abstract
INTRODUCTION
Proteins adopt intricate three-dimensional structures based on a delicate balance of favorable and unfavorable interactions between nearby amino acids, the surrounding solvent, and other proteins and biomolecules. By peeling these interactions apart and unfolding a protein, we can begin to gain insight into how these interactions act to stabilize or destabilize the structure. There are many ways to unfold proteins, such as exposure to extremes in temperature or pH, chaotropes, and mechanical force.1,2 Mass spectrometry has emerged as an attractive method for examining this process as many of these methods for unfolding can be coupled for online analysis.3–7 Recently, our group and several others have begun investigating protein unfolding processes and binding interactions using variable-temperature electrospray ionization (vTESI) sources.8–15 Such vT-ESI approaches take advantage of the unique properties of evaporating ESI droplets and the high-fidelity and wide dynamic range of modern mass spectrometers to examine proteins at a level of detail that is difficult to achieve with other analytical techniques.
Temperature-dependent measurements allow for detailed stability and thermochemical analysis of many populated species at equilibrium within a biological system.15–17 Such measurements are critical for answering the question of “why” unfolding occurs; however, to gain mechanistic insights into “how” folding processes occur, we must measure systems before they are able to reach equilibrium (i.e., time-dependent transitions). Most proteins fold on microsecond to millisecond time scales,18–20 making kinetic information difficult to acquire with traditional heating approaches such as differential scanning calorimetry and circular dichroism. In order to sample short time scales, our group has recently developed an ESI source that employs an IR laser to rapidly heat the evaporating droplets after they have left the emitter.21 A previous study employing this technique found that early steps in the thermal denaturation of ubiquitin could be observed in this way to provide insight into a potential pathway of the unfolding process.
In this work, we examine the unfolding behavior of myoglobin (Mb) using a vT-ESI droplet heating approach and contrast it to bulk solution heating measurements using the model protein system myoglobin (Mb). Mb is a small (16.9 kDa), well characterized α-helical protein that noncovalently binds a protoporphyrin heme ligand to form holomyoglobin (hMb). We demonstrate the effects of solution pH on the overall stability of Mb with both heating techniques. We show that the protein can unfold peripherally before the heme dissociates to form apomyoglobin (aMb), indicating that the heme binding domain is quite thermostable. We also demonstrate the effects of droplet size on the degree of unfolding, which agrees with our previous findings that suggest smaller initial droplet sizes allow sampling of shorter time scales with the laser droplet heating approach.
EXPERIMENTAL SECTION
Sample Preparation.
Equine myoglobin (Sigma-Aldrich, St. Louis, MO) stock was prepared in water (Omnisolv LC-MS grade, EMD Millipore, Billerica, MA) to a concentration of 5 mg·mL−1 and buffer exchanged into 10 mM aqueous ammonium acetate using Micro Bio-Spin 6 size exclusion spin columns (Bio-Rad, Hercules, CA). For experiments at pH 4.5, ammonium acetate pH was adjusted by dropwise addition of glacial acetic acid. For experiments at pH 9, ammonium acetate pH was adjusted by dropwise addition of 28–30% ammonium hydroxide (ACS grade, VWR Chemicals, Radnor, PA). Myoglobin samples were diluted to 5 μM in 10 mM ammonium acetate for MS analysis. Analyte solutions were loaded into borosilicate glass nESI emitters pulled to a fine point (~4, 8, and 24 μm diameter) using a Flaming/Brown micropipette puller (Sutter Instrument, Novato, CA). The emitter diameter was controlled by decreasing the pull velocity of the micropipette puller and measured with a scanning electron microscope (FEI Quanta 600F, Hillsboro, OR) (see the Supporting Information). A platinum wire was inserted into the emitter in contact with the analyte solution to apply the ESI voltage (between 0.7–1.5 kV). All reagents were purchased from Sigma-Aldrich (St. Louis, MO) in the highest purity available if not otherwise specified.
Mass Spectrometry Experiments.
All MS data was collected on a Waters SYNAPT G2 (Waters Corp., Milford, MA) with the source interlocks overridden to grant access to the inlet skimmer cone and accommodate a custom nESI source and laser optics. Variable-temperature electrospray ionization experiments were performed using a custom fabricated heated electrospray source, described previously.16 In brief, the nESI emitter is encased in a thermally conductive ceramic block and the temperature is controlled with an embedded cartridge heater. The temperature is measured using a thermocouple probe embedded in the ceramic near the tip of the emitter.
Infrared Laser ESI source.
A continuous wave CO2 laser (Model 48–2W, Synrad, Mukilteo, WA) beam was routed using gold-coated mirrors and focused with a ZnSe plano-convex lens to a spot size of ~500 μm. The focal point was oriented directly in front of the inlet skimmer cone of the mass spectrometer ~5 mm from the inlet. The ESI emitter was mounted to an XYZ micrometer stage and positioned 1.5 mm away from the beam, measured using a coaligned visible diode pointer laser. Laser power output was adjusted by pulse-width modulation using a UC-2000 laser controller (Synrad, Mukilteo, WA). All laser optics were purchased from ThorLabs (Newton, NJ).
Data Analysis.
All MS data were extracted using TWIMExtract software (University of Michigan, Ann Arbor, MI)22 and plotted in OriginPro 2018 (Originlab, North-hampton, MA). Sigmoidal melting curves were modeled using a logistic function, and the melting temperature was determined from the midpoint x-value of the regression. Mass spectral peaks of each protonated charge state for both aMb and hMb were integrated and normalized to the sum of all observed charge states at each temperature or laser power. Collision cross section (CCS) values were estimated by calibrating the experimental drift times to known values obtained by drift tube IMS measurements following the framework described by Ruotolo and co-workers.23 Denatured myoglobin was chosen as the calibrant (N2 CCS values),24 and N2 was used as the drift gas. Sigmoidal melting curves were modeled using a logistic function, and the melting temperature (Tm) was determined from the midpoint x-value of the regression. Reported uncertainties in Tm are from the standard deviation of n = 3 replicate measurements.
RESULTS AND DISCUSSION
Multiple Metrics for Measuring the Stability of Mb.
Measuring changes in protein mass-to-charge ratio (m/z) as a function of solution temperature can reveal information about the thermal stability of the protein as well as how the equilibrium distribution of structures and states vary with temperature. Figure 1a shows three representative vT-ESI mass spectra of hMb acquired from solution temperatures of 28, 63, and 93 °C and pH = 4.5. At low solution temperatures (e.g., 28 °C), the mass spectrum shows a narrow charge state envelope centered at the +8 hMb species, consistent with a native folded protein. As the solution temperature is increased, we note two major changes in the observed m/z values: a shift from the “native” charge state distribution (z = +7 to +9) in favor of more highly charged ions (z = +11 to +21) and the emergence of peaks with a decrease in mass of 616 Da indicating the loss of noncovalently bound heme to yield aMb. Both observations are indicative of unfolding. These observations are rationalized as rearrangements of the peptide backbone during temperature-induced unfolding causing separation of net neutral salt bridges and exposure of buried ionizable residues that are protonated during the ESI process.4,5,25–27 Unfolding of the heme binding domain presumably results in improper orientation of the coordinating side chains and dissociation of the heme.
Figure 1.
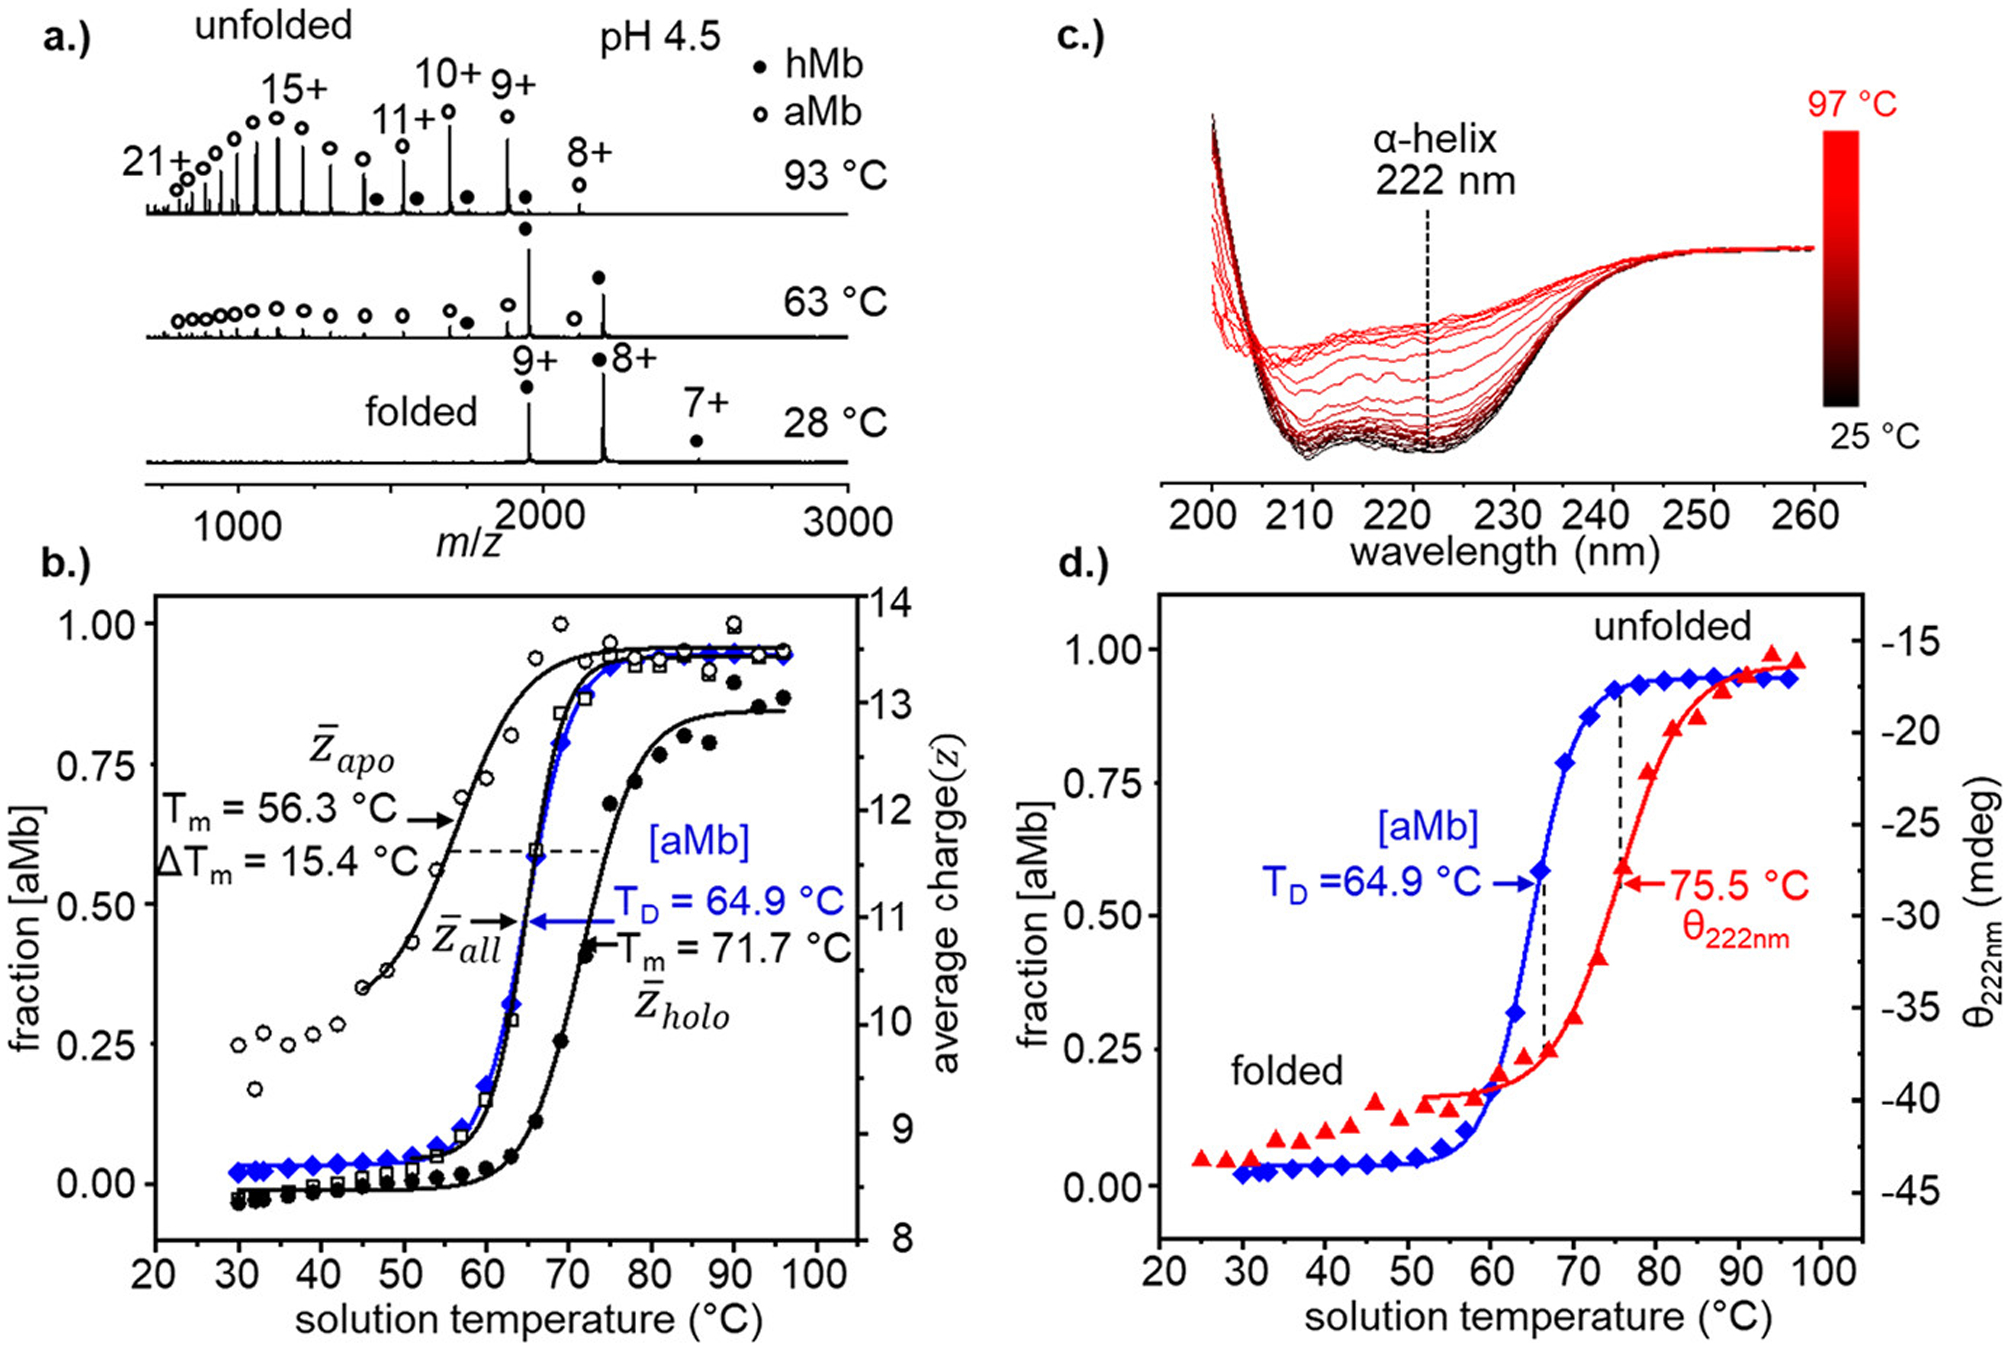
(a) Normalized vT-ESI mass spectra of hMb (in 10 mM NH4OAc, pH = 4.5) at solution temperatures of 28, 63, and 93 °C. Heme-bound hMb states are indicated by filled black circles and heme-free aMb species with open circles. (b) Temperature-dependent stability curves derived from the formation of aMb (blue diamonds) on the left axis and the average charge state plots of (open black squares), (open black circles), and (filled black circles). Data points from T = 28 to 42 °C are excluded in the model of due to low signal/noise. (c.) Temperature-dependent CD spectra of hMb (in 10 mM NH4OAc, pH = 4.5) with the characteristic negative α-helix peak at 222 nm indicated with a dotted line. (d) Comparison of loss of α-helical structure measured by CD (red triangles) with formation of aMb from MS measurements (blue diamonds).
Figure 1b shows temperature-dependent stability curves using four different metrics for evaluating stability derived from the MS data: fractional abundance of aMb ([aMb]), average charge state of all Mb ions , average charge state of heme-bound hMb ions , and the average charge state of heme-free aMb ions . Each of these metrics report on a different aspect of the unfolding equilibrium. Modeling the data with a two-state sigmoidal function allows us to determine the midpoint of the [aMb] curve in order to determine the temperature of dissociation (TD). The value of TD represents the temperature in which the equilibrium populations of aMb and hMb are equal and gives an indication of the relative stability of the heme binding domain. The average charge state curves provide a metric of the structural stability, with the midpoint temperature of melting (Tm) indicating the temperature at which the fraction of folded and unfolded protein is equal. Denatured proteins tend to have greater ionization efficiency due to the exposure of additional ionizable side chains, which may contribute to the error in measuring values of Tm, however previous studies found that the values of Tm determined from the average charge state are in close agreement with traditional calorimetric values.9,10,16
Interestingly, the midpoint values of [aMb] and are nearly indistinguishable ( Tm = 64.8 ± 0.6 °C; [aMb] TD = 64.9 ± 0.7 °C), suggesting that the overall structural stability is largely governed by heme occupancy in the activate site binding. Because aMb and hMb are easily distinguished by their masses, the average charge states of these individual species can be calculated (assuming they are detected with adequate signal-to-noise). The aMb species is first observed at ~45 °C (see the Supporting Information) and undergoes a melting transition that is independent of the hMb species with Tm = 56.3 °C. On the basis of differences in Tm values of the individual average charge state curves in Figure 1b ( Tm = 56.3 °C and Tm = 71.7 °C), the contributions of heme binding on the relative stability can be evaluated (ΔTm = 15.4 °C), indicating that the heme substantially stabilizes the folded structure. The increased stability of hMb relative to aMb is not a novel finding,28 and heme affinity is known to influence its overall stability;29 however, the ability to simultaneously characterize the structural stability of both species, and track the relative stability of the heme binding domain in a single measurement is a unique advantage of this vT-ESI-MS method.
Spectroscopic methods such as circular dichroism (CD) can provide additional insight into the processes involved in folding and unfolding. Figure 1c. shows the temperature-dependent far-UV CD spectra of hMb at pH = 4.5, in which the α-helical content (based on ellipticity (θ) at 222 nm) decreases as a function of solution temperature. The strong negative peak at 222 nm at low solution temperatures is consistent with the highly helical native structure of myoglobin (~70% α helix).30 Figure 1d shows the CD melting profile of hMb tracking the loss of α-helical content (Tm = 75.5 °C)compared with the loss of heme (TD = 64.9 °C) determined from the MS experiment. The considerable difference in these midpoint values indicates that they are reporting on different stages of denaturation. The midpoint of the CD melting curve coincides with the end points of the [aMb] curve, such that loss of secondary structure appears to necessitate the elimination of heme first. That the measurements of and [aMb] have midpoint Tm (or TD) values well below the CD Tm value for loss of secondary structure suggests that the MS analysis is reporting on changes in the tertiary structure that precede the unfolding of the helical structure. Additionally, we note that even at the highest temperatures studied here (97 °C) Mb retains some aspects of its helical secondary structure. Analysis of both data sets provides complementary information and leads to a more complete view of the thermal denaturation of Mb.
Effects of Solution pH on Thermal Denaturation of Mb.
Figure 2 shows the vT-ESI melting profiles of hMb at pH = 6.8 and pH = 9.0. The native charge state distribution of hMb at pH 6.8 (Figure 2a) is observed to transition to more highly charged aMb species with increasing solution temperature, similar to the trend observed at pH = 4.5 (see Figure 1). However, there is a notable difference in the vT-ESI mass spectra at pH 6.8—the presence of highly charged hMb ions at temperatures near or above the melting transition point (Tm = 78.6 ± 2.0 °C). The presence of highly charged hMb species suggests that the protein has unfolded enough to expose ionizable residues, while still maintaining the integrity of the heme binding pocket. Similar highly charged hMb species have been observed during the refolding of denatured aMb in a rapid mixing device, that were thought to be kinetic folding intermediates.7 That these structures can be stabilized enough at high temperatures and observed in a solution at equilibrium provides a unique perspective into how temperature affects the accessible conformational landscape of a protein. These observations also indicate that the heme binding region is locally quite stable, even as the surrounding regions of the protein unfold around it. The lack of highly charged hMb species at pH 4.5 (Figure 1) can likely explained by the pKa of histidine (~6.0–6.5).31,32 Two neutral histidine residues (His93 and His64) play important roles in binding the heme in the active site. In the native structure, this residue is protected by a highly conserved hydrophobic patch (Leu89, Ile99, and Leu104), which prevents solvent exposure to the iron-coordinated His93 residue and the distal His64.33 As the protein begins to unfold and permit solvent accessibility, these His residues can be protonated resulting in the inability to coordinate the metal,34 and dissociation of the heme. We note that ammonium acetate is not an effective pH buffer near neutral pH—having pKa values of 4.75 and 9.25—and that the pH in the end stage evaporating ESI droplets is likely lower than that of the bulk solution.35 However, at pH = 9.0 where the solution has a considerable buffer capacity, we observe similar results and the pH in the ESI droplets is likely not significantly altered. These observations suggest that the structures we observe are reflective of the bulk solution environment, and the structures are not significantly perturbed during the electrospray process.
Figure 2.
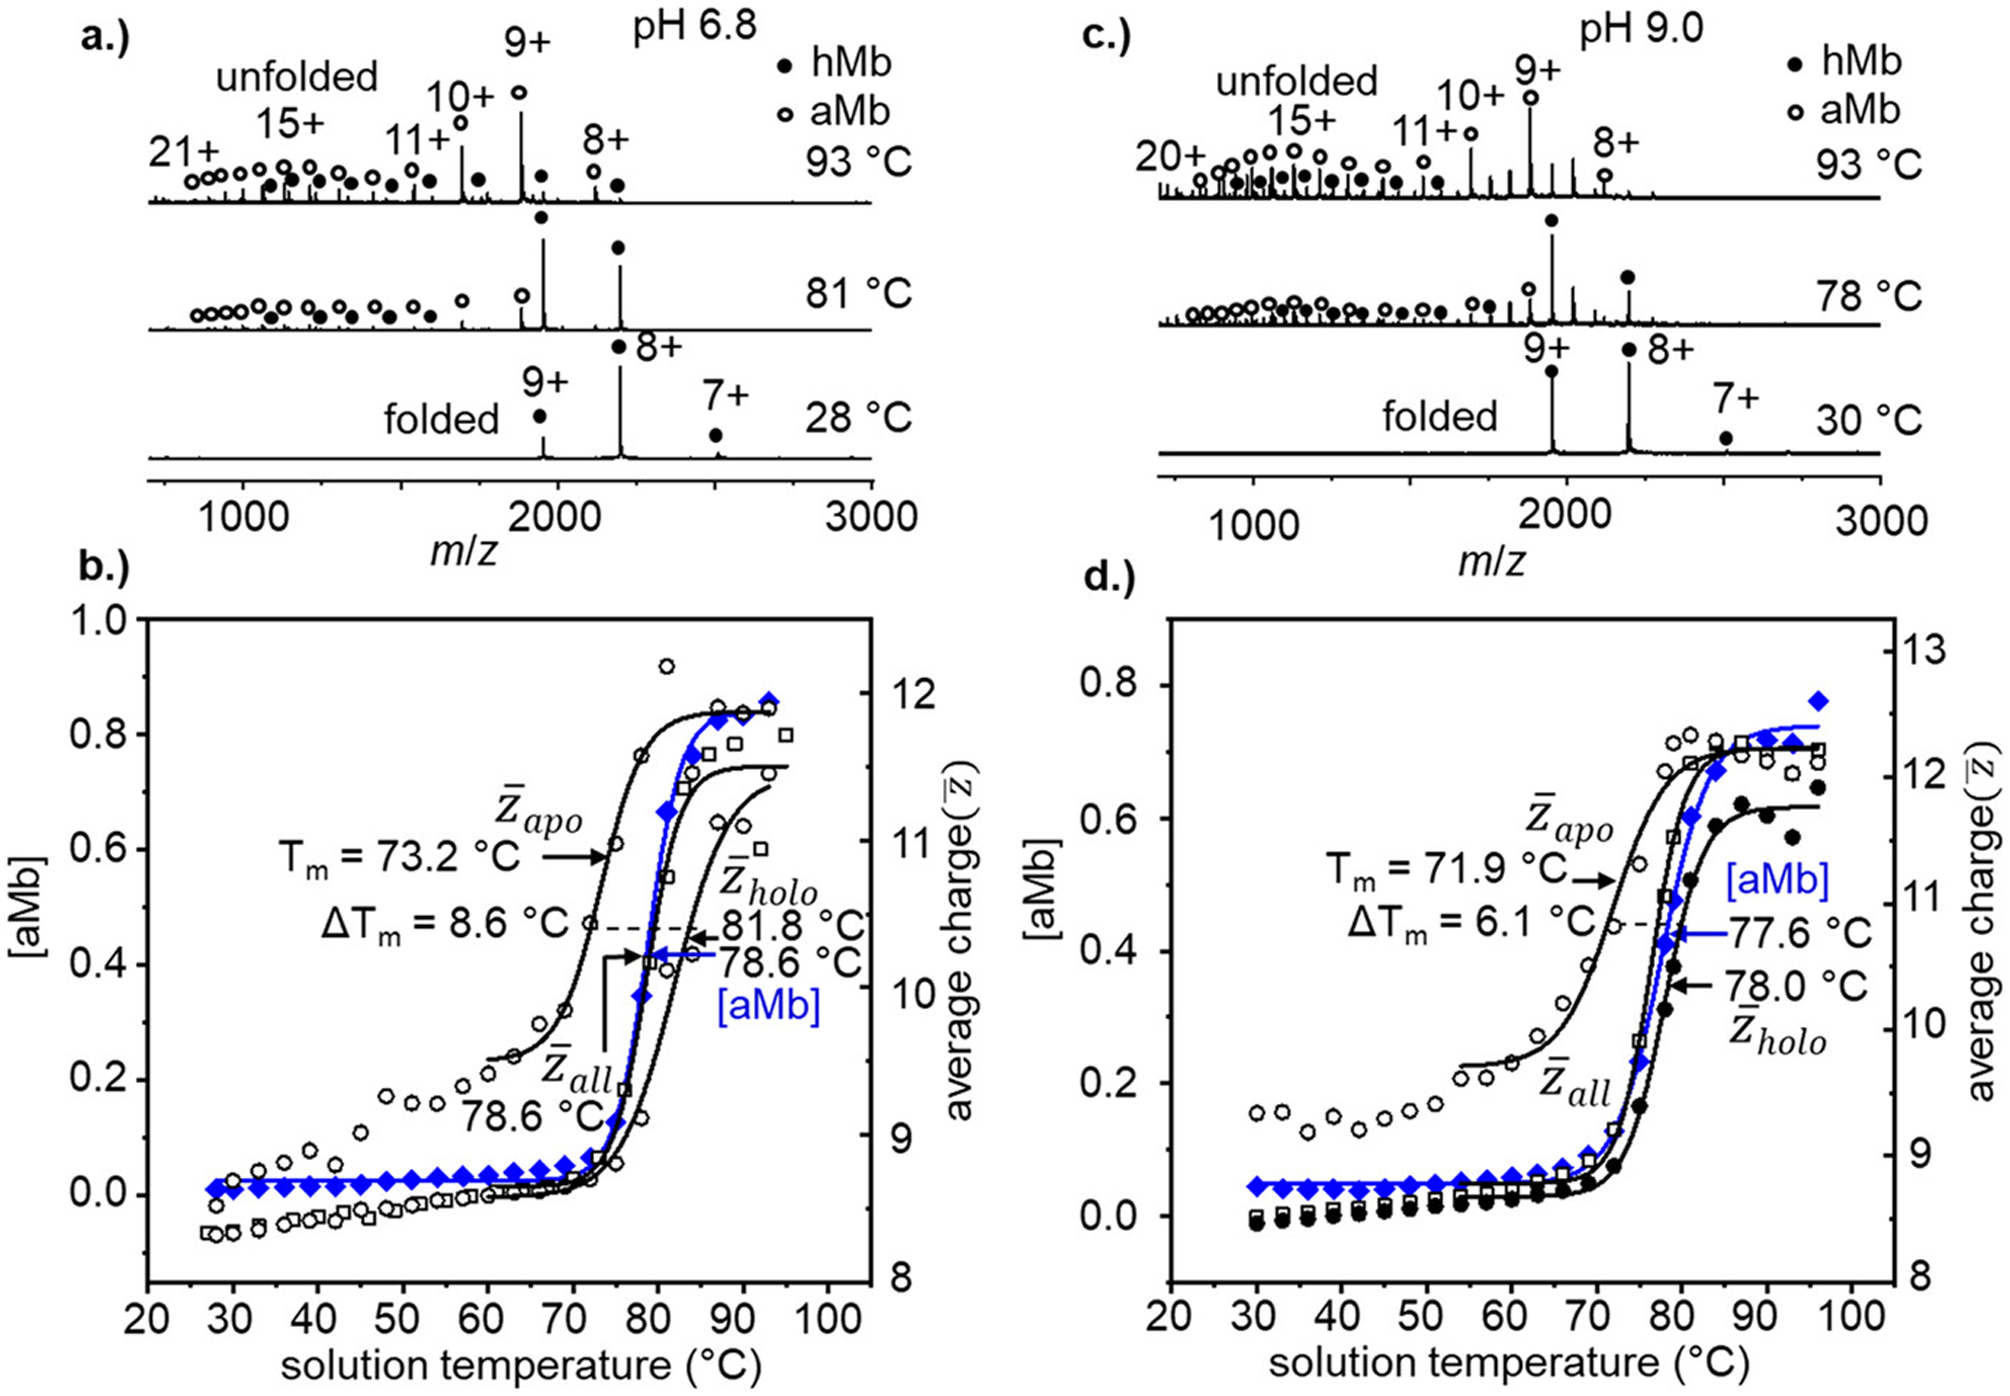
(a) Representative vT-ESI mass spectra of hMb (in 10 mM NH4OAc pH = 6.8) at solution temperatures of 28, 81, and 93 °C. Heme-bound hMb states are indicated with filled black circles, and heme-free aMb species with open circles. (b, d) Temperature-dependent stability curves showing [aMb] (blue diamonds) on the left axis and the average charge state plots of (open black squares), (open black circles), and (filled black circles). (c) Representative vT-ESI mass spectra of hMb (in 10 mM NH4OAc pH = 9.0) at solution temperatures of 30, 78, and 93 °C.
Figure 2b shows the stability curves of Mb tracking the formation of aMb and the average charge states of the observed species. The overall average charge state and [aMb] curves are indistinguishable from each other (as was the case in pH = 4.5 solutions); however the difference in (Tm = 73.2 °C) and (Tm = 81.8 °C) is not as drastic, having a ΔTm = 8.6 °C. Mass spectra and stability curves for Mb at pH = 9.0 are shown in Figure 2c and Figure 2d, respectively. The intensities of the highly charged hMb species observed at high temperatures are slightly greater at pH = 9.0 (Figure 2c), but the values of TD and the overall Tm at pH 9.0 are similar to those for the pH 6.8 data set (within ~1 °C). From the comparison of and at each pH, we can conclude that hMb is most stable near neutral pH, where Tm = 81.8 °C, consistent with previous spectroscopic measurements.36
Structural Analysis by Ion Mobility Spectrometry–Mass Spectrometry.
The analysis of and fractional [aMb] are good metrics for evaluating the overall stability of Mb with response to external factors (e.g., solution pH and temperature) because they are effectively a measure of the ensemble average of all states. Differentiating the average charge into and highlights a unique advantage of MS-based methods, allowing us to begin to deconvolute the ensemble average measurement into individual components. The incorporation of IMS into these measurements allows for further deconvolution by resolving structural differences in the mobility dimension. Figure 3a shows the individual abundances of the “native-like” charge states +8 and +9 of hMb and aMb as a function of solution temperature. In the intermediate temperature regime (30–~70 °C), the behavior of the +8 and +9 hMb ions appear to mirror one another; the 8+ species decays in abundance, the abundance of the +9 species increases. This change from +8 to +9 charge appears to be the primary source of the gradual increase in average charge state plot in Figures 1 and 2 over this temperature range (prior to reaching Tm). The curves for +8 and +9 hMb reach a plateau at ~70 °C before undergoing a sigmoidal melting transition with nearly identical midpoint Tm values (76.5 ± 0.9 and 76.8 ± 1.9 °C, respectively). As the solution temperature approaches the Tm, the +8 and +9 aMb species form with midpoint temperatures of formation (Tf) at 74.9 ± 1.2 and 78.3 ± 0.8 °C, respectively. The differences in Tf for the aMb charge states indicate that these two states have different degrees of stability.
Figure 3.
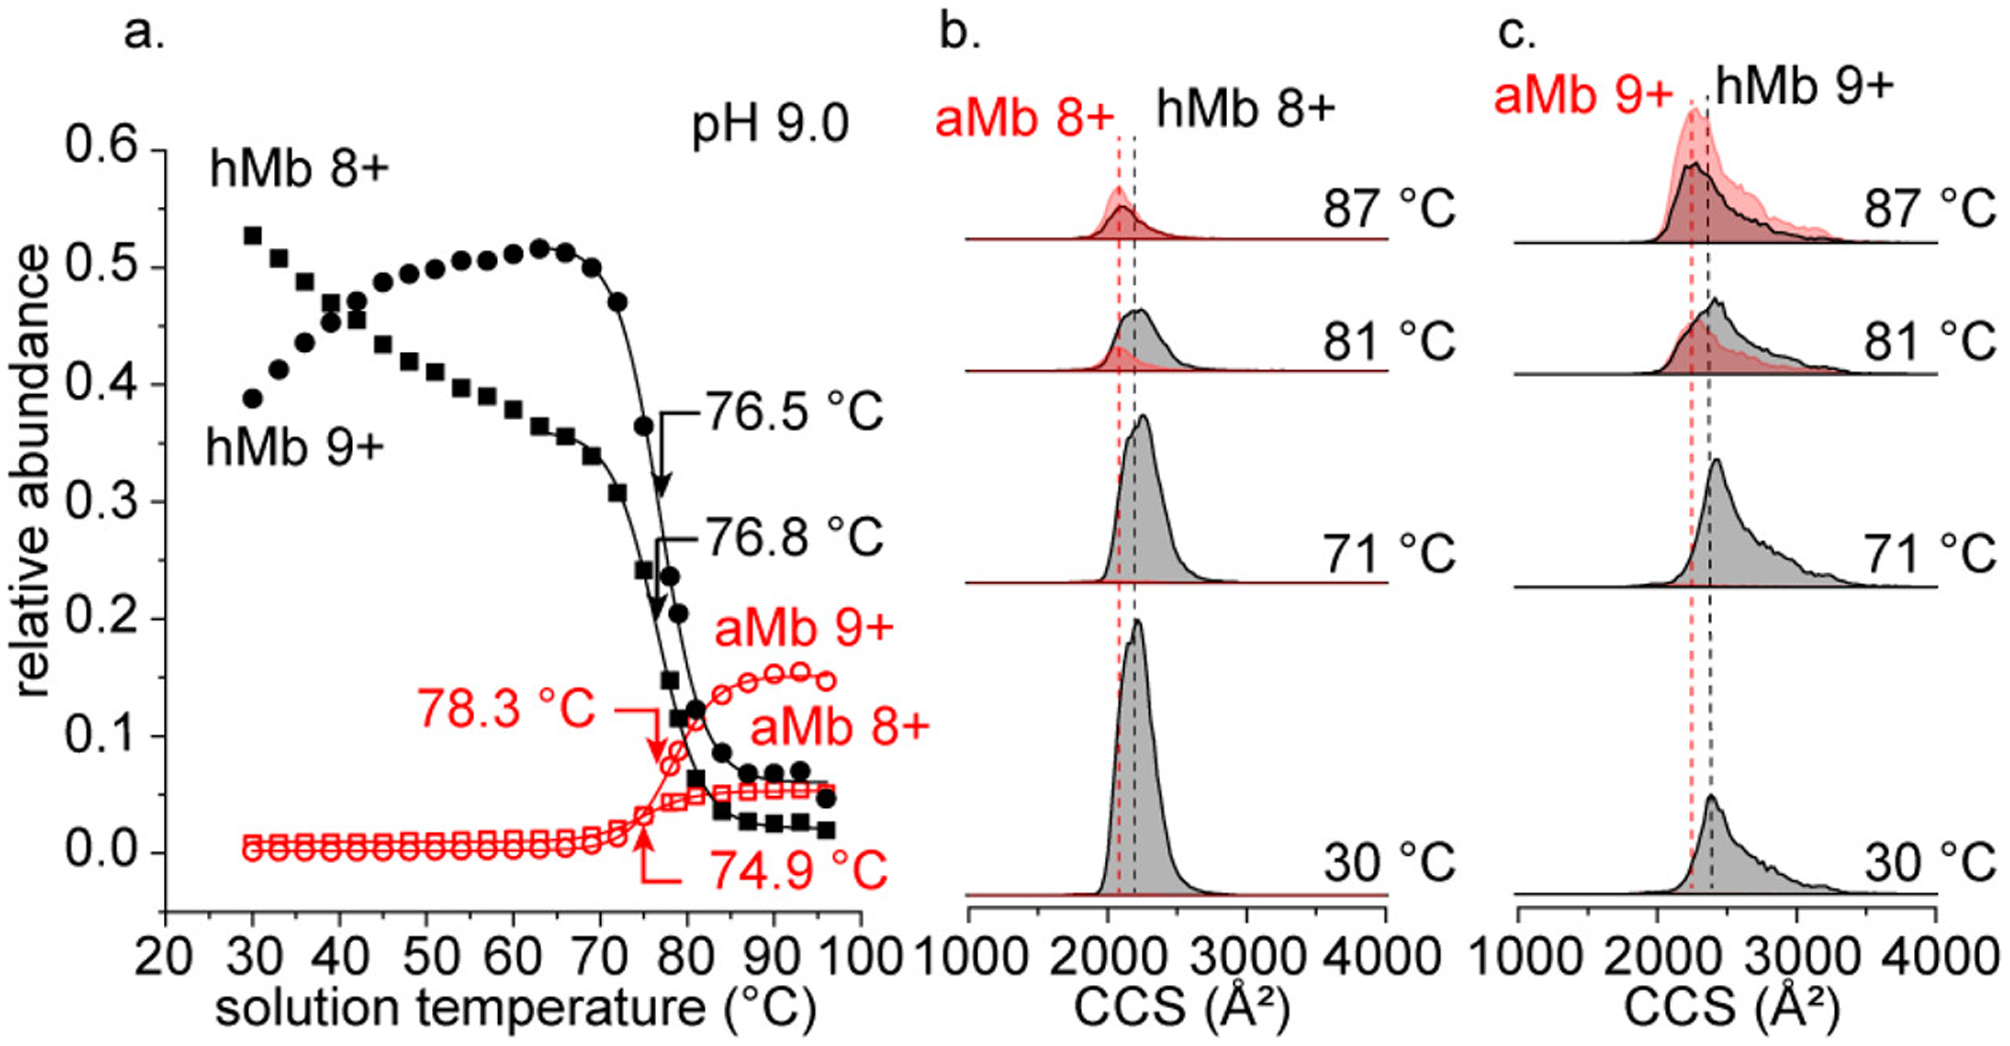
Relative abundance of +8 and +9 charge states of hMb (filled symbols) and aMb (open symbols) as a function of solution temperature (a). IMS-derived collision cross section (CCS) distributions of hMb 8+ (black) and aMb 8+ (red) with increasing solution temperature (b). CCS distributions of hMb 9+ and aMb 9+ with increasing temperature (c).
Parts b and c of Figure 3 show four representative IMS collision cross section (CCS) distributions of the +8 and +9 hMb and aMb species at increasing solution temperatures (30, 71, 81, and 87 °C) at pH = 9.0. At 30 °C, the CCS distributions of the hMb + 8 and +9 ions have peak centers at 2215 and 2390 Å2, respectively. The +8 and +9 aMb species are observed to form near the Tm and have slightly more compact CCS values (2075 and 2280 Å2, respectively). The decrease in CCS for the aMb species likely arises because the protein can collapse around the newly vacant heme binding pocket. This observation of a more compact aMb structure is consistent with previous IMS-MS measurements by Vahidi and co-workers with acid-induced unfolding of myoglobin and suggests that the structures formed by temperature and pH-induced denaturation may be similar.37 At solution temperatures below the Tm (<76 °C), no significant changes in the CCS of the hMb species are observed, only the decrease in +8 hMb abundance and increase in +9 hMb. However, at temperatures above the Tm, the structures of the hMb ions appear to undergo a compaction in which the CCS at high temperatures (~85 °C) is nearly identical to the aMb species. These compact hMb species that resemble the structures measured for aMb structures are not as easily explained by the collapse of the heme binding pocket. That a structural collapse occurs while the heme remains bound suggests that the collapse in tertiary structure occurs in a distant region not associated with heme.
Figure 4a shows the temperature dependent behavior of the individual hMb charge states. As the native charge states (+7 to +9) decay in abundance at higher solution temperatures (≥65 °C), we observe the formation of the highly charged hMb states (+10 to +20). Based on the shapes and midpoint values of the melting curves, the +7, +8, +9, and +10 charge states each exhibit unique temperature dependent behavior, suggesting that they originate from unique solution structures with different stabilities. Charge states +11 to +20 exhibit essentially the same melting behavior and Tf values. While it is possible that the each of these charge states is a unique structure or family of structures in solution with equal stability, we cannot distinguish these states from one another based on their melting behavior within the resolution of the measurement. As a result, we conservatively assign these species as a group of conformers (designated G1), originating from a single solution conformer. At temperatures above the Tm, the aMb states dominate the equilibrium distribution of observed states. Figure 4c shows the intensities of all observed aMb species as a function of solution temperature. Similar to the hMb species, the +7 to +10 charge states exhibit unique melting behavior, and likely originate from unique solution species. The highly charged aMb species are grouped based on similarities in their melting profiles, resulting in two distinguishable conformer groups G2 and G3. Conformer family G3 (which is composed of aMb charge states 17+ to 21+) appears to be distinct from the states that are grouped in G2, having a slightly lower stability (ΔTf = −1.1 °C) and a slightly downward pitch in curve shape at high temperatures (~90–96 °C). The analysis of the IMS-MS abundance plots function of solution temperature indicates that there are at least five unique hMb structures and six unique aMb structures in solution associated with the thermal denaturation of Mb.
Figure 4.
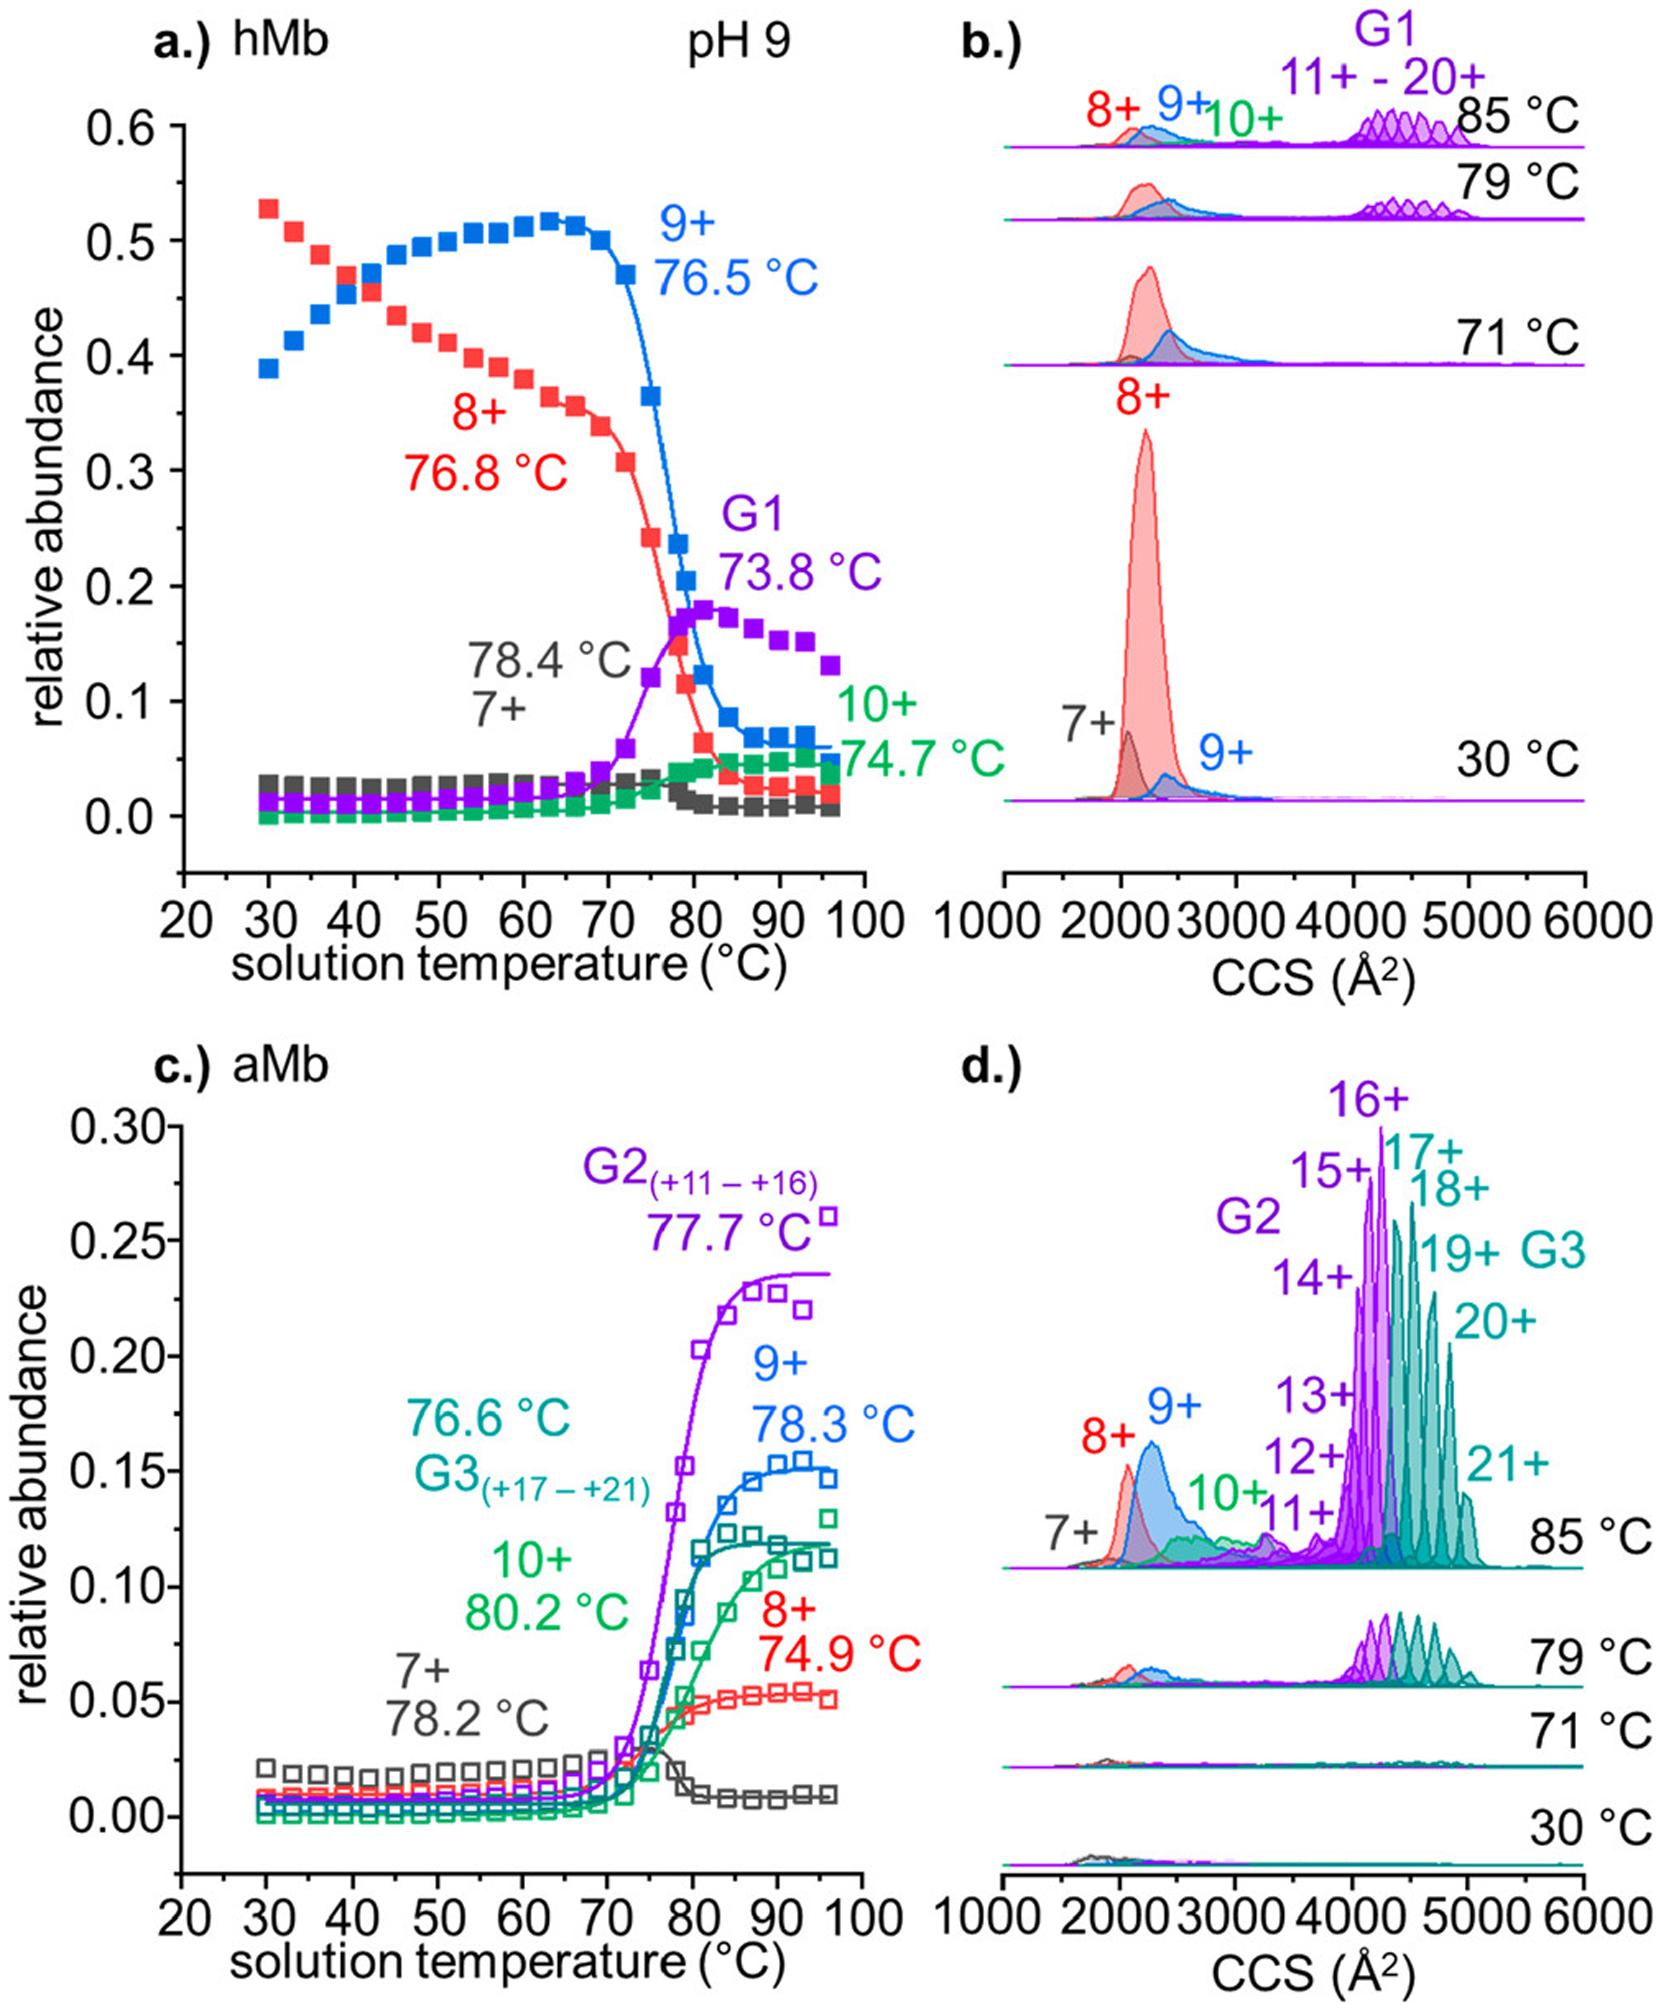
(a) Relative abundance of all observed hMb species as a function of temperature. Midpoint Tm values are annotated next to each curve. Abundances are normalized to the total intensity of all observed Mb species. (b) Representative CCS distributions of each hMb charge state acquired at solution temperatures of 30, 71, 79, and 85 °C. (c) Normalized abundance plot of all aMb species as a function of solution temperature. (d) Representative CCS plot of all aMb charge states at 30, 71, 79, and 85 °C. Features in CCS distributions are color mapped to their representative abundance curves. Midpoint Tm and Tf values are annotated the corresponding trace in the relative abundance profiles.
The CCS of each hMb and aMb state is shown at four representative temperatures (30, 71, 79, and 85 °C) in parts b and d, respectively, of Figure 4. The “native-like” charge states +7 through +9 show broad Gaussian shaped CCS peaks. In the aMb species, the peak shapes are similar to the hMb structures, albeit slightly compacted. As the charge state increases to +10 and +11, the CCS distributions become wide and ill-defined, ranging from ~2800–3600 Å2. The CCS distributions of the aMb species assigned to G1, G2, and G3 are each dominated by a single sharp feature. The sharpness of these peaks and identical melting behavior suggest that these features are likely the result of gas-phase activation, causing them to anneal to a stable gas-phase conformation. Intentional gas-phase activation of these aMb species in the trap collision cell further supports this assignment (see the Supporting Information). Charge states +7 through +10 (and to a lesser extent +11) each undergo significant structural changes when the collision cell is enabled, ultimately forming elongated gas-phase structures with narrow drift time distributions. Collisional activation of aMb charge states +12 through +21 results in little to no change in the observed drift times, indicating these structures are already annealed to gas-phase structures.
IR Laser Heating of ESI Droplets.
In order to examine pre-equilibrium unfolding behavior, we irradiate the evaporating droplets leaving the tip of the emitter with 10.6 μm laser light to rapidly heat the droplets as they approach the inlet of the mass spectrometer. A diagram of the experimental setup is shown in Scheme 1.
Scheme 1. Diagram the Experimental Setup for IR Laser Droplet Heating Experiments.
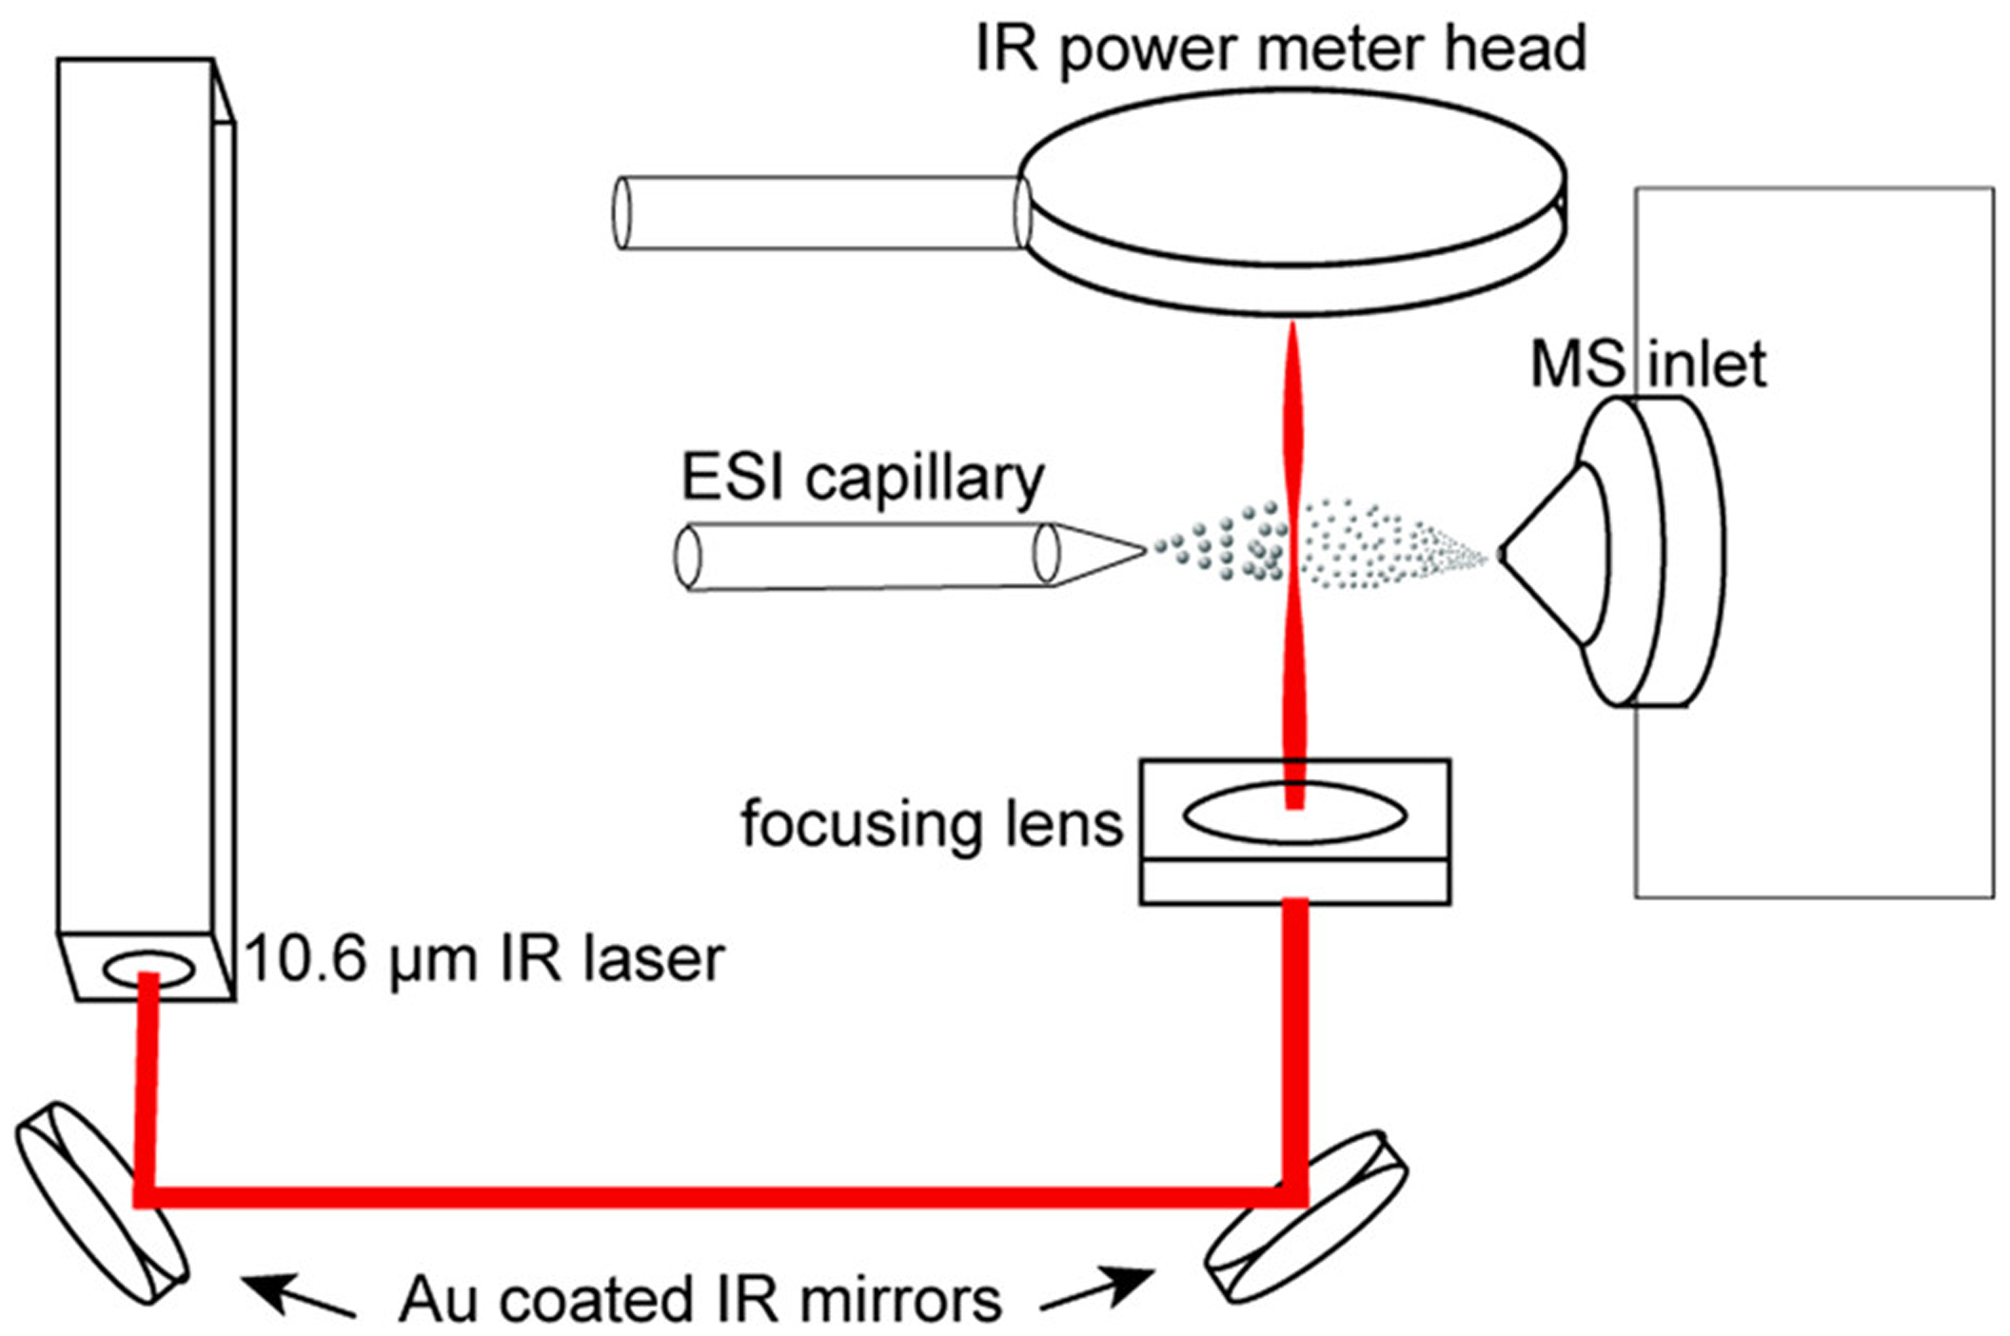
Diagram the Experimental Setup for IR Laser Droplet Heating ExperimentsaaThe laser beam is routed with gold coated mirrors and focused to a point on the plume of droplets as it passes between the ESI emitter and the mass spectrometer inlet.
The degree of heating experienced by the droplets is controlled by increasing the laser output power (from 0 to ~29W). Figure 5 shows mass spectra of the same three samples shown in Figures 1 and 2, but with IR droplet heating rather than heating the bulk solution. Increasing the laser power leads to an increase in the average charge state of Mb, as well as dissociation of the heme to generate aMb at high laser power. The shift to lower Tm values with deviation from neutral pH that was observed in the solution heating experiments appears to be mirrored in these droplet heating experiments. The midpoint power (Pm)values for these melting curves indicates similar destabilizing effects at pH 4.5 and 9. This suggests that the solution environment inside the droplets in the early stages of droplet evaporation resembles the bulk solution.
Figure 5.
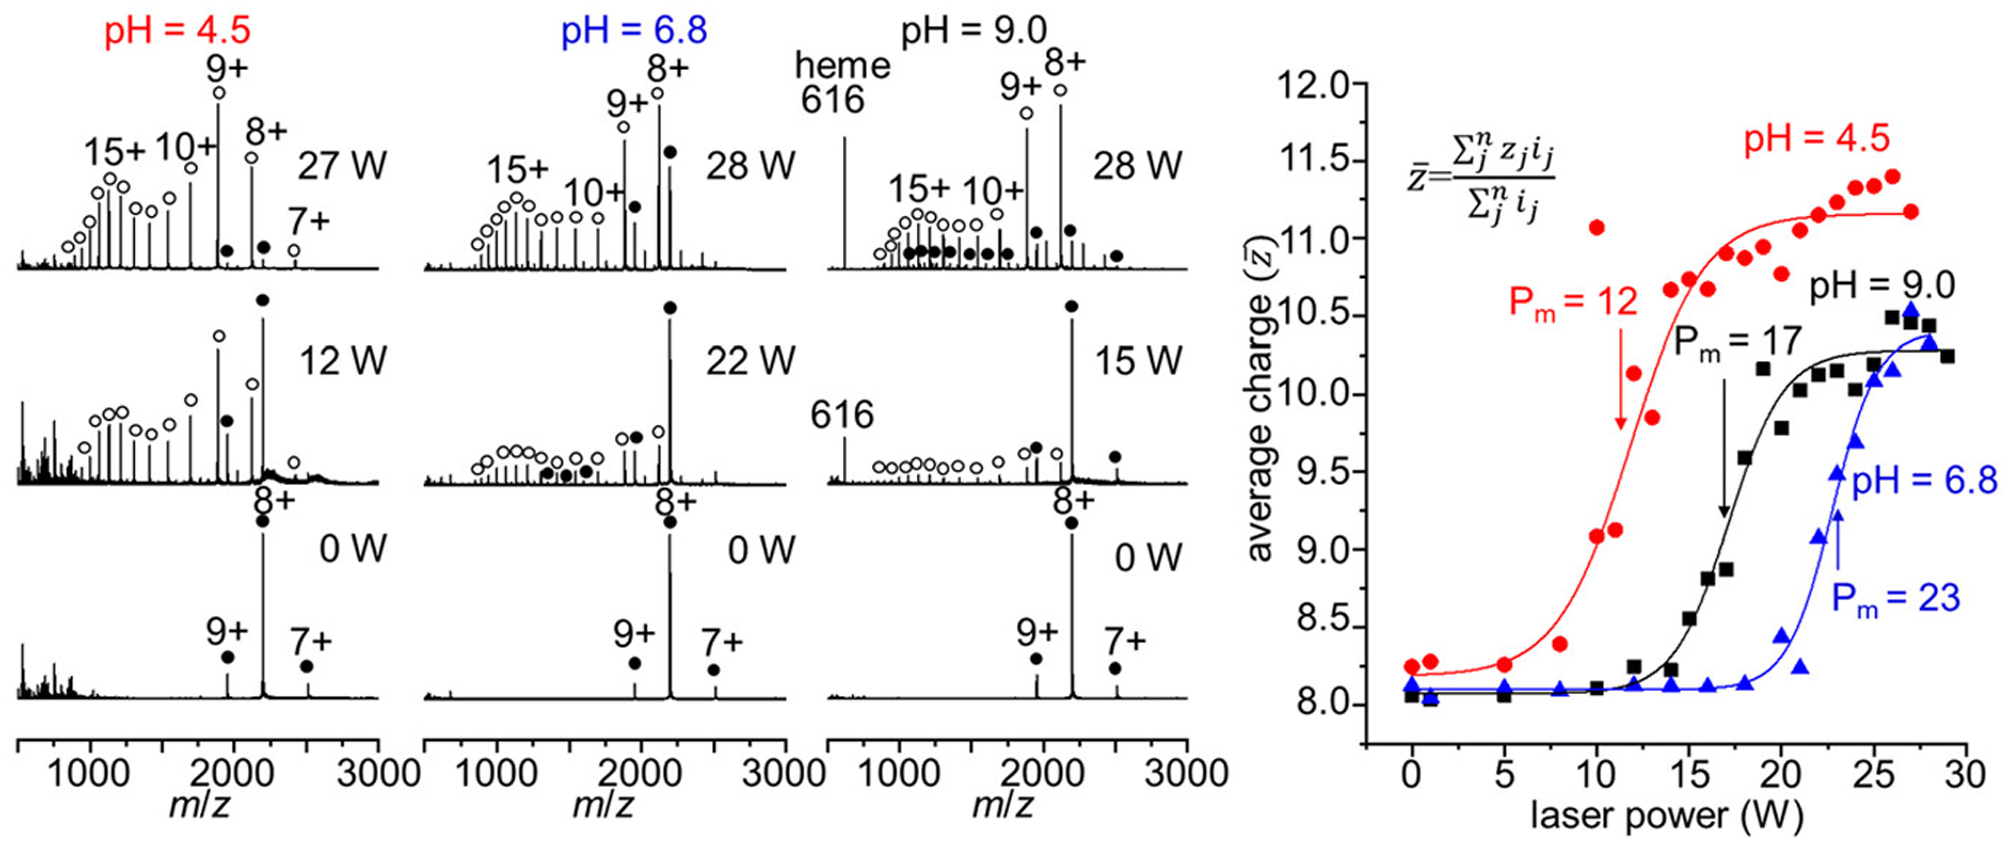
Mass spectra acquired with increasing IR laser irradiation of the ESI droplets of hMb solutions at pH 4.5, 6.8, and 9.0 (left). Average charge state plots as a function of IR laser power (right). Midpoint Pm values are indicated on the sigmoidal curves with arrows.
Effects of Droplet Size on Accessible Unfolding Time Scales.
Our previous droplet heating experiments found evidence that smaller initial droplets spend less time at elevated temperatures when heated by IR light and thus allow shorter time scales for unfolding.19 To further evaluate these findings, the effects of emitter diameter were examined for hMb at pH 9.0. Figure 6 shows three sets of mass spectra acquired at increasing laser power (0, 15, and 29 W) using ESI emitters with diameters of 4, 8, and 24 μm. Increasing the emitter diameter increases the size of the initial droplets generated. We observe a trend toward the formation of higher charge states and greater average charge states with increasing emitter diameters. One possible explanation of these results is that the smaller droplets do not reach the same temperature as the larger droplets and, thus, proteins contained within do not undergo the same degree of unfolding. We argue that this is not the case, as each of the average charge state plots appear to reach a point where the curve is flat, and further increases in the laser power do not result in increased charging. We hypothesize that each of the three droplet sizes reach approximately the same temperature, with smaller droplets requiring less time for complete evaporation, and thus spending less time at elevated temperature. As the emitter size is increased, we note an increase in the maximum charge states formed at high laser power. Additionally, the peaks corresponding to hMb show a pronounced increase in average charge, as the emitter tip size is increased. At the smallest emitter size of 4 μm, the hMb signals correspond to mainly lower charge states (+7 to +10) which are indicative of a folded protein. With larger emitter sizes, and thus longer accessible time scales, the degree of unfolding in both the aMb and hMb species increases. Recent work by Xia and co-workers estimates that aqueous droplets generated from similar sized nESI emitters (0.3–4.0 μm) have lifetimes on the order of 1 to 50 μs,38 providing a rough estimate for the time scales accessed by these studies.
Figure 6.
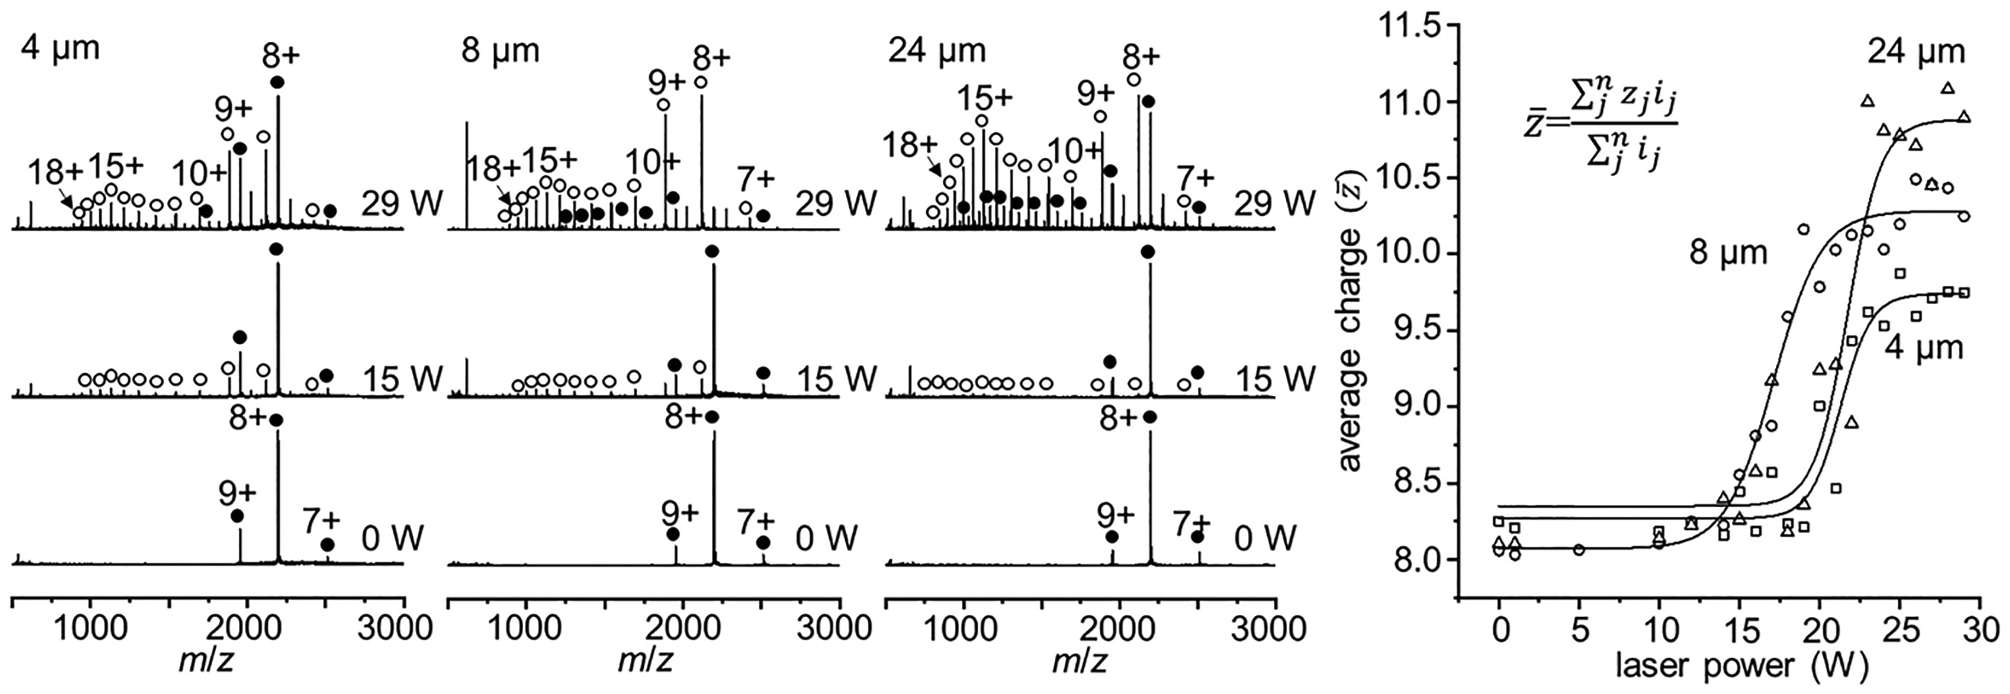
Mass spectra acquired with increasing laser power (0, 15, and 29 W) of hMb at pH 9.0 from ESI emitters with increasing diameters (4, 8, and 24 μm) (left panels). Average charge state plots as a function of IR laser power for each emitter size (right).
To compare the degree of unfolding between the vT-ESI and droplet heating methods, we consider the magnitude of change in the sigmoidal melting curves obtained from each method. The change in average charge state over the span of the sigmoidal melting curve indicates how unfolded the protein is based on the degree of solvent exposure of basic residues. The change in fractional abundance of aMb (Δ[aMb]) can be used as an additional metric for comparing the unfolding based on heme loss. Table 1 shows a comparison of these values for each of solution conditions and emitter sizes studied here, as well as the uncertainty from triplicate measurements. At each solution pH, the value of and Δ[aMb] is considerably lower in the laser droplet heating experiments. For example, at pH 4.5, the value of for the bulk solution measured at equilibrium by vT-ESI is 4.5 compared with the value for the droplet heating which is 3.3. For each case studied here, the value values determined for bulk solution heating is always greater than IR droplet heating experiments. At pH 4.5 and pH 9.0, the difference in with solution heating is as much as a two to 3-fold greater than with laser droplet heating. A similar analysis is performed for the relative concentration of [aMb]. As was the case with average charge state, the relative amount of aMb formed as a result of denaturation is greater in the equilibrium solution heating measurements than with droplet heating. As emitter diameter and, thus, droplet lifetime are increased, the concentrations of [aMb] begin to approach the equilibrium values, and they thus appear to reflect different time points along the unfolding reaction coordinate.
Table 1.
Comparison of Bulk Solution and Droplet Heating Method
| pH = 4.5 | Δza | Δ[aMb]b |
|---|---|---|
| bulk solution | 4.5 ± 0.2 | 0.92 ± 0.02 |
| droplet heating | 3.3 ± 0.4 | 0.79 ± 0.10 |
| pH = 6.8 | ||
| bulk solution | 3.1 ± 0.2 | 0.81 ± 0.05 |
| droplet heating | 2.4 ± 0.4 | 0.78 ± 0.06 |
| pH = 9.0 | ||
| bulk solution | 4.0 ± 1.0 | 0.67 ± 0.05 |
| droplet heating (4 μm) | 1.5 ± 0.1 | 0.56 ± 0.07 |
| droplet heating (8 μm) | 2.0 ± 0.1 | 0.77 ± 0.05 |
| droplet heating (24 μm) | 2.5 ± 0.1 | 0.63 ± 0.11 |
Magnitude of the change in charge state associated with unfolding.
Magnitude of heme loss associated with unfolding.
CONCLUSIONS
We have investigated the unfolding behavior of hMb using a vT-ESI source and an IR laser droplet heating source. The equilibrium unfolding observed by the vT-ESI method allows for simultaneous characterization of the stability of heme binding domain, the individual stabilities of aMb and hMb, and structural changes associated with the loss of heme. All of these changes were observed to occur before the loss of α-helical secondary structure, as determined by complementary temperature-dependent CD measurements. These findings indicate that thermal denaturation of Mb is significantly more complex than what has been described in previous studies, where nearly all traditional approaches observe the denaturation of Mb as a two-state cooperative transition or in some cases three-states involving a molten globule intermediate. We find evidence for at least six unique solution-phase structures of aMb resulting from thermal denaturation as well as seven unique states of hMb (including the two additional compact structures of the +8 and +9 charge states formed at high solution temperatures). The ability of this vT-ESI-IMS-MS approach to deconvolute an ensemble average measurement into some of the constituent states offers a more detailed view and better understanding of how proteins unfold. Additionally, it provides a method for characterizing the stability of both native and non-native states that are difficult to observe by other techniques, with a level of sensitivity that is unique to modern mass spectrometry.
Differences in the degree of unfolding of hMb between the vT-ESI and laser droplet heating methods are observed based on the average charge state and relative abundance of the aMb. While the vT-ESI method allows the protein to reach an equilibrium distribution of structures by maintaining the elevated solution temperature for several minutes, the laser heating approach heats the protein-containing droplets on μs time scales. We attribute the differences in unfolding behavior to the short time scales accessible with this method, which suggests that the structures of the protein ions observed are in a pre-equilibrium partially unfolded state. These transient partially folded structures are difficult to observe by conventional analytical techniques; however, by taking advantage of the unique properties of evaporating ESI droplets and rapid laser heating, they can be trapped and observed by MS.
Supplementary Material
ACKNOWLEDGMENTS
This work is supported in part by funds from the National Institutes of Health (Grant No. 5R01GM121751-03 (D.E.C.)) the Robert and Marjorie Mann Graduate Research Fellowship (D.W.W. and S.A.R.) from Indiana University.
Footnotes
Supporting Information
The Supporting Information is available free of charge at https://pubs.acs.org/doi/10.1021/jasms.0c00075.
nESI emitter micrographs, dissociation threshold mass spectra, and collisionally unfolded IMS spectra (PDF)
The authors declare no competing financial interest.
Contributor Information
Daniel W. Woodall, Department of Chemistry, Indiana University, Bloomington, Indiana 47405, United States
Lucas W. Henderson, Department of Chemistry, Indiana University, Bloomington, Indiana 47405, United States
Shannon A. Raab, Department of Chemistry, Indiana University, Bloomington, Indiana 47405, United States
Kenji Honma, Graduate School of Material Science, University of Hyogo, Kamigori, Hyogo 678-1297, Japan.
David E. Clemmer, Department of Chemistry, Indiana University, Bloomington, Indiana 47405, United States.
REFERENCES
- (1).Best RB; Li B; Steward A; Daggett V; Clarke J Can non-mechanical proteins withstand force? Stretching barnase by atomic force microscopy and molecular dynamics simulation. Biophys. J 2001, 81, 2344–2356. [DOI] [PMC free article] [PubMed] [Google Scholar]
- (2).Oberhauser AF; Hansma PK; Carrion-Vazquez M; Fernandez JM Stepwise unfolding of titin under force-clamp atomic force microscopy. Proc. Natl. Acad. Sci. U. S. A 2001, 98, 468. [DOI] [PMC free article] [PubMed] [Google Scholar]
- (3).Shi H; Pierson NA; Valentine SJ; Clemmer DE Conformation types of ubiquitin [M+8H]8+ Ions from water:-methanol solutions: evidence for the N and A States in aqueous solution. J. Phys. Chem. B 2012, 116, 3344–3352. [DOI] [PMC free article] [PubMed] [Google Scholar]
- (4).Lee VWS; Chen Y-L; Konermann L Reconstitution of Acid-Denatured Holomyoglobin Studied by Time-Resolved Electro-spray Ionization Mass Spectrometry. Anal. Chem 1999, 71 (19), 4154–4159. [DOI] [PubMed] [Google Scholar]
- (5).Sogbein OO; Simmons DA; Konermann L Effects of pH on the kinetic reaction mechanism of myoglobin unfolding studied by time-resolved electrospray ionization mass spectrometry. J. Am. Soc. Mass Spectrom 2000, 11 (4), 312–319. [DOI] [PubMed] [Google Scholar]
- (6).Simmons DA; Wilson DJ; Lajoie GA; Doherty-Kirby A; Konermann L Subunit Disassembly and Unfolding Kinetics of Hemoglobin Studied by Time-Resolved Electrospray Mass Spectrometry. Biochemistry 2004, 43, 14792–14801. [DOI] [PubMed] [Google Scholar]
- (7).Simmons DA; Konermann L Characterization of Transient Protein Folding Intermediates during Myoglobin Reconstitution by Time-Resolved Electrospray Mass Spectrometry with On-Line Isotopic Pulse Labeling. Biochemistry 2002, 41, 1906–1914. [DOI] [PubMed] [Google Scholar]
- (8).Benesch JLP; Sobott F; Robinson CV Thermal dissociation of multimeric protein complexes by using nanoelectrospray mass spectrometry. Anal. Chem 2003, 75, 2208. [DOI] [PubMed] [Google Scholar]
- (9).Woodall DW; El-Baba TJ; Fuller DR; Liu W; Brown CJ; Laganowsky A; Russell DH; Clemmer DE Variable-Temperature ESI-IMS-MS Analysis of Myohemerythrin Reveals Ligand Losses, Unfolding, and a Non-Native Disulfide Bond. Anal. Chem 2019, 91, 6808–6814. [DOI] [PMC free article] [PubMed] [Google Scholar]
- (10).El-Baba TJ; Woodall DW; Raab SA; Fuller DR; Laganowsky A; Russell DH; Clemmer DE Melting Proteins: Evidence for Multiple Stable Structures upon Thermal Denaturation of Native Ubiquitin from Ion Mobility Spectrometry-Mass Spectrometry Measurements. J. Am. Chem. Soc 2017, 139, 6306–6309. [DOI] [PubMed] [Google Scholar]
- (11).Wang G; Abzalimov RR; Kaltashov IA Direct monitoring of heat-stressed biopolymers with temperature-controlled electrospray ionization mass spectrometry. Anal. Chem 2011, 83, 2870–2876. [DOI] [PubMed] [Google Scholar]
- (12).Wang G; Bondarenko PV; Kaltashov IA Multi-step conformational transitions in heat-treated protein therapeutics can be monitored in real time with temperature-controlled electrospray ionization mass spectrometry. Analyst 2018, 143, 670–677. [DOI] [PubMed] [Google Scholar]
- (13).Brown CJ; Woodall DW; El-Baba TJ; Clemmer DE Characterizing Thermal Transitions of IgG with Mass Spectrometry.J. Am. Soc. Mass Spectrom 2019, 30 (11), 2438–2445. [DOI] [PMC free article] [PubMed] [Google Scholar]
- (14).Köhler M; Marchand A; Hentzen NB; Egli J; Begley AI; Wennemers H; Zenobi R Temperature-controlled electrospray ionization mass spectrometry as a tool to study collagen homo- and heterotrimers. Chemical Science 2019, 10, 9829–9835. [DOI] [PMC free article] [PubMed] [Google Scholar]
- (15).Cong X; Liu Y; Liu W; Liang X; Russell DH; Laganowsky A Determining Membrane Protein–Lipid Binding Thermodynamics Using Native Mass Spectrometry. J. Am. Chem. Soc 2016, 138, 4346–4349. [DOI] [PubMed] [Google Scholar]
- (16).El-Baba TJ; Clemmer DE Solution thermochemistry of concanavalin A tetramer conformers measured by variable-temperature ESI-IMS-MS. Int. J. Mass Spectrom 2019, 443, 93–100. [DOI] [PMC free article] [PubMed] [Google Scholar]
- (17).Shi L; Holliday AE; Glover MS; Ewing MA; Russell DH; Clemmer DE Ion Mobility-Mass Spectrometry Reveals the Energetics of Intermediates that Guide Polyproline Folding. J. Am. Soc. Mass Spectrom 2016, 27, 22–30. [DOI] [PMC free article] [PubMed] [Google Scholar]
- (18).Veitshans T; Klimov D; Thirumalai D Protein folding kinetics: timescales, pathways and energy landscapes in terms of sequence-dependent properties. Folding Des 1997, 2, 1–22. [DOI] [PubMed] [Google Scholar]
- (19).Bowman GR; Voelz VA; Pande VS Taming the complexity of protein folding. Curr. Opin. Struct. Biol 2011, 21, 4–11. [DOI] [PMC free article] [PubMed] [Google Scholar]
- (20).Mortensen DN; Williams ER Ultrafast (1 μs) Mixing and Fast Protein Folding in Nanodrops Monitored by Mass Spectrometry.J. Am. Chem. Soc 2016, 138, 3453–3460. [DOI] [PubMed] [Google Scholar]
- (21).El-Baba TJ; Fuller DR; Woodall DW; Raab SA; Conant CR; Dilger JM; Toker Y; Williams ER; Russell DH; Clemmer DE Melting proteins confined in nanodroplets with 10.6 μm light provides clues about early steps of denaturation. Chem. Commun 2018, 54, 3270–3273. [DOI] [PMC free article] [PubMed] [Google Scholar]
- (22).Haynes SE; Polasky DA; Dixit SM; Majmudar JD; Neeson K; Ruotolo BT; Martin BR Variable-Velocity Traveling-Wave Ion Mobility Separation Enhancing Peak Capacity for Data-Independent Acquisition Proteomics. Anal. Chem 2017, 89, 5669–5672. [DOI] [PMC free article] [PubMed] [Google Scholar]
- (23).Ruotolo BT; Benesch JLP; Sandercock AM; Hyung S-J; Robinson CV Ion mobility–mass spectrometry analysis of large protein complexes. Nat. Protoc 2008, 3, 1139. [DOI] [PubMed] [Google Scholar]
- (24).Bush MF; Hall Z; Giles K; Hoyes J; Robinson CV; Ruotolo BT Collision Cross Sections of Proteins and Their Complexes: A Calibration Framework and Database for Gas-Phase Structural Biology. Anal. Chem 2010, 82, 9557–9565. [DOI] [PubMed] [Google Scholar]
- (25).Chowdhury SK; Katta V; Chait BT Probing conformational changes in proteins by mass spectrometry. J. Am. Chem. Soc 1990, 112, 9012–9013. [Google Scholar]
- (26).Grandori R Origin of the conformation dependence of protein charge-state distributions in electrospray ionization mass spectrometry. J. Mass Spectrom 2003, 38, 11–15. [DOI] [PubMed] [Google Scholar]
- (27).Gumerov DR; Dobo A; Kaltashov IA Protein—Ion Charge-State Distributions in Electrospray Ionization Mass Spectrometry: Distinguishing Conformational Contributions from Masking Effects. Eur. J. Mass Spectrom 2002, 8, 123–129. [Google Scholar]
- (28).Fändrich M; Forge V; Buder K; Kittler M; Dobson CM; Diekmann S Myoglobin forms amyloid fibrils by association of unfolded polypeptide segments. Proc. Natl. Acad. Sci. U. S. A 2003, 100, 15463. [DOI] [PMC free article] [PubMed] [Google Scholar]
- (29).Hargrove MS; Olson JS The Stability of Holomyoglobin Is Determined by Heme Affinity. Biochemistry 1996, 35, 11310–11318. [DOI] [PubMed] [Google Scholar]
- (30).Parray ZA; Ahamad S; Ahmad F; Hassan MI; Islam A First evidence of formation of pre-molten globule state in myoglobin: A macromolecular crowding approach towards protein folding in vivo. Int. J. Biol. Macromol 2019, 126, 1288–1294. [DOI] [PubMed] [Google Scholar]
- (31).Esquerra RM; Jensen RA; Bhaskaran S; Pillsbury ML; Mendoza JL; Lintner BW; Kliger DS; Goldbeck RA The pH dependence of heme pocket hydration and ligand rebinding kinetics in photodissociated carbonmonoxymyoglobin. J. Biol. Chem 2008, 283, 14165–14175. [DOI] [PMC free article] [PubMed] [Google Scholar]
- (32).Pahari S; Sun L; Alexov E PKAD: a database of experimentally measured pKa values of ionizable groups in proteins. Database 2019, DOI: 10.1093/database/baz024. [DOI] [PMC free article] [PubMed] [Google Scholar]
- (33).Liong EC; Dou Y; Scott EE; Olson JS; Phillips GN Waterproofing the Heme Pocket: ROLE OF PROXIMAL AMINO ACID SIDE CHAINS IN PREVENTING HEMIN LOSS FROM MYOGLOBIN. J. Biol. Chem 2001, 276, 9093–9100. [DOI] [PubMed] [Google Scholar]
- (34).Liao S-M; Du Q-S; Meng J-Z; Pang Z-W; Huang R-B The multiple roles of histidine in protein interactions. Chem. Cent. J 2013, 7 (1), 44–44. [DOI] [PMC free article] [PubMed] [Google Scholar]
- (35).Konermann L Addressing a Common Misconception: Ammonium Acetate as Neutral pH “Buffer” for Native Electrospray Mass Spectrometry. J. Am. Soc. Mass Spectrom 2017, 28 (9), 1827–1835. [DOI] [PubMed] [Google Scholar]
- (36).Privalov PL; Griko YV; Venyaminov S; Kutyshenko VP Cold denaturation of myoglobin. J. Mol. Biol 1986, 190, 487–498. [DOI] [PubMed] [Google Scholar]
- (37).Vahidi S; Stocks BB; Konermann L Partially Disordered Proteins Studied by Ion Mobility-Mass Spectrometry: Implications for the Preservation of Solution Phase Structure in the Gas Phase. Anal. Chem 2013, 85 (21), 10471–10478. [DOI] [PubMed] [Google Scholar]
- (38).Xia Z; Williams ER Effect of droplet lifetime on where ions are formed in electrospray ionization. Analyst 2019, 144 (1), 237–248. [DOI] [PubMed] [Google Scholar]
Associated Data
This section collects any data citations, data availability statements, or supplementary materials included in this article.


