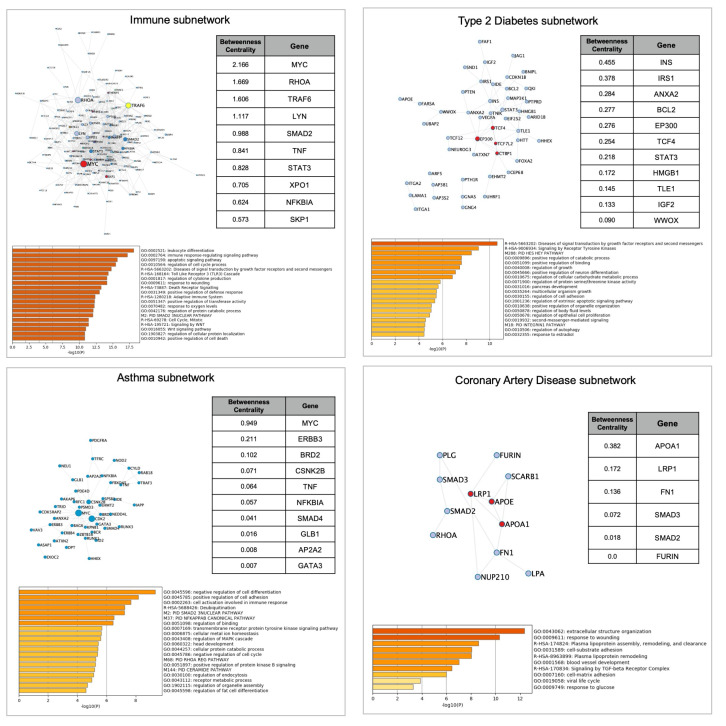
Figure 7. COVID-19 Immune subnetwork an COVID-19 associated comorbidities subnetworks.
Each square contains the network representation, the top nodes ranked by Betweenness Centrality (if >0,00) and the pathways with the highest enrichment. Node size is proportional to betweenness centrality; node color represents densely interconnected subsets.

