

Abstract
Rheumatoid arthritis (RA) is a common autoimmune disease and characterized by chronic inflammation, abnormal synovial cell proliferation, and joint swelling and tenderness, and it causes patients substantial pain. To date, the pathogenesis of RA remains unclear, and specific treatment is still lacking in the clinic. Evidence from previous research indicated that the long noncoding RNA (lncRNA) LOC100912373 is a key lncRNA and involved in RA. However, our understanding of the specific mechanism of lncRNA LOC100912373 in RA development and progression is still in its infancy. In this study, fibroblast-like synoviocytes (FLSs) were cultured by enzyme-dispersed and substrate-attached explant methods. The MTT method, flow cytometry and transmission electron microscopy were used to determine the effect of lncRNA LOC100912373 on FLSs. The expression of key genes such as lncRNA LOC100912373, miR-17-5p, PDK1 and AKT in FLSs was detected by RT-qPCR, immunofluorescence and Western blot. The localization of lncRNA LOC100912373 was determined by fluorescence in situ hybridization. The specific targeting relationship between lncRNA LOC100912373 and miR-17-5p/PDK1 was verified by RNA immunoprecipitation and luciferase reporter gene analysis. The results showed that lncRNA LOC100912373 localized in the cytoplasm and was highly expressed in the synovial tissues and FLSs of AA rats. LncRNA LOC100912373 overexpression promoted the proliferation of FLSs. In addition, lncRNA LOC100912373 could bind to miR-17-5p, and the expression of lncRNA LOC100912373 was negatively correlated with miR-17-5p and positively correlated with PDK1/AKT. In conclusion, lncRNA LOC100912373 may upregulate the expression of PDK1 by sponging miR-17-5p, accelerating the phosphorylation of AKT and inducing the proliferation of FLSs, thus promoting the occurrence and development of RA.
Keywords: Rheumatoid arthritis, fibroblast-like synoviocytes, lncRNA LOC100912373/miR-17-5p/PDK1 axis, ceRNA theory
Introduction
Rheumatoid arthritis (RA) is a systemic and autoimmune disease and characterized by chronic inflammation, abnormal synovial cell proliferation, joint swelling and tenderness, its incidence is as high as 0.5% to 1% in the population, seriously affected people’s health and quality of life [1-3]. Fibroblast-like synoviocytes (FLSs) are the stromal cells of the joint capsule. As a prominent component of synovial pannus tissue, excessive proliferation of FLSs will lead to synovial hyperplasia and progressive joint destruction, and promote the occurrence, development and persistence of RA [4,5]. Nevertheless, to date, the specific pathogenesis of RA has not been fully elucidated. A number of studies have been confirmed that it may be related to immune factors, environmental factors, heredity and so on [6-8]. Accordingly, studying the etiology of RA and elucidating its pathogenesis may identify new targets for the diagnosis and help patients to develop safer and more effective treatment strategies.
Long noncoding RNAs (lncRNAs) are one of the functional noncoding RNAs; they are usually composed of more than 200 bp, do not contain an open reading frame and cannot encode proteins [9,10]. However, lncRNAs can regulate the transcription and translation of genetic information and protein modification, which is closely related to many diseases [11,12]. An increasing number of studies have reported that there is some correlation between lncRNAs and RA [13,14]. In our previous studies [15,16], we found that lncRNA LOC100912373 is a key lncRNA related to RA. However, our understanding of the specific mechanism of lncRNA LOC100912373 in the development and progression of RA is still in its infancy.
The competitive endogenous RNA (ceRNA) theory, which describes a new mechanism of interaction among RNAs, was first proposed by Salmena et al [17] in 2011. Specifically, this theory states that lncRNAs can act as ceRNAs that regulate the expression of downstream target genes by binding to miRNA targets [18,19]. As an important gene regulatory molecule in organisms, the abnormal expression of miRNAs is closely related to a variety of human diseases. MiR-17-5p, a member of the miR-17 family, is involved in the normal development of organisms and the related processes of cell growth and death [20]. PDK1 belongs to the serine/threonine protein kinase family, which can regulate cell proliferation, differentiation, metabolism, apoptosis and other biological functions [21,22]. Several studies have confirmed a certain association between PDK1 and RA, and these researchers have found that inhibition of PDK1 can reduce the proliferation of FLSs and the inflammatory response in RA [23,24].
However, the specific relationship between lncRNA LOC100912373 and the miR-17-5p/PDK1 signaling axis and whether they are related to the occurrence and development of RA need to be verified. Therefore, in the present study, based on the ceRNA theory, we studied whether lncRNA LOC100912373 can modulate PDK1 expression by sponging miR-17-5p to promote the proliferation of FLSs in RA.
Materials and methods
Animals
The subjects used in this study were male Sprague-Dawley SPF-grade rats, which were purchased from the Experimental Animal Center of Anhui Province. All the rats were healthy and free from other diseases and were raised in the animal facility of the First Affiliated Hospital of Anhui University of Chinese Medicine. The experimental scheme was approved by the Animal Ethics Committee of Anhui University of Chinese Medicine (AHUCM-rats-004).
Preparation of the animal model and the collection of synovial tissue
After 1 week of adaptive feeding, complete Freunds adjuvant (Sigma, 1001646446) was injected subcutaneously into the left hindfoot to obtain an adjuvant arthritis (AA) rat model, the specific operation was described by Hui Jiang et al. [25]. The rats were anesthetized with 1.0% sodium pentobarbital anesthesia and were sacrificed after blood was collected from the abdominal aorta on the 20th day after immunization, and then the synovial tissue was then isolated from the knee joint.
Culture and identification of synovial cells
FLSs were cultured in complete DMEM medium with 20% fetal bovine serum (Gibco, 1715752) at 37°C and 5% CO2 by the tissue explant method [26]. The primary and subcultured FLSs were observed under an inverted phase contrast microscope, the subcultured synovial cells were identified by immunofluorescence staining for vimentin, and the specific operation was carried out according to the instructions of the kit.
Synthesis and verification of overexpression plasmid and siRNA
Design and synthesis of lncRNA LOC100912373 overexpression plasmid and siRNA
To overexpress lncRNA LOC100912373, the full-length lncRNA LOC100912373 was cloned into the pcDNA3.1 plasmid (Shanghai GenePharma Co., Ltd) and marked as the pcDNA3.1-LOC100912373 group. Lipofectamine™ 2000 Transfection Reagent (5.0 μL, 7.5 μL and 10.0 μL) (Invitrogen, 939336) was evenly mixed with 2.5 μg DNA to produce three different groups, and the empty pcDNA3.1 vector was used as a control. To inhibit gene expression, lncRNA LOC100912373 sequence information was obtained from the NCBI database, and specific small interfering RNA (siRNA) sequences were designed and synthesized according to its full-length sequence information. siRNA1 Forward sequence 5’-AAUCAAUUUUUUUGUUUCCAU-3’, reverse sequence: 5’-GGAAACAAAAAAAUUGAUUGG-3’, siRNA2 Forward sequence: 5’-AUACAAUUUUGCAAUAAGGAA-3’, reverse sequence: 5’-CCUUAUUGCAAAAUUGUAUUC-3’. siRNA3 Forward sequence: 5’-UCUUUACAGCUUACAUUUCCA-3’, reverse sequence: 5’-GAAAUGUAAGCUGUAAAGAUU-3’. Each siRNA was divided into three different dose groups: 50 pmol, 75 pmol and 100 pmol. All siRNA sequences were synthesized and purchased from GenePharma (Shanghai, China).
Cell transfection
The cells were inoculated in 6-well cell culture plates in advance to ensure that the cells reached 60% to 80% confluence by the time of transfection. The lncRNA LOC100912373 siRNA and overexpression plasmids were transfected into FLSs with Lipofectamine™ 2000 Transfection Reagent (Invitrogen, 939336) according to manufacturer instructions. 48 hours after transfection, the cells were collected and the expression of lncRNA LOC100912373 was detected by qRT-PCR [9].
Cell assay
Detection of FLS proliferation by MTT assay
After transfection, the cells were cultured for 24, 48, and 72 hours. 4 hours before the termination of culture, 10 µL MTT (5 mg/L) was added to each well, and the culture was continued for 4 hours after mixing. At the end of the culture, 150 µL dimethyl sulfoxide (DMSO) was added, and the cells were mixed on the shaker for 10 mins. The optical density (OD) was measured at 570 nm to observe the effect of lncRNA LOC100912373 overexpression or interference on the proliferation of FLSs [26,27].
Detection of the cell cycle by flow cytometry
FLSs were collected and stained with PI (Solarbio, 20190320). The percentage of synovial cells in each stage was detected by flow cytometry (Beckman, CytoFLEX) to observe the effect of lncRNA LOC100912373 overexpression or interference on the cell cycle of FLSs.
Detection of FLS ultrastructure by transmission electron microscopy
FLSs were collected, fixed with 2.5% glutaraldehyde and 1% osmium tetroxide, dehydrated with acetone and impregnated with epoxy resin embedding agent. Finally, the sample was sliced and stained, and the ultrastructure of the cell was detected by transmission electron microscopy.
Quantitative real-time PCR (qRT-PCR)
Total RNA was extracted from cultured cells with an EZ-10 Total RNA Mini-Preps Kit (Sangon Biotech, F918KA3101), and then RNA was reverse transcribed into cDNA by using a reverse transcription kit (ABclonal, 9619580410). PCR analyses were performed with TB Green™ Premix Ex Taq™ II (TAKARA, AK8902). Beta-actin was used as an endogenous control. All results were calculated and expressed as 2-ΔΔCt [28]. The primers were synthesized by Shanghai Sangon Biotech Technology Service Co., Ltd and are shown in Table 1.
Table 1.
Information of primers for qRT-PCR
| Targeted gene | Forward sequence and Reverse sequence | Product length (bp) |
|---|---|---|
| LOC100912373 | F: 5’-TTGATTGGCAAACCGCTTCA-3’ | 156 |
| R: 5’-GGCTTGCATTCCATTCGTCT-3’ | ||
| PDK1 | F: 5’-CTGGCTGGATTTGGTTACGG-3’ | 133 |
| R: 5’-ACTCCGTTGACAGAGCCTTAAT-3’ | ||
| AKT | F: 5’-GCTGGAGAACCTCATGCTG-3’ | 110 |
| R: 5’-GTGTCCCGCAGAACGTC-3’ |
Western blot
FLSs were washed with cold PBS three times and cleaved with 100 μL protein lysis buffer. The lysates were separated by sodium dodecyl sulfate-polyacrylamide gel electrophoresis (SDS-PAGE) and then transferred to a polyvinylidene fluoride (PVDF) membrane. The PVDF membrane was washed with 1× TBST for 2 mins, blocked with 5% skim milk at room temperature for 2 hours, and incubated with anti-PDK1 antibody (1:500), anti-AKT antibody (1:1000), or anti-p-AKT antibody (1:1000) overnight at 4°C. Then, the cells were washed with TBST three times and incubated with an anti-mouse or anti-rabbit HRP-conjugated secondary antibody (1:10000) for 2 hours at room temperature [29]. The protein was detected with an enhanced chemiluminescence kit. Each protein band shown is a representative image from three replicates. Western blotting data were quantified with ImageJ software.
Immunofluorescence
FLSs were fixed with 4% paraformaldehyde for 30 mins. Then, 50-100 μL 0.25% Triton X-100 was added and incubate for 10 mins at room temperature. The sections were washed with PBS for three times, and immunostained with primary antibodies, and incubated overnight in a wet chamber at 4°C. The dilutions of antibodies were PDK1 (1:200), AKT (1:100), and p-AKT (1:200). Then, the cells were stained with the corresponding secondary antibody, and incubated at room temperature for 50 mins. Cell nuclei were stained with DAPI.
Fluorescence in situ hybridization (FISH)
Cell coverslips were fixed with 4% paraformaldehyde for 20 mins. Then, the coverslips were placed in PBS (pH 7.4) and washed on a decolorizing shaker for 3 times for 5 mins each. An immunohistochemical pen was used to draw circles, and according to the characteristics of different tissues, protease K (20 μg/mL) digestion was performed for 1-5 mins, and the coverslips were washed with PBS 3 times for 5 mins each. The prehybridization solution was added and incubated in a 37°C incubator for 1 h then poured out. Then, the hybridization solution was added, and the slide was allowed to hybridize overnight at 4°C. The coverslips were washed once in SSC (2×) for 10 mins, twice in SSC (1×) for 5 mins each, and once in SSC (0.5×) for 10 mins. DAPI dye solution was added, and the coverslips were incubated in the dark for 8 mins, washed with PBS and sealed with anti-fluorescence quenching agent [30]. The cellular localization of lncRNA LOC100912373 was observed under a fluorescence microscope.
Luciferase reporter assay
The interactions between lncRNA LOC100912373 and miR-17-5p and between miR-17-5p and the 3’untranslated region (UTR) of PDK1 mRNA were verified by luciferase reporter gene analysis. PDK1-3’UTR and lncRNA LOC100912373 containing miR-17-5p binding sites were inserted into pGL3 plasmids, and the PDK1-3’UTR-mutant (Mut) and lncRNA LOC100912373-Mut fragments were inserted into the pGL3 plasmid to construct a luciferase reporter vector. The recombinant vector and miR-17-5p simulated by Liposome 2000 reagent were cotransfected into 293T functional cells. The cells were collected at 48 h post-transfection, and luciferase activities were measured using the Luciferase Reporter Assay System (Promega) and normalized to the Renilla luciferase activity.
RNA-binding protein immunoprecipitation (RIP)
The direct binding of lncRNA LOC100912373 and miR-17-5p was detected by RIP. After being digested by trypsin, the cells were collected and resuspended in nuclear separation buffer. The nucleus was precipitated by centrifugation. The nuclear precipitates were resuspended in RIP buffer. After resuspension, the nuclear fraction was divided into two aliquots of 0.5 mL each, followed by mechanical shearing and centrifugation at 13000 rpm for 10 mins. One aliquot was used as an RNA isolation control. The antibody was added to the supernatant and incubated at 4°C for 2 hours, and protein A/G magnetic beads were added for immunoprecipitation. The unbound material was washed off and the bound RNA on RBPs after immunoprecipitation was purified [31]. RNA was treated with reverse transcription DNA enzyme and detected by qPCR.
Statistical analysis
The data were input into SPSS17.0 software for statistical processing, and the results were expressed as the mean ± the SD (standard deviation) (x̅ ± s). A one-way analysis of variance (ANOVA) designed by randomized block design was used to analyze the differences among multiple groups, and independent-sample t-tests and nonparametric tests were used to detect the differences between groups. The result was considered statistically significant when P<0.05.
Results
Identification and activity detection of FLSs
The morphology of FLSs was observed under microscope. After 3 days of culture, the primary synovial cells were partially separated from the edge of synovial tissue (Figure 1A). After the primary synovial cells were cultured for 7 days, the synovial tissue basically disappeared and a large number of synovial cells were dissociated, and the cells were oval and spindle-shaped (Figure 1B). After three passages, the synovial cells were uniform and spindle-shaped, and these FLSs were used in the follow-up experiment (Figure 1C). Under a fluorescence microscope, the cytoplasm labeled with the CY3 antibody was red, and the nucleus labeled with the DAPI antibody was blue. As can be seen from the in Figure 1D-F, the cells in the visual field are fusiform and homogeneous in shape, which is consistent with the standard cell morphology of FLSs.
Figure 1.
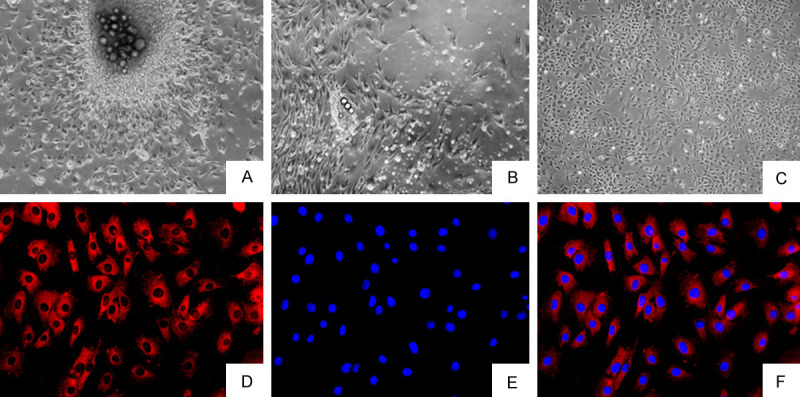
Observation of synovial cell morphology by optical microscopy and fluorescence microscopy (A-C ×40, D-F ×200). (A) Primary culture for 3 days. (B) Primary culture for 7 days. (C) FLSs sub-cultured 3 times. (D-F) Immunocytochemical staining of FLSs.
Expression and cellular localization of lncRNA LOC100912373
As shown in Figure 2A, the expression of lncRNA LOC100912373 in synovial tissues of the model group was significantly higher than that of the control group. As shown in Figure 2B, the expression of lncRNA LOC100912373 in FLSs of the model group was obviously higher than that in the control group.
Figure 2.
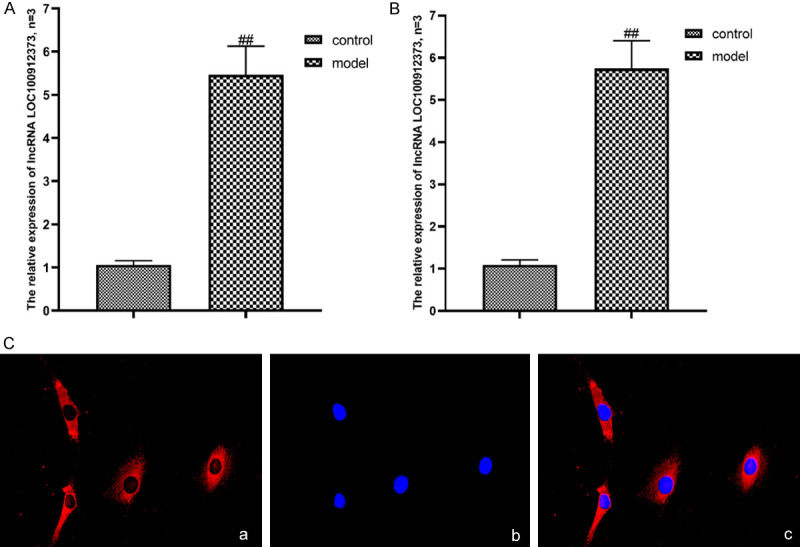
Expression and localization of lncRNA LOC100912373 in synovial tissues and FLSs. A: Expression of lncRNA LOC100912373 in the synovium. B: Expression of lncRNA LOC100912373 in FLSs. ##P<0.01 compared with the control group. C: Localization of lncRNA LOC100912373 in FLSs by FISH (×200). a: CY3 fluorescence staining, b: DAPI fluorescence staining, c: Merge.
According to the ceRNA theory, lncRNAs can regulate miRNAs and downstream target genes only when they are mainly expressed in the cytoplasm. Therefore, we performed a FISH assay of lncRNA LOC100912373 in FLSs, to clarify the intracellular localization of lncRNA LOC100912373. As shown in Figure 2C, lncRNA LOC100912373 was mainly expressed in the cytoplasm.
Cell transfection and verification
After transfection, the cells were stained with fluorescent dyes. As shown in Figure 3A, a large number of cells were successfully transfected in both the pcDNA3.1-LOC100912373 group and the siRNA groups. According to the mRNA expression determined by qRT-PCR, the optimum overexpression concentration of lncRNA LOC100912373 for overexpression was 2.5 μg/5 μL, and the optimum concentration of siRNA for interference was 75 pmol. The results are shown in Figure 3B and 3C. The follow-up experiments were carried out according to the optimum concentration.
Figure 3.
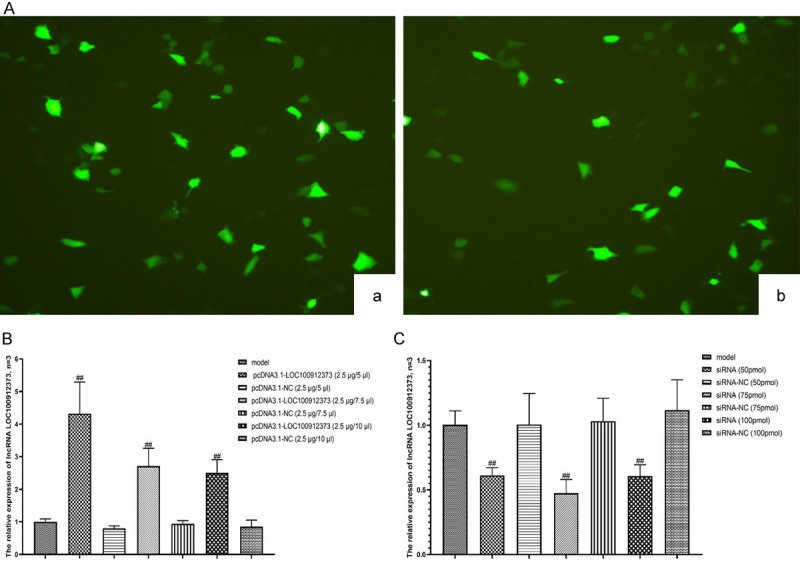
Detection of cell transfection and lncRNA LOC100912373 expression under conditions of overexpression or interference. (A) Observation of cell transfection results under a fluorescence microscope (×100), (a) pcDNA3.1-LOC100912373 group, (b) siRNA group. (B) The relative expression of lncRNA LOC100912373 after overexpression was detected by qRT-PCR. (C) The relative expression of lncRNA LOC100912373 after interference was detected by qRT-PCR. ##P<0.01 compared with the model group.
Effects of lncRNA LOC100912373 overexpression and interference on the proliferation, and cell cycle of FLSs
As shown in Figure 4A, when the reaction time was 24 hours, the range of the change in the cell inhibition rate was lower. When the reaction time was 48 hours and 72 hours, the trend in the in the cell inhibition rate was basically the same; that is, the inhibition rate of lncRNA LOC100912373 overexpression on FLS proliferation was the lowest, while that of lncRNA LOC100912373 interference on FLSs was the highest. Therefore, after comprehensive consideration, 48 h was chosen as the stimulation time for the following experiments.
Figure 4.

The effect on the proliferation and cell cycle of FLSs after lncRNA LOC100912373 overexpression and interference. (A) The OD (570 nm) of each group at different reaction times. (B) Quantification of the cell cycle results. ##P<0.01 compared with the control group, **P<0.01 compared with the model group. (C) The phase of the cell cycle was detected by flow cytometry. (a) Control group, (b) model group, (c) pcDNA3.1-LOC100912373 group, (d) pcDNA3.1-NC group, (e) siRNA group, (f) siRNA-NC group.
As shown in Figure 4B and 4C, compared with the control group, the number of FLSs in G0/G1 phase significantly decreased in the model group, while the number of FLSs in G2/M phase increased significantly. Compared with the model group, the number of FLSs in G0/G1 phase in the pcDNA3.1-LOC100912373 group decreased significantly, while the number of FLSs in G2/M phase increased significantly. In contrast, the number of FLSs in G0/G1 phase was significantly increased and the number of FLSs in G2/M phase was significantly decreased in the siRNA group.
Identification of cell ultrastructure
Under transmission electron microscopy, the FLSs of the control group were fusiform, the nucleus was oval, the nucleolus was clear, the rough endoplasmic reticulum in the cytoplasm was rich, and there was a lack of Golgi complex and a small number of vesicles (Figure 5A). In the model, pcDNA3.1-NC, and siRNA-NC groups, FLSs were slightly edematous and glycogen-rich; mitochondria were fewer in number, slightly swollen and dilated; the membrane was damaged, leading to cytoplasmic leakage. Autophagosomes were formed in the cell body, the rough endoplasmic reticulum were significantly expanded, the nucleus was irregular, heterochromatin was increased and gathered around the nuclear membrane, and the nuclear membrane was indistinct. The outer membrane of the cell was discontinuous and damaged (Figure 5B, 5D and 5F). The above condition of FLSs were significantly aggravated in the pcDNA3.1-LOC100912373 group was significantly aggravated (Figure 5C) and were significantly improved in the siRNA group was significantly improved (Figure 5E).
Figure 5.
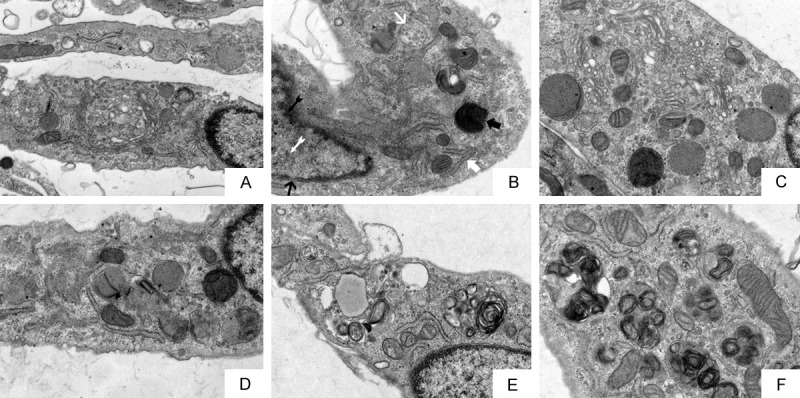
Observation of the ultrastructure of FLSs by transmission electron microscopy after lncRNA LOC100912373 overexpression and siRNA interference (×12000). A: control group. B: model group. C: pcDNA3.1-LOC100912373 group. D: pcDNA3.1-NC group. E: siRNA group. F: siRNA-NC group. In the model group, MARK1 indicates nuclear membrane, MARK2 indicates autophagy AP, MARK3 indicates mitochondrial, MARK4 indicates rough endoplasmic reticulum, MARK5 indicates heterochromatin, MARK6 indicates nucleus.
Effects of lncRNA LOC100912373 overexpression and interference on the expression of miR-17-5p
As shown in the Figure 6, compared with that in the control group, the expression level of miR-17-5p in the model group was significantly decreased. Compared with that in the model group, there was no significant difference in the pcDNA3.1-NC and siRNA-NC groups. The expression level of miR-17-5p in the pcDNA3.1-LOC100912373 group was significantly decreased, while the expression level of miR-17-5p in the siRNA group was significantly increased.
Figure 6.
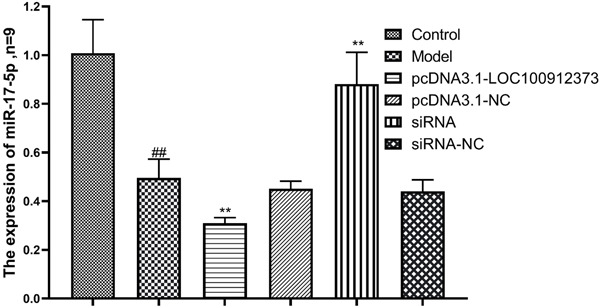
Changes in miR-17-5p expression in FLSs after lncRNA LOC100912373 overexpression and siRNA interference. ##P<0.01 compared with the control group, **P<0.01 compared with the model group.
Effects of lncRNA LOC100912373 overexpression and interference on PDK1
PDK1 has the function of regulating related protein kinases and can affect cell metabolism, growth, proliferation and other physiological processes. As shown in Figure 7, compared with the control group, the expression of PDK1 mRNA and protein in the model group was significantly increased. Compared with the model group, the expression of PDK1 mRNA and protein in the pcDNA3.1-LOC100912373 group was significantly increased, while the expression of PDK1 mRNA and protein in the siRNA group was significantly decreased. There was no significant difference between the pcDNA3.1-NC group, and the siRNA-NC group.
Figure 7.

Changes in PDK1 protein and mRNA expression in FLSs after lncRNA LOC100912373 overexpression and interference. A: Changes in PDK1 protein expression were observed by immunofluorescence technique (×200). B: Changes in PDK1 mRNA expression were observed by qRT-PCR. C: Changes in PDK1 protein expression were observed by Western blot. D: Semiquantitative analysis of PDK1 protein. ##P<0.01 compared with the control group, **P<0.01 compared with the model group.
Effects of lncRNA LOC100912373 overexpression and interference on AKT
AKT, a downstream target gene of PDK1, has functions in regulating glucose metabolism, controlling protein synthesis and affecting cell physiological processes. As shown in Figure 8, compared with the control group, the mRNA and protein expression of AKT in the model group showed no significant change, and the protein level of p-AKT/AKT increased significantly in the model group. Compared with the model group, the mRNA expression of AKT in the pcDNA3.1-LOC100912373 group was not significantly different, and the protein level of p-AKT/AKT increased significantly. In the siRNA group, the mRNA expression of AKT was also not significantly changed, and the protein level of p-AKT/AKT was significantly decreased.
Figure 8.

Changes in AKT protein and mRNA expression in FLSs after lncRNA LOC100912373 overexpression and interference. A: Changes in p-AKT protein expression were observed by immunofluorescence technique (×200). B: Changes in AKT mRNA expression were observed by qRT-PCR. C: Changes in AKT and p-AKT protein expression were observed by Western blot. D: Semiquantitative analysis of p-AKT/AKT protein. ##P<0.01 compared with the control group, **P<0.01 compared with the model group.
LncRNA LOC100912373 can combine with miR-17-5p and upregulate the expression of PDK1
We analyzed the sequences of lncRNA LOC100912373, miR-17-5p and PDK1 and found that lncRNA LOC100912373 has potential miR-17-5p binding ability (Figure 9A), and PDK1 is a potential downstream target gene of miR-17-5p (Figure 9C). To verify their binding relationship, we carried out a luciferase reporter assay. As shown in Figure 9B, compared with the miR-17-5p-NC group, the miR-17-5p mimic group significantly inhibited the luciferase activity of LOC100912373-WT but had no significant effect on the luciferase activity of LOC100912373-Mut, indicating that lncRNA LOC100912373 directly targeted miR-17-5p. As shown in Figure 9D, compared with the miR-17-5p-NC group, the miR-17-5p mimic group significantly inhibited the luciferase activity of PDK1-WT, but had no significant effect on the luciferase activity of PDK1-Mut, indicating that PDK1 is a downstream target gene of miR-17-5p and can bind to it.
Figure 9.
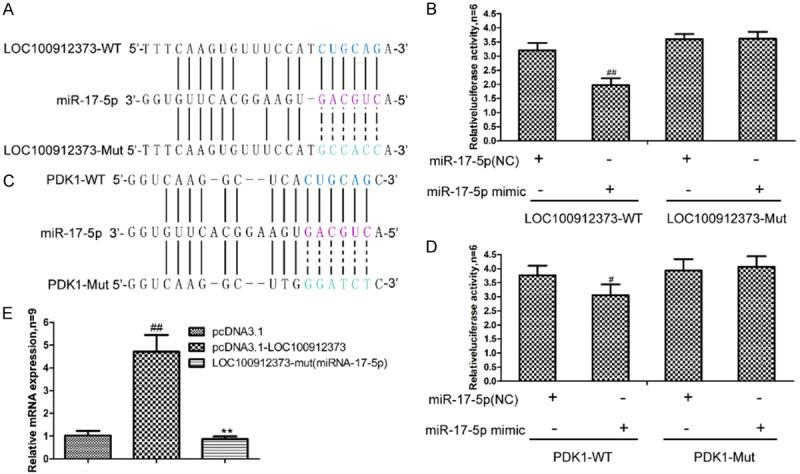
LncRNA LOC100912373 can combine with miR-17-5p and target PDK1. A: Schematic comparison between lncRNA LOC100912373 and the “seed sequence” in miR-17-5p. B: The binding relationship between lncRNA LOC100912373 and miR-17-5p verified by dual luciferase reporter gene assay, ##P<0.01 compared with the NC group. C: Schematic comparison between miR-17-5p and the “seed sequence” in PDK1. D: The binding relationship between PDK1 and miR-17-5p verified by dual luciferase reporter gene assay, #P<0.05 compared with the NC group. E: The enrichment of lncRNA LOC100912373 and miR-17-5p verified by RIP assay. ##P<0.01 compared with the pcDNA3.1 group, **P<0.01 compared with the pcDNA3.1-LOC100912373 group.
For further confirmation, we performed an RIP assay to determine lncRNA LOC100912373 and miR-17-5p enrichment in the immunoprecipitated complex. As shown in Figure 9E, the expression of mRNA in the pcDNA3.1-LOC100912373 group was obviously higher than that in the pcDNA3.1 and LOC100912373-Mut groups, indicating that lncRNA LOC100912373 could enrich miR-17-5p in FLSs.
Discussion
There are many kinds of cells involved in the pathological process of RA, of which FLSs are the most common cell type at the vascular membrane-cartilage junction [32]. FLSs contain a large number of endoplasmic reticulum, the main function of which is protein synthesis [33]. In addition, FLSs can be continuously activated in both inflammatory and noninflammatory environments and show tumor-like proliferation [34]. LncRNAs regulate the homeostasis and function of immune cells to a certain extent and play important roles in immune diseases. [35,36]. Many studies have indicated that there is a close relationship between lncRNAs and the occurrence and development of RA. Zhao et al. found that lncRNA LINC01197 promotes the expression of THBS2 through sponging miR-150, resulting in the inactivation of TLR4/NF-κB, thus reducing the pathogenesis of RA [37]. Xuan et al. also found that the inhibition of lncRNA PICSAR could significantly reduce the proliferation, migration, invasion and pro-inflammatory cytokine production of FLSs [38]. In this study, we confirmed that lncRNA LOC100912373 could regulate the miR-17-5p/PDK1 axis to accelerate the phosphorylation of AKT and induce the proliferation of FLSs, thus promoting the pathogenesis of RA.
LncRNA LOC100912373, an intergenic sense lncRNA, originates from 28480029-28505430 on chromosome 5 and consists of five exons with a combined length of 853 bp. In this study, we found that the expression of lncRNA LOC100912373 in the synovium and FLSs of RA model rats was significantly higher than that of the control group. The overexpression of lncRNA LOC100912373 promoted the proliferation of FLSs, while interference with lncRNA LOC100912373 could significantly inhibit the proliferation of FLSs. Further, the ultrastructural characteristics of FLSs in each group were observed under a transmission electron microscope. The cellular morphological characteristics suggested that the expression of lncRNA LOC100912373 does have an effect on FLSs. The overexpression of lncRNA LOC100912373 caused obvious swelling in the cells and an obvious expansion of the endoplasmic reticulum compared with the model group; in contrast, interference with lncRNA LOC100912373 alleviated the above situation.
However, lncRNA LOC100912373 is a new lncRNA, and its specific mechanism in the occurrence and development of RA is unknown. According to the ceRNA theory, a number of studies have confirmed that it is feasible to study lncRNAs through their target miRNAs and mRNAs with known functions [39-41]. In a previous study, we found through miRNA screening that miR-152-5p, miR-20a-3p, miR-17-2-3p and miR-17-5p were the key genes associated with RA [16]. Through bioinformatics prediction, it was found that there was a high degree of binding between miR-17-5p and lncRNA LOC100912373. Thereafter, through RNA immunoprecipitation and luciferase reporter assays, we found that lncRNA LOC100912373 and miR-17-5p were enriched by the AGO2 antibody. The luciferase activity of LOC100912373-WT was lower than that of LOC100912373-Mut, indicating that miR-17-5p is the downstream target of lncRNA LOC100912373 and can be combined with it. MiR-17-5p belongs to the miR-17-92 gene cluster, which is located in the intron of miR-17HG (host gene of miR-17-92 gene cluster) on human chromosome 13 and plays various roles in cell proliferation, autophagy and apoptosis [42,43]. In this study, we verified the expression of miR-17-5p by RT-qPCR and found that the expression of miR-17-5p was low in RA-FLSs, which was consistent with the results of Akhtar et al. [44]. We further found that the overexpression of lncRNA LOC100912373 decreased the expression of miR-17-5p; in contrast, the expression of miR-17-5p increased after interfering with lncRNA LOC100912373.
PDK1 is one of the potential target genes of miR-17-5p, as evidenced not only by bioinformatics predictions, but also by the luciferase reporter assay in this study. PDK1 is a serine/threonine kinase in the AGC kinase family that contains 556 amino acids [45]. PDK1 has been shown to be closely related to the occurrence and development of RA. Sun et al. found that high expression of PDK1 accelerates the progression of RA [46]. Similar findings were obtained in another study, which found that the inhibition of PDK1 can reduce the proliferation of FLSs and achieve the goal of treating RA [23]. AKT, also known as protein kinase B (PKB), is a downstream target gene of PDK1 [47]. In the PDK1/AKT pathway, phosphatidylinositol 3-kinase is first activated to produce PIP3 on the plasma membrane. Both PDK1 and AKT have a PH domain. Through the binding of its PH domain to PIP3, PDK1 can accelerate the phosphorylation of serine 473 and threonine 308 by AKT, thus activating the AKT signaling pathway [48,49]. The activation of the AKT signaling pathway will promote the activation of the inflammatory factor-related signaling pathway, cause the release of proinflammatory factors such as TNF-α, IL-1β and IL-6, and induce abnormal proliferation and the inflammatory response of FLSs, thus aggravating the occurrence and development of RA [50-52]. In this study, we found that lncRNA LOC100912373 overexpression upregulate the expression of PDK1, promotes the phosphorylation of AKT, activates AKT and causes excessive proliferation of FLSs. In contrast, under the condition of lncRNA LOC100912373 interference, the expression of PDK1 is inhibited, which reduces the activity of AKT and inhibits the proliferation of FLSs.
Conclusion
Based on the ceRNA theory, we studied the targeting by lncRNA LOC100912373 of the miR-17-5p/PDK1 axis and its effects on FLSs. As shown in Figure 10, our study found that lncRNA LOC100912373 competitively binds with miR-17-5p, relieves its inhibition of PDK1, accelerates the phosphorylation of AKT, and causes the excessive proliferation of FLSs, which induces the occurrence and development of RA. This study deepens our understanding of the pathogenesis of RA from the perspective of lncRNAs and provides a new direction and target for the clinical diagnosis and treatment of RA.
Figure 10.
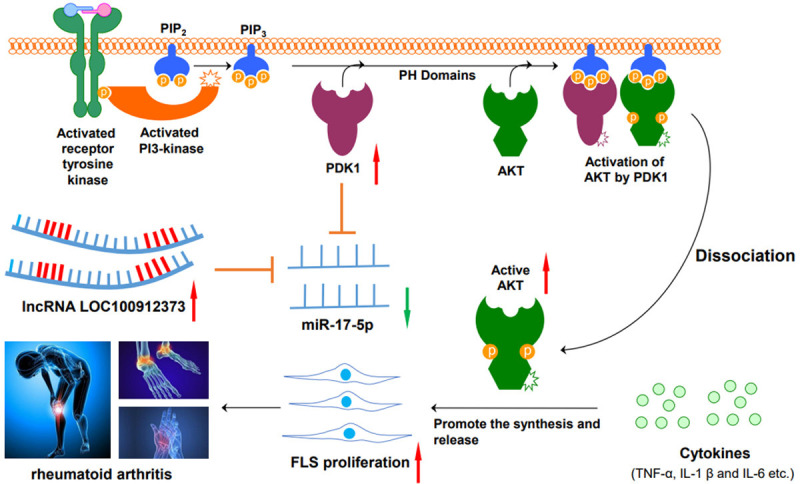
LncRNA LOC100912373 targets miR-17-5p and upregulates PDK1/AKT to promote the proliferation of FLSs, leading to the occurrence and development of RA.
Data availability
The datasets used and/or analyzed during the present study are available from the corresponding author on reasonable request.
Acknowledgements
This work was supported by the National Natural Science Foundation of China (grant no. 81873139), and the 12th Batch of “115” Innovation Team of Anhui Province (Anhui Talent Office [2019] No. 1). We are grateful to Mr. Qiang Fan (Ao Ji Bio-tech Co. Ltd. Shanghai, China) for providing help with data analysis.
Disclosure of conflict of interest
None.
References
- 1.Sparks JA. Rheumatoid arthritis. Ann Intern Med. 2019;170:Itc1–Itc16. doi: 10.7326/AITC201901010. [DOI] [PubMed] [Google Scholar]
- 2.Blum A, Adawi M. Rheumatoid arthritis (RA) and cardiovascular disease. Autoimmun Rev. 2019;18:679–690. doi: 10.1016/j.autrev.2019.05.005. [DOI] [PubMed] [Google Scholar]
- 3.Bystrom J, Clanchy FI, Taher TE, Mangat P, Jawad AS, Williams RO, Mageed RA. TNFα in the regulation of Treg and Th17 cells in rheumatoid arthritis and other autoimmune inflammatory diseases. Cytokine. 2018;101:4–13. doi: 10.1016/j.cyto.2016.09.001. [DOI] [PubMed] [Google Scholar]
- 4.Liu F, Feng XX, Zhu SL, Huang HY, Chen YD, Pan YF, June RR, Zheng SG, Huang JL. Sonic hedgehog signaling pathway mediates proliferation and migration of fibroblast-like synoviocytes in rheumatoid arthritis via MAPK/ERK signaling pathway. Front Immunol. 2018;9:2847. doi: 10.3389/fimmu.2018.02847. [DOI] [PMC free article] [PubMed] [Google Scholar]
- 5.Wei XJ, Li XW, Lu JL, Long ZX, Liang JQ, Wei SB, Lu CX, Lu WZ. MiR-20a regulates fibroblast-like synoviocyte proliferation and apoptosis in rheumatoid arthritis. Eur Rev Med Pharmacol Sci. 2017;21:3886–3893. [PubMed] [Google Scholar]
- 6.Adawi M, Firas S, Blum A. Rheumatoid arthritis and atherosclerosis. Isr Med Assoc J. 2019;21:460–463. [PubMed] [Google Scholar]
- 7.Ferreira CC, Campi-Azevedo AC, Peruhype-Magalhāes V, Coelho-Dos-Reis JG, Antonelli L, Torres K, Freire LC, da Costa-Rocha IA, Oliveira ACV, Maia MLS, de Lima SMB, Domingues CM, Teixeira-Carvalho A, Martins-Filho OA, da Mota LMH Collaborative Group for Studies of Yellow Fever Vaccine. Impact of synthetic and biological immunomodulatory therapy on the duration of 17DD yellow fever vaccine-induced immunity in rheumatoid arthritis. Arthritis Res Ther. 2019;21:75. doi: 10.1186/s13075-019-1854-6. [DOI] [PMC free article] [PubMed] [Google Scholar]
- 8.Yu M, Hou J, Zheng M, Cao Y, Alike Y, Mi Y, Zhu J. IL-21 gene rs6822844 polymorphism and rheumatoid arthritis susceptibility. Biosci Rep. 2020;40:BSR20191449. doi: 10.1042/BSR20191449. [DOI] [PMC free article] [PubMed] [Google Scholar]
- 9.Zhang Y, Wu D, Wang D. Long non-coding RNA ARAP1-AS1 promotes tumorigenesis and metastasis through facilitating proto-oncogene c-Myc translation via dissociating PSF/PTB dimer in cervical cancer. Cancer Med. 2020;9:1855–1866. doi: 10.1002/cam4.2860. [DOI] [PMC free article] [PubMed] [Google Scholar] [Retracted]
- 10.Liang J, Chen W, Lin J. LncRNA: an all-rounder in rheumatoid arthritis. J Transl Int Med. 2019;7:3–9. doi: 10.2478/jtim-2019-0002. [DOI] [PMC free article] [PubMed] [Google Scholar]
- 11.Meng N, Chen M, Chen D, Chen XH, Wang JZ, Zhu S, He YT, Zhang XL, Lu RX, Yan GR. Small protein hidden in lncRNA LOC90024 promotes “cancerous” RNA splicing and tumorigenesis. Adv Sci (Weinh) 2020;7:1903233. doi: 10.1002/advs.201903233. [DOI] [PMC free article] [PubMed] [Google Scholar]
- 12.Zhao J, Zhang W, Lin M, Wu W, Jiang P, Tou E, Xue M, Richards A, Jourd’heuil D, Asif A, Zheng D, Singer HA, Miano JM, Long X. MYOSLID is a novel serum response factor-dependent long noncoding RNA that amplifies the vascular smooth muscle differentiation program. Arterioscler Thromb Vasc Biol. 2016;36:2088–2099. doi: 10.1161/ATVBAHA.116.307879. [DOI] [PMC free article] [PubMed] [Google Scholar]
- 13.Dong L, Wang X, Tan J, Li H, Qian W, Chen J, Chen Q, Wang J, Xu W, Tao C, Wang S. Decreased expression of microRNA-21 correlates with the imbalance of Th17 and Treg cells in patients with rheumatoid arthritis. J Cell Mol Med. 2014;18:2213–2224. doi: 10.1111/jcmm.12353. [DOI] [PMC free article] [PubMed] [Google Scholar]
- 14.Zhang Y, Xu YZ, Sun N, Liu JH, Chen FF, Guan XL, Li A, Wang F, Zhao QF, Wang HY, Song SS, Yu W, Zhao JN, Li XJ. Long noncoding RNA expression profile in fibroblast-like synoviocytes from patients with rheumatoid arthritis. Arthritis Res Ther. 2016;18:227. doi: 10.1186/s13075-016-1129-4. [DOI] [PMC free article] [PubMed] [Google Scholar]
- 15.Jiang H, Qin X, Li W, Ma R, Wang T, Li Z. LncRNAs expression in adjuvant-induced arthritis rats reveals the potential role of LncRNAs contributing to rheumatoid arthritis pathogenesis. Gene. 2016;593:131–142. doi: 10.1016/j.gene.2016.08.012. [DOI] [PubMed] [Google Scholar]
- 16.Jiang H, Ma R, Zou S, Wang Y, Li Z, Li W. Reconstruction and analysis of the lncRNA-miRNA-mRNA network based on competitive endogenous RNA reveal functional lncRNAs in rheumatoid arthritis. Mol bioSystems. 2017;13:1182–1192. doi: 10.1039/c7mb00094d. [DOI] [PubMed] [Google Scholar]
- 17.Salmena L, Poliseno L, Tay Y, Kats L, Pandolfi PP. A ceRNA hypothesis: the Rosetta Stone of a hidden RNA language? Cell. 2011;146:353–358. doi: 10.1016/j.cell.2011.07.014. [DOI] [PMC free article] [PubMed] [Google Scholar]
- 18.Wu J, Huang H, Huang W, Wang L, Xia X, Fang X. Analysis of exosomal lncRNA, miRNA and mRNA expression profiles and ceRNA network construction in endometriosis. Epigenomics. 2020;12:1193–1213. doi: 10.2217/epi-2020-0084. [DOI] [PubMed] [Google Scholar]
- 19.Ma SC, Li Q, Peng JY, Zhouwen JL, Zhang DN, Zhang CB, Jiang WG, Jia W. CLDN5 affects lncRNAs acting as ceRNA dynamics contributing to regulating blood-brain barrier permeability in tumor brain metastasis. Oncol Rep. 2018;39:1441–1453. doi: 10.3892/or.2018.6208. [DOI] [PubMed] [Google Scholar]
- 20.Ding C, Zhu L, Shen H, Lu J, Zou Q, Huang C, Li H, Huang B. Exosomal miRNA-17-5p derived from human umbilical cord mesenchymal stem cells improves ovarian function in premature ovarian insufficiency by regulating SIRT7. Stem Cells. 2020;38:1137–1148. doi: 10.1002/stem.3204. [DOI] [PubMed] [Google Scholar]
- 21.Yan M, Liu Q, Jiang Y, Wang B, Ji Y, Liu H, Xie Y. Long noncoding RNA LNC_000898 alleviates cardiomyocyte apoptosis and promotes cardiac repair after myocardial infarction through modulating the miR-375/PDK1 axis. J Cardiovasc Pharmacol. 2020;76:77–85. doi: 10.1097/FJC.0000000000000845. [DOI] [PubMed] [Google Scholar]
- 22.Han Z, Wu X, Gao Y, Liu X, Bai J, Gu R, Lan R, Xu B, Xu W. PDK1-AKT signaling pathway regulates the expression and function of cardiac hyperpolarization-activated cyclic nucleotide-modulated channels. Life Sci. 2020;250:117546. doi: 10.1016/j.lfs.2020.117546. [DOI] [PubMed] [Google Scholar]
- 23.Ma JD, Jing J, Wang JW, Yan T, Li QH, Mo YQ, Zheng DH, Gao JL, Nguyen KA, Dai L. A novel function of artesunate on inhibiting migration and invasion of fibroblast-like synoviocytes from rheumatoid arthritis patients. Arthritis Res Ther. 2019;21:153. doi: 10.1186/s13075-019-1935-6. [DOI] [PMC free article] [PubMed] [Google Scholar]
- 24.Hossen MJ, Cho JY, Kim D. PDK1 in NF-κB signaling is a target of Xanthium strumarium methanolic extract-mediated anti-inflammatory activities. J Ethnopharmacol. 2016;190:251–260. doi: 10.1016/j.jep.2016.06.019. [DOI] [PubMed] [Google Scholar]
- 25.Jiang H, Liu J, Wang T, Gao JR, Sun Y, Huang CB, Meng M, Qin XJ. Urinary metabolite profiling provides potential differentiation to explore the mechanisms of adjuvant-induced arthritis in rats. Biomed Chromatogr. 2016;30:1397–1405. doi: 10.1002/bmc.3697. [DOI] [PubMed] [Google Scholar]
- 26.Luo C, Liang JS, Gong J, Zhang HL, Feng ZJ, Yang HT, Zhang HB, Kong QH. miRNA-31 over-expression improve synovial cells apoptosis induced by RA. Bratisl Lek Listy. 2018;119:355–360. doi: 10.4149/BLL_2018_066. [DOI] [PubMed] [Google Scholar]
- 27.Wu Y, Li Z, Jia W, Li M, Tang M. Upregulation of stanniocalcin-1 inhibits the development of osteoarthritis by inhibiting survival and inflammation of fibroblast-like synovial cells. J Cell Biochem. 2019;120:9768–9780. doi: 10.1002/jcb.28257. [DOI] [PubMed] [Google Scholar]
- 28.Zhu W, Xu J, Jiang C, Wang B, Geng M, Wu X, Hussain N, Gao N, Han Y, Li D, Lan X, Ning Q, Zhang F, Holmdahl R, Meng L, Lu S. Pristane induces autophagy in macrophages, promoting a STAT1-IRF1-TLR3 pathway and arthritis. Clin Immunol. 2017;175:56–68. doi: 10.1016/j.clim.2016.11.017. [DOI] [PubMed] [Google Scholar]
- 29.Liang Y, Li H, Gong X, Ding C. Long non-coding RNA THRIL mediates cell growth and inflammatory response of fibroblast-like synoviocytes by activating PI3K/AKT signals in rheumatoid arthritis. Inflammation. 2020;43:1044–1053. doi: 10.1007/s10753-020-01189-x. [DOI] [PubMed] [Google Scholar]
- 30.Wang J, Kong X, Hu H, Shi S. Knockdown of long non-coding RNA PVT1 induces apoptosis of fibroblast-like synoviocytes through modulating miR-543-dependent SCUBE2 in rheumatoid arthritis. J Orthop Surg Res. 2020;15:142. doi: 10.1186/s13018-020-01641-6. [DOI] [PMC free article] [PubMed] [Google Scholar]
- 31.Wang J, Zhao Q. LncRNA LINC-PINT increases SOCS1 expression by sponging miR-155-5p to inhibit the activation of ERK signaling pathway in rheumatoid arthritis synovial fibroblasts induced by TNF-α. Int Immunopharmacol. 2020;84:106497. doi: 10.1016/j.intimp.2020.106497. [DOI] [PubMed] [Google Scholar]
- 32.Chen J, Liu M, Luo X, Peng L, Zhao Z, He C, He Y. Exosomal miRNA-486-5p derived from rheumatoid arthritis fibroblast-like synoviocytes induces osteoblast differentiation through the Tob1/BMP/Smad pathway. Biomater Sci. 2020;8:3430–3442. doi: 10.1039/c9bm01761e. [DOI] [PubMed] [Google Scholar]
- 33.Xu H, Zheng SG, Fox D. Editorial: immunomodulatory functions of fibroblast-like synoviocytes in joint inflammation and destruction during rheumatoid arthritis. Front Immunol. 2020;11:955. doi: 10.3389/fimmu.2020.00955. [DOI] [PMC free article] [PubMed] [Google Scholar]
- 34.Yu Z, Xu H, Wang H, Wang Y. Foxc1 promotes the proliferation of fibroblast-like synoviocytes in rheumatoid arthritis via PI3K/AKT signalling pathway. Tissue Cell. 2018;53:15–22. doi: 10.1016/j.tice.2018.05.011. [DOI] [PubMed] [Google Scholar]
- 35.Yang KY, Chen DL. Shikonin inhibits inflammatory response in rheumatoid arthritis synovial fibroblasts via lncRNA-NR024118. Evid Based Complement Alternat Med. 2015;2015:631737. doi: 10.1155/2015/631737. [DOI] [PMC free article] [PubMed] [Google Scholar]
- 36.Lu MC, Yu HC, Yu CL, Huang HB, Koo M, Tung CH, Lai NS. Increased expression of long noncoding RNAs LOC100652951 and LOC100506036 in T cells from patients with rheumatoid arthritis facilitates the inflammatory responses. Immunol Res. 2016;64:576–583. doi: 10.1007/s12026-015-8756-8. [DOI] [PubMed] [Google Scholar]
- 37.Zhao F, Dong J, Guo J, Bi L. Inhibiting role of long non-coding RNA LINC01197 in inflammation in rheumatoid arthritis through the microRNA-150/THBS2 axis. Exp Cell Res. 2020;394:112136. doi: 10.1016/j.yexcr.2020.112136. [DOI] [PubMed] [Google Scholar]
- 38.Bi X, Guo XH, Mo BY, Wang ML, Luo XQ, Chen YX, Liu F, Olsen N, Pan YF, Zheng SG. LncRNA PICSAR promotes cell proliferation, migration and invasion of fibroblast-like synoviocytes by sponging miRNA-4701-5p in rheumatoid arthritis. EBioMedicine. 2019;50:408–420. doi: 10.1016/j.ebiom.2019.11.024. [DOI] [PMC free article] [PubMed] [Google Scholar]
- 39.Yin J, Zeng X, Ai Z, Yu M, Wu Y, Li S. Construction and analysis of a lncRNA-miRNA-mRNA network based on competitive endogenous RNA reveal functional lncRNAs in oral cancer. BMC Med Genomics. 2020;13:84. doi: 10.1186/s12920-020-00741-w. [DOI] [PMC free article] [PubMed] [Google Scholar]
- 40.Wang L, Xiao B, Yu T, Gong L, Wang Y, Zhang X, Zou Q, Zuo Q. lncRNA PVT1 promotes the migration of gastric cancer by functioning as ceRNA of miR-30a and regulating snail. J Cell Physiol. 2020;236:536–548. doi: 10.1002/jcp.29881. [DOI] [PubMed] [Google Scholar]
- 41.Nie J, Zhao Q. Lnc-ITSN1-2, derived from RNA sequencing, correlates with increased disease risk, activity and promotes CD4(+) T cell activation, proliferation and Th1/Th17 cell differentiation by serving as a ceRNA for IL-23R via sponging miR-125a in inflammatory bowel disease. Front Immunol. 2020;11:852. doi: 10.3389/fimmu.2020.00852. [DOI] [PMC free article] [PubMed] [Google Scholar]
- 42.Chatterjee A, Chattopadhyay D, Chakrabarti G. MiR-16 targets Bcl-2 in paclitaxel-resistant lung cancer cells and overexpression of miR-16 along with miR-17 causes unprecedented sensitivity by simultaneously modulating autophagy and apoptosis. Cell Signal. 2015;27:189–203. doi: 10.1016/j.cellsig.2014.11.023. [DOI] [PubMed] [Google Scholar]
- 43.Yang F, Li Y, Xu L, Zhu Y, Gao H, Zhen L, Fang L. miR-17 as a diagnostic biomarker regulates cell proliferation in breast cancer. Onco Targets Ther. 2017;10:543–550. doi: 10.2147/OTT.S127723. [DOI] [PMC free article] [PubMed] [Google Scholar]
- 44.Akhtar N, Singh AK, Ahmed S. MicroRNA-17 suppresses TNF-α signaling by interfering with TRAF2 and cIAP2 association in rheumatoid arthritis synovial fibroblasts. J Immunol. 2016;197:2219–2228. doi: 10.4049/jimmunol.1600360. [DOI] [PMC free article] [PubMed] [Google Scholar]
- 45.Wei Y, Han X, Zhao C. PDK1 regulates the survival of the developing cortical interneurons. Mol Brain. 2020;13:65. doi: 10.1186/s13041-020-00604-6. [DOI] [PMC free article] [PubMed] [Google Scholar]
- 46.Sun C, Sun Y, Jiang D, Bao G, Zhu X, Xu D, Wang Y, Cui Z. PDK1 promotes the inflammatory progress of fibroblast-like synoviocytes by phosphorylating RSK2. Cell Immunol. 2017;315:27–33. doi: 10.1016/j.cellimm.2016.10.007. [DOI] [PubMed] [Google Scholar]
- 47.Wanigasooriya K, Tyler R, Barros-Silva JD, Sinha Y, Ismail T, Beggs AD. Radiosensitising cancer using phosphatidylinositol-3-Kinase (PI3K), protein kinase B (AKT) or mammalian target of rapamycin (mTOR) inhibitors. Cancers (Basel) 2020;12:1278. doi: 10.3390/cancers12051278. [DOI] [PMC free article] [PubMed] [Google Scholar]
- 48.Bamodu OA, Chang HL, Ong JR, Lee WH, Yeh CT, Tsai JT. Elevated PDK1 expression drives PI3K/AKT/MTOR signaling promotes radiation-resistant and dedifferentiated phenotype of hepatocellular carcinoma. Cells. 2020;9:746. doi: 10.3390/cells9030746. [DOI] [PMC free article] [PubMed] [Google Scholar]
- 49.Zhang X, Zhong S. PDK1 inhibitor GSK-470 exhibits potent anticancer activity in a pheochromocytoma PC12 cell tumor model via Akt/mTOR pathway. Anticancer Agents Med Chem. 2020;20:828–833. doi: 10.2174/1871520620666200318100701. [DOI] [PubMed] [Google Scholar]
- 50.Li G, Liu Y, Meng F, Xia Z, Wu X, Fang Y, Zhang C, Zhang Y, Liu D. LncRNA MEG3 inhibits rheumatoid arthritis through miR-141 and inactivation of AKT/mTOR signalling pathway. J Cell Mol Med. 2019;23:7116–7120. doi: 10.1111/jcmm.14591. [DOI] [PMC free article] [PubMed] [Google Scholar]
- 51.Wei ST, Sun YH, Zong SH, Xiang YB. Serum levels of IL-6 and TNF-α may correlate with activity and severity of rheumatoid arthritis. Med Sci Monit. 2015;21:4030–4038. doi: 10.12659/MSM.895116. [DOI] [PMC free article] [PubMed] [Google Scholar]
- 52.Nadiv O, Beer Y, Goldberg M, Agar G, Loos M, Katz Y. Decreased induction of IL-1beta in fibroblast-like synoviocytes: a possible regulatory mechanism maintaining joint homeostasis. Mol Immunol. 2007;44:3147–3154. doi: 10.1016/j.molimm.2007.02.001. [DOI] [PubMed] [Google Scholar]
Associated Data
This section collects any data citations, data availability statements, or supplementary materials included in this article.
Data Availability Statement
The datasets used and/or analyzed during the present study are available from the corresponding author on reasonable request.