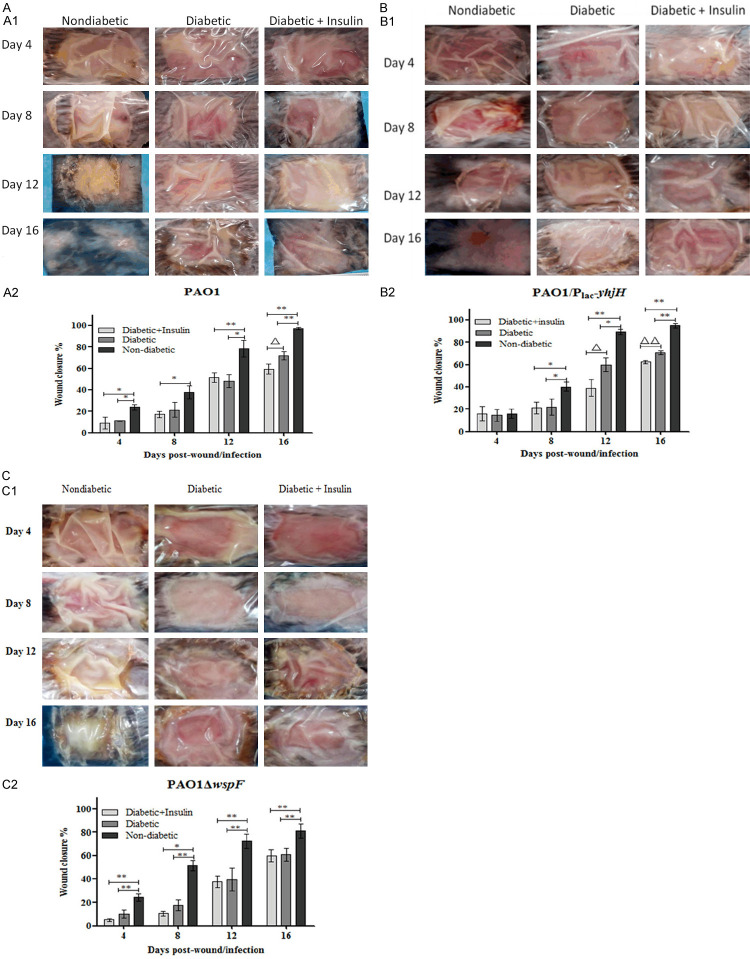
In this article published in AJCR, we make an honest mistake on the Figure 3B, one of the images for wound closure in the PAO1/Plac-yhjH infection model on day 8 of nondiabetic mice, which was a typographical error when we submitted this manuscript to the journal.
Figure 3.
(A) Wound closure in the P. aeruginosa infection model was delayed in the PAO1 control group of diabetic mice. All wounds were measured at 4-day intervals to assess wound closure (representative images are shown in A1). The percent wound closure was determined using the following equation: (A0-At)/A0 × 100, where A0 was the wound area on the day of surgery, and At was the wound area on the day of observation (A2). One-way analysis of variance (ANOVA) followed by the Tukey-Kramer multiple comparison test was used. Note: *P < 0.05 compared with the nondiabetic group, **P < 0.01 compared with the nondiabetic group, ΔP < 0.05 compared with the diabetic group. (B) Wound closure in the P. aeruginosa infection model was delayed in the PAO1/Plac-yhjH-infected group of diabetic mice. All wounds were measured at 4-day intervals to assess wound closure (representative images are shown in B1). The percent wound closure was determined using the following equation: (A0-At)/A0 × 100, where A0 was the wound area on the day of surgery, and At was the area of the wound on the day of observation (B2). One-way analysis of variance (ANOVA) followed by the Tukey-Kramer multiple comparison test was used. Note: *P < 0.05 compared with the nondiabetic group, **P < 0.01 compared with the nondiabetic group, ΔP < 0.05 compared with the diabetic group, ΔΔP < 0.01 compared with the diabetic group. (C) Wound closure in the P. aeruginosa infection model was delayed in the PAO1ΔwspF-infected group of diabetic mice. All wounds were measured at 4-day intervals to assess wound closure (representative images are shown in C1). The percent wound closure was determined using the following equation: (A0-At)/A0 × 100, where A0 was the wound area on the day of surgery, and At was the area of the wound on the day of observation (C2). One-way analysis of variance (ANOVA) followed by the Tukey-Kramer multiple comparison test was used. Note: *P < 0.05 compared with the nondiabetic group, **P < 0.01 compared with the nondiabetic group.
We also apologize for another mistake in Figure 3C ascribable to our careless proofreading, the annotation of observation time for assessing wound closure on Figure 3C1 from top to bottom should be “Day 4, Day 8, Day 12, Day 16” instead of the several consecutive “Day 4”.
These errors do not affect the final results and conclusions for the current study in this article. The corrected figures are as below.


