Abstract
Measurements of cartilage defect size under an arthroscope are essential for prognosis and treatment decisions. A new method called arthroscopic measurement by computer graphics (ACG) was developed to accurately calculate the size of the cartilage under an arthroscope. This study aimed to validate the accuracy and utility of this method. In this controlled laboratory study, the ACG method was validated by measuring the sizes of three cartilage defects in a knee joint of a pig, using the following techniques: traditional arthroscopic measurement by ruler (TAR), ACG, incised measurement by computer graphics (ICG), and incised measurement by ruler (IR, control, gold standard). Measurements were conducted by two blinded trained observers. Intra- and inter-observer variabilities were determined by calculating the intra-class correlation coefficient (ICC). Consistency among TAR, ACG, ICG and IR was analyzed using the command “Concord” in Stata. For arthroscopic measurements using ACG and ICG, the overall ICC intra- and inter-observer values were 0.99 and 0.98, respectively, which showed excellent reproductivity. The concord value showed consistency of various approaches relative to the gold standard method. The average concord value for TAR was 0.813, and the average concord value for ACG and ICG was 0.886 and 0.917, respectively. ACG utilizes computer graphics for measuring the size of cartilage defects of any size under an arthroscope, without reconditioning the injured cartilage. ACG showed excellent intra- and inter-observer reproducibility and satisfactory accuracy. This method would make it possible to more accurately match the graft with the defect, thereby facilitating cartilage repair.
Keywords: Measurement, under arthroscope, computer graphics
Introduction
During arthroscopy of the knee joint, 63% of the cases were found to have cartilage defects [1]. Both the depth and size of the cartilage lesion are essential for the diagnosis and treatment decisions for repairing cartilage lesions [2]. The most common method of estimating the size of cartilage defects under an arthroscope is by measurement defect size using a probe or a ruler [3-5]. The traditional arthroscopic measurement using a ruler (TAR) presents satisfactory accuracy for measuring smaller defects. However, the measuring probe cannot be placed closely to the defects in some cases, which reduces the accuracy of measurement and prolongs the surgical time.
Previous studies have reported methods for arthroscopic measurement of cartilage defects, including estimation of the thickness of cartilage defects using BioOptico optical reflection spectroscopy [6], estimation of the full-thickness lesion area after removal of the injured cartilage [2], or estimation of the cartilage lesions by using the lesion’s arc [1]. However, none of the studies reported estimation of the size of irregular cartilage defects under arthroscope. Therefore, a software program of arthroscopic measurement by computer graphics (ACG) was developed to estimate the size of cartilage defects under an arthroscope. The basic principle of this method is to determine the ratio of pixels found within a 1-mm area by placing a proportional scale ruler in the cartilage defect and to estimate the size of the cartilage defects according to the ratio.
In this study, we hypothesized that the ACG method presented good intra- and inter-observer reproducibility and satisfactory accuracy. Thus, this study aimed to validate the utility of the ACG method by conducting experiments in a pig model and to compare its accuracy with the TAR method.
Materials and methods
Specimen inclusion and cartilage defects creation
A healthy fresh pig knee joint without injuries obtained from the animal center of our institution was used for this study. Ethical approval (2010-0089) was obtained from the university’s ethics committee. The surgeon created three defects under arthroscope in the medial femoral condyle, lateral femoral condyle, and femoral trochlear. To measure the same distance of lines on defects by different methods, we drilled six holes with a diameter of 2 mm along the periphery of each defect under arthroscope.
Procedures of measuring cartilage defect sizes using various methods
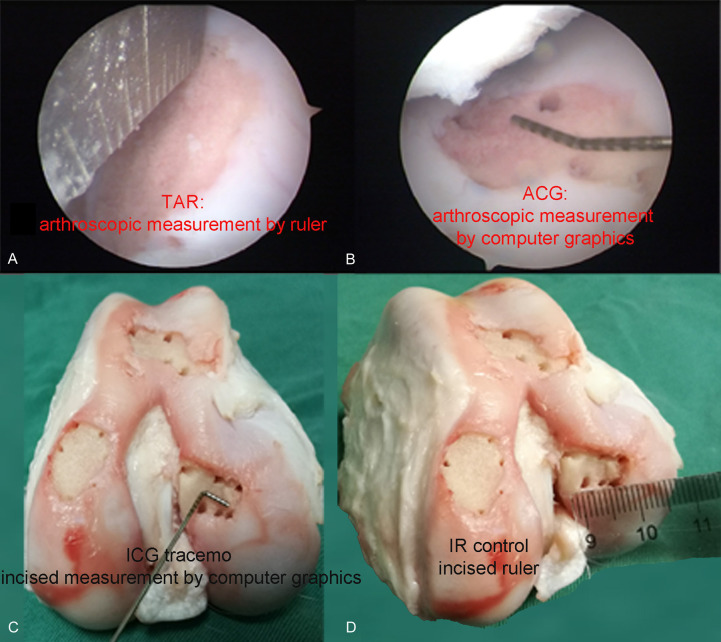
The distances (a distance is the length between the centers of two holes) in each defect were measured using the following methods: TAR, ACG, incised measurement by computer graphics (ICG), and incised measurement by a ruler (IR, control, gold standard) (Figure 3).
Figure 3.
Four methods of measuring cartilage defects. A. Traditional arthroscopic measurement by ruler: TAR (measure distance by ruler under arthroscopy). B. Arthroscopic measurement by computer graphics: ACG tracemo (take pictures under arthroscopy, measure distance by software Tracemo). C. Incised measurement by computer graphics: ICG tracemo (take pictures after incised, measure distance by software Tracemo). D. Incised ruler: IR control (measure distance by ruler after incised).
The procedures of measuring defect sizes are shown in Figure 1. Detailed steps in carrying out the ACG and ICG methods are illustrated in Figure 2.
Figure 1.
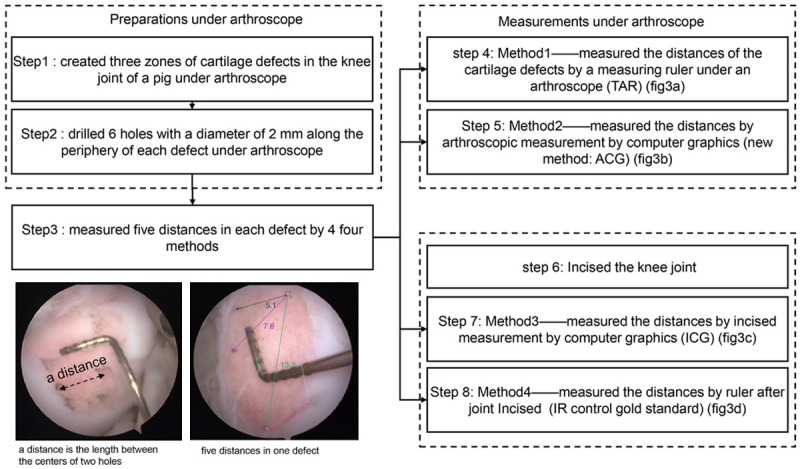
The experiment procedures of four methods (Traditional arthroscopic measurement by ruler: TAR, arthroscopic measurement by computer graphics: ACG tracemo, incised measurement by computer graphics: ICG tracemo, incised ruler: IR control) measuring the defects distances.
Figure 2.
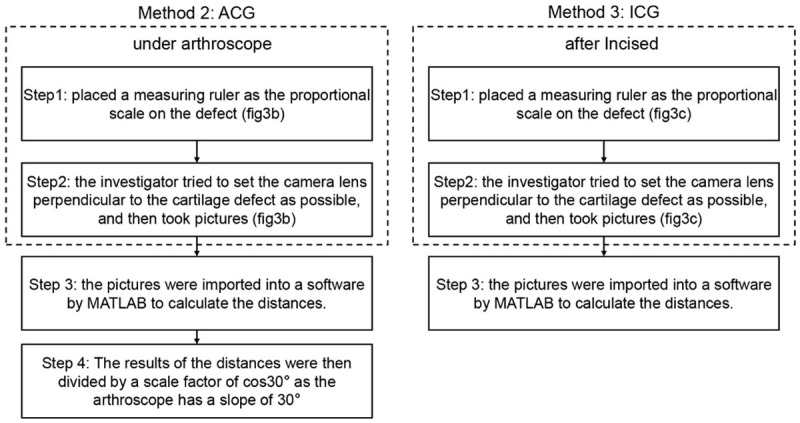
Steps of the ACG and ICG methods (place measuring ruler, take pictures, calculate distances by the software Tracemo).
The TAR method is used to measure the size of cartilage defects using a ruler under an arthroscope (Figure 3A). In the ACG method (Figure 3B), a ruler with a minimum scale of 1 mm, which was custom-made by a professional factory, was placed on the cartilage defect and used as the proportional scale. The investigator tried to set the camera lens perpendicular to the cartilage defect as much as possible. Pictures were then imported into the software “Tracemo” developed based on MATLAB (version 2016b, MathWorks Inc., Natick, USA) (Figure 3B). To study the effects of the position of the proportional scale ruler on the results, the ACG method was performed with the ruler placed in different positions and different orientations (parallel: top, middle, bottom; vertical: left, middle, right; Figure 4).
Figure 4.
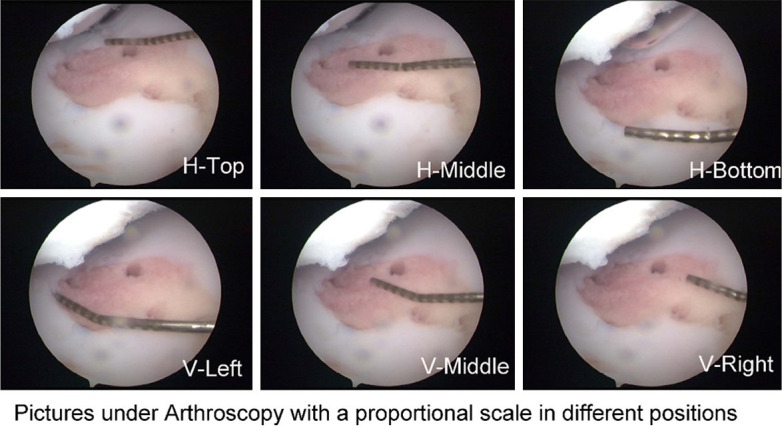
Pictures, which were used in ACG method, taken under an arthroscopy with a measuring probe as the proportional scale in different positions. (horizontal: top, middle, bottom; vertical: left, middle, right).
After the arthroscopic measurements, the joint was incised to measure the cartilage defects using the ICG and IR methods. The technique in the ICG method (Figure 3C) was similar to that in the ACG method, except that the pictures were taken after the knee was incised (Figure 3C). Two trained observers performed the ACG and ICG methods three times in a blinded manner. In the IR method, a ruler was placed just across the center of the two holes, and the distance between the centers of the holes was calculated (Figure 3D).
Principle of ACG
We measured the distance between two points in a cartilage defect by using a measuring ruler as the proportional scale under an arthroscope. The use of the ruler enables us to evaluate the ratio of the pixels present within a 1-mm area; thus, any distance can be calculated according to this ratio. The results of the distances were then divided by a scale factor of cos30° as the arthroscope has a slope of 30°.
Statistical analysis
The intra- and inter-observer variabilities were evaluated in SPSS v25 (SPSS Inc., Chicago, Illinois, USA), using the intra-class correlation coefficient (ICC), which describes how strongly units in the same group resemble each other [7]. The ICC values were interpreted according to Fleiss [8] as follows: <0.4, poor; 0.4-0.75, fair to good; and >0.75, excellent reproducibility.
As a useful tool for measuring differences in values [9], the Bland-Altman method was used to compare measured distances using various approaches (by arthroscopy and by software) relative to the gold standard (by incision). Paired t-test was used to compare absolute values of TAR-IR (TAR minus IR) and ACG-IR (ACG minus IR). Bias of various approaches relative to the gold standard were calculated using the following formula, absolute values of ACG-IR, ICG-IR, TAR-IR divided by IR.
ACG.Bias=|ACG-IR|/IR; ICG.Bias=|ICG-IR|/IR; TAR.Bias=|TAR-IR|/IR.
Consistency between the TAR and ACG methods by software and by incision (gold standard, IR) was analyzed using the command “Concord” in Stata 13.0 (Stata Corp., College Station, TX, USA).
Clinical application
The method was then validated in cartilage repair surgeries. Marked points were traced along the boundaries of the cartilage defects by a trained surgeon using the software. Then, the coordinates of the marked points were exported. The graft was clipped along the spline lines of the marked points. Then, the graft was mapped with the cartilage defects.
Results
Variability
Fifteen lines in the cartilage defects were evaluated by the TAR, ACG, ICG, and IR methods. The results of the four methods are shown in Table 1.
Table 1.
ICC and concord of various approaches
| ICC-Ob1 | ICC-Ob2 | Concord-obs1 | Concord-obs2 | |
|---|---|---|---|---|
| ACG-H-top | 0.999145 | 0.9994585 | 0.916 | 0.910 |
| ACG-H-Middle | 0.975016 | 0.999399 | 0.963 | 0.950 |
| ACG-H-bottom | 0.994961 | 0.9982521 | 0.729 | 0.718 |
| ACG-V-Left | 0.997965 | 0.9990984 | 0.904 | 0.911 |
| ACG-V-Middle | 0.998048 | 0.9988644 | 0.936 | 0.961 |
| ACG-H-right | 0.99841 | 0 .9981633 | 0.855 | 0.869 |
| Means of ACG | 0.994 | 0.9998 | 0.884 | 0.887 |
| IR | 0.999598 | 0.9998088 | ||
| ICG-H-top | 0.998694 | 0.9986674 | 0.955 | 0.909 |
| ICG-H-middle | 0.995167 | 0.99864 | 0.956 | 0.874 |
| ICG-H-bottom | 0.997932 | 0.999136 | 0.943 | 0.903 |
| ICG-V-Left | 0.999662 | 0.9881695 | 0.898 | 0.860 |
| ICG-V-Middle | 0.998513 | 0.9992117 | 0.945 | 0.902 |
| ICG-H-right | 0.997644 | 0.9988804 | 0.947 | 0.904 |
| Means of ICG | 0.998 | 0.997 | 0.94 | 0.892 |
| TAR | 0.996747 | 0.9967471 | 0.813 | 0.813 |
For the arthroscopic measurements using the “Tracemo” software (ACG method), the overall ICC intra-observer value for the two observers was excellent according to the criteria described by Fleiss [8] (0.996 and 0.998 for observers A and B, respectively), and the overall ICC inter-observer value (0.98) showed excellent reproducibility. For the TAR method, the overall intra-observer ICC was 0.996.
Consistency of various approaches relative to the gold standard
The consistency of various approaches relative to the gold standard analyzed by “Concord” in Stata is shown in Table 1. The concord value for the TAR method was 0.813, whereas those for the ACG and ICG methods were 0.886 and 0.917, respectively. The consistency was higher when the proportional scale ruler was placed horizontally in the middle of the defect.
Differences of various approaches relative to the gold standard
Differences in the values of various approaches (by arthroscopy and by software) relative to the gold standard (by incision) analyzed using the Bland-Altman method are shown in Figure 5. The maximum length difference between the ACG and IR methods was approximately 3 mm, whereas that between the TAR and IR methods was approximately 5 mm. The ACG-IR value was significantly lower than the TAR-IR value (mean ± standard differences: 0.73 ± 0.56, 1.56 ± 1.3, P = 0.012).
Figure 5.
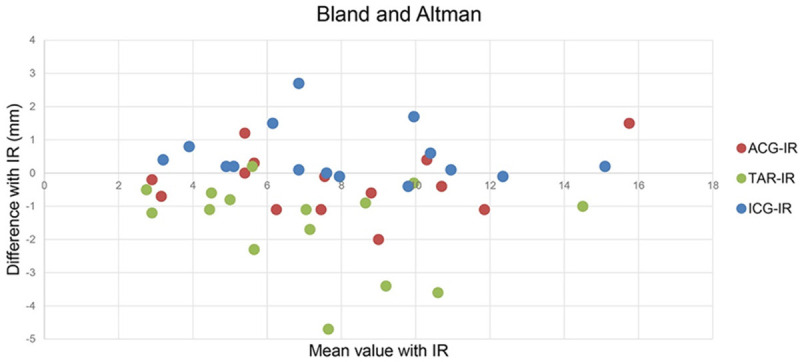
Differences in the values of various approaches (by arthroscopy and by software) relative to the gold standard (by incision) analyzed using the Bland-Altman method. ACG-IR: ACG minus IR; TAR-IR: TAR minus IR; ICG-IR: ICG minus IR. The horizontal axis represents the mean value of IR control with ACG, TAR, or ICG respectively; the perpendicular axis represents the differences of ACG, TAR, ICG respectively with IR control.
Bias of various approaches relative to the gold standard is shown in Table 2. The average bias for the TAR method was 20.01%, whereas those for the ACG and ICG were 9.7% and 10.38%.
Table 2.
Bias of ACG, TAR, ICG relative to IR
| Bias % | ACG | ICG | TAR |
|---|---|---|---|
| Defect1 Line1 | 1.32% | 0.00% | 14.47% |
| Defect1 Line2 | 3.96% | 5.94% | 2.97% |
| Defect1 Line3 | 25.00% | 4.17% | 12.50% |
| Defect1 Line4 | 3.67% | 0.92% | 31.19% |
| Defect1 Line5 | 10.00% | 1.33% | 6.67% |
| Defect2 Line1 | 16.18% | 1.47% | 33.82% |
| Defect2 Line2 | 6.67% | 13.33% | 16.67% |
| Defect2 Line3 | 0.00% | 27.78% | 14.81% |
| Defect2 Line4 | 20.00% | 22.86% | 34.29% |
| Defect2 Line5 | 13.75% | 1.25% | 21.25% |
| Defect3 Line1 | 20.00% | 4.00% | 47.00% |
| Defect3 Line2 | 5.45% | 49.09% | 3.64% |
| Defect3 Line3 | 6.59% | 18.68% | 9.89% |
| Defect3 Line4 | 4.00% | 4.00% | 22.00% |
| Defect3 Line5 | 8.87% | 0.81% | 29.03% |
| Average | 9.70% | 10.38% | 20.01% |
Mapping of grafts for cartilage defects
The grafts were clipped in the ACG method, and the grafts matched properly the defects in three surgeries.
Discussion
This work proposed the ACG method of measuring the size of condylar chondral lesions under an arthroscope by utilizing computer graphics. This method showed excellent intra- and inter-observer reproducibility and satisfactory accuracy.
Some studies have reported techniques of arthroscopic measurement of cartilage defects. Makovicka et al. [6] presented a technique to systematically evaluate the articular cartilage of the knee using BioOptico optical reflection spectroscopy. However, this technique [6] only evaluated the thickness of cartilage defects, not the size. Årøen et al. [2] reported that the knee arthroscopic examination estimated a cartilage full-thickness lesion with an error of <-25% in the majority of the patients. In their study [2], the arthroscopic area was measured after removal of the injured cartilage, and this measurement is very unlikely to be subjected to large measurements errors. In the present study, we presented the ACG method that utilizes computer graphics for measuring the size of condylar chondral lesions of any shapes under an arthroscope, without the need of reconditioning of the injured cartilage. Robert et al. [1] proposed a new method of arthroscopic measurement of cartilage lesions by using the lesion’s arc, but this method could not measure the height of the lesion in millimeters, as only the lesion arc is measured. In the present study, the ACG method can measure distance between any defects in millimeters.
Advantages
Estimation of the extent of a cartilage lesion with an arthroscope is considered the gold standard. However, estimating the size of the defects by the naked eye is difficult owing to the optical distortion of the arthroscopic lens. The most frequently used method was to place a measuring probe or ruler under the arthroscope [3-5], which is more accurate in measuring small defects. However, the measuring probe cannot be placed closely to the defects in some cases, which reduces the accuracy of the measurement and prolongs the surgical time. The ACG method allows accurate measurement of the area and size of the cartilage defects under arthroscopy. Besides, the measurements can be conducted after the surgery.
Disadvantages
The investigator tried to set the camera lens perpendicular to the cartilage defect as much as possible, which is subjective. Hence, the accuracy of ACG is dependent on the angle of the camera lens. However, our results demonstrated that the accuracy of the measurement by trained observers was satisfactory.
Clinical application
Recently, the graft material for cartilage defect repair has become a research focus [10]. However, until now, the graft and cartilage defect cannot be matched precisely. For small and regular defects, clipping the graft using the TAR method can be satisfactory. However, most of the cartilage defects have irregular shapes; less accurate matching of the graft with the defect may not be good for cartilage repair. The ACG method would make it possible to accurately match the graft with the defect (Figure 6), thereby facilitating cartilage repair. Moreover, in this new method, tracking markers can be extracted from the contour of the defect by “Tracemo” in MATLAB. Arthroscopic measurement of the intra-joint length or area (e.g., intercondyloid fossa) can be obtained by this method, which will enhance the knowledge on intra-joint injury conditions and provide suggestions for clinical treatment.
Figure 6.

Mapping of graft for cartilage defects in clinical surgeries by ACG method in clinical surgeries.
This study has some limitations. The angle of the camera lens to the cartilage defects will influence the proportional scale. This method is more fitting for a plane surface than for a curved surface. The curvier the surface, the more errors in the measurement results. Future research on the camera with depth capture applied in the arthroscope may further increase the accuracy of the ACG method.
In conclusion, the ACG method, which utilizes computer graphics for measuring the size of condylar chondral lesions of any shapes under an arthroscope, does not need reconditioning of the injured cartilage. The ACG method showed excellent intra- and inter-observer reproducibility and satisfactory accuracy. This method would make it possible to more accurately match the graft with the defect, thereby facilitating cartilage repair.
Acknowledgements
The authors would like to gratefully acknowledge the financial support of the National Natural Science Foundation of China Grant (31900943, 31900961, 81871770, 81871761, 81330040, 81601927), Fund of Clinical Key Projects of Peking University Third Hospital (BYSY2018005, BYSY2017012) and Beijing Natural Science Foundation (7202232, 7171014), Beijing Municipal Science & Technology Commission (Z171100001017085), China Postdoctoral Science Foundation Grant (2018M631279).
Disclosure of conflict of interest
None.
References
- 1.Robert H, Lambotte JC, Flicoteaux R. Arthroscopic measurement of cartilage lesions of the knee condyle: principles and experimental validation of a new method. Cartilage. 2011;2:237. doi: 10.1177/1947603510388028. [DOI] [PMC free article] [PubMed] [Google Scholar]
- 2.Årøen A, Røtterud JH, Sivertsen EA. Agreement in arthroscopic and arthrotomy assessment of full-thickness articular cartilage lesions of the knee in a clinical setting in 33 consecutive patients. Cartilage. 2013;4:214–218. doi: 10.1177/1947603513483546. [DOI] [PMC free article] [PubMed] [Google Scholar]
- 3.Piontek T, Ciemniewska-Gorzela K, Szulc A, Naczk J, Slomczykowski M. All-arthroscopic AMIC procedure for repair of cartilage defects of the knee. Knee Surg Sports Traumatol Arthrosc. 2012;20:922–925. doi: 10.1007/s00167-011-1657-z. [DOI] [PMC free article] [PubMed] [Google Scholar]
- 4.Benthien JP, Behrens P. Nanofractured autologous matrix induced chondrogenesis (NAMIC©)--Further development of collagen membrane aided chondrogenesis combined with subchondral needling: a technical note. Knee. 2015;22:411–415. doi: 10.1016/j.knee.2015.06.010. [DOI] [PubMed] [Google Scholar]
- 5.Usuelli FG, de Girolamo L, Grassi M, D’Ambrosi R, Montrasio UA, Boga M. All-arthroscopic autologous matrix-induced chondrogenesis for the treatment of osteochondral lesions of the talus. Arthrosc Tech. 2015;4:e255–259. doi: 10.1016/j.eats.2015.02.010. [DOI] [PMC free article] [PubMed] [Google Scholar]
- 6.Makovicka JL, Patel KA, Hassebrock JD, Hartigan DE, Wong M, Chhabra A. Arthroscopic evaluation of knee cartilage using optical reflection spectroscopy. Arthrosc Tech. 2019;8:e399–e405. doi: 10.1016/j.eats.2018.11.019. [DOI] [PMC free article] [PubMed] [Google Scholar]
- 7.Custers RJ, Creemers LB, Verbout AJ, van Rijen MH, Dhert WJ, Saris DB. Reliability, reproducibility and variability of the traditional histologic/histochemical grading system vs the new OARSI osteoarthritis cartilage histopathology assessment system. Osteoarthritis Cartilage. 2007;15:1241–1248. doi: 10.1016/j.joca.2007.04.017. [DOI] [PubMed] [Google Scholar]
- 8.Fleiss JL. The design and analysis of clinical experiments. New York: John Wiley & Sons; 1986. [Google Scholar]
- 9.Bland JM, Altman DG. Statistical methods for assessing agreement between two methods of clinical assessment. Lancet. 1986;1:931–936. [PubMed] [Google Scholar]
- 10.Lien SM, Ko LY, Huang TJ. Effect of pore size on ECM secretion and cell growth in gelatin scaffold for articular cartilage tissue engineering. Acta Biomater. 2009;5:670–679. doi: 10.1016/j.actbio.2008.09.020. [DOI] [PubMed] [Google Scholar]


