Abstract
Objective: To investigate the expression levels of hypoxia-inducible factor-1α (HIF-1α) and C-reactive protein (CRP) in patients with ulcerative colitis and correlations of HIF-1α and CRP levels with disease severity. Methods: A total of 82 patients with confirmed ulcerative colitis were enrolled in this study and according to the disease severity grading, these patients were assigned into three groups: mild group (n=25), moderate group (n=31) and severe group (n=26). And other 30 patients without ulcerative colitis as demonstrated by colonoscopy examination were enrolled in control group in the same period. HIF-1α and CRP levels were detected by ELISA and Real-time PCR and compared among different groups. Pearson’s correlation analysis was performed to evaluate the correlations of HIF-1α and CRP levels with disease severity. Logistic regression analysis was used to explore risk factors of disease severity in patients with ulcerative colitis. Results: The expression levels of HIF-1α and CRP in ulcerative colitis group were significantly higher than those in control group (all P<0.001). The levels of HIF-1α and CRP in patients with ulcerative colitis increased remarkably with the increase of disease severity. Patients in mild group had the lowest levels of HIF-1α and CRP, while patients in severe group had the highest levels of HIF-1α and CRP. Logistic regression analysis showed that the expression of HIF-1α and CRP were the risk factors for disease severity of ulcerative colitis (all P<0.001). And Pearson correlation analysis showed that HIF-1α and CRP levels were significantly associated with Rachmilewitz score and disease activity index (DAI), respectively (all P<0.001). Conclusion: The levels of HIF-1α and CRP were up-regulated in patients with ulcerative colitis and positively correlated with the progression of ulcerative colitis, indicating that the detection of HIF-1α and CRP expression could be used for predicting the disease severity.
Keywords: Ulcerative colitis, hypoxia-inducible factor, C-reactive protein, correlation
Introduction
Ulcerative colitis is a chronic inflammatory disease and it could lead to the continuous mucosal inflammation in a variable extent of colon and rectum [1,2]. It was reported that the annual incidence of ulcerative colitis is approximately between nine and twelve cases per one hundred thousand persons [3]. The etiology and pathogenesis for ulcerative colitis are very complex and the specific causes are still unknown. It always attribute to genetic, environmental, and dietary factors [4]. In clinical practices, endoscopic examination plays an important role in evaluation of disease severity. And It was reported that clinical disease severity was assigned into the degree of mild, moderate and severe [5]. The evaluation of the disease severity of ulcerative colitis would help to guiding clinical therapy and assessing prognosis of patients. So far, the biochemical and inflammatory markers are widely applied for the measurement of inflammation and the indication of diseases severity [6]. And the identification of effective molecular makers that could be help to diagnosis of ulcerative colitis and predict prognosis would be of significant benefit to patients with ulcerative colitis.
CRP, as the most important acute-phase protein, is one of the most commonly application in clinical practice [7]. It was reported that the concentrations of CRP increased dramatically in the period of acute inflammation, while they were quickly reduced in end phase of inflammation process [8,9]. And Solem et al reported that CRP levels were well related with disease activity of Crohn’s disease [10]. In addition, Hypoxia-inducible factor (HIF-1α) is regulated in the form of oxygen dependent-manner and correlated with diseases due to hypoxia. It was reported that hypoxia played an important effect in development of inflammatory bowel disease and affected microenvironment of intestinal mucosa [11,12]. Under low oxygen conditions, HIF-1α could accumulate in cell cytoplasm and then translocates to the nucleus to activate the transcription of target genes such as inflammation factor or cytokines [13]. As we can see, CRP and HIF-1α expression are associated with inflammatory response. However, it is not clear about the relationship between the expression changes of CRP and HIF-1α, and disease severity in patients with ulcerative colitis.
In this study, the levels of HIF-1α and CRP were measured in serum and colonic tissues in patients with ulcerative colitis and their relationship with disease severity were assessed. This study would bring some insights into effective indexes for assessing disease activity and predicting prognosis in patients with ulcerative colitis.
Materials and methods
Subjects
A total of 82 ulcerative colitis patients admitted to our hospital from February 2017 to June 2019 were selected as the research subjects included in this study. The inclusion criteria were as follows: the age was over 18 years old. Patients met the diagnostic criteria of ulcerative colitis, which was in accordance with Inflammatory Bowel Disease diagnosis consensus opinion of China [14]; Patients underwent the examination of colonoscopy; Patients had complete clinical medical records and could follow the protocol of patients. The exclusion criteria were as follows: Patients were accompanied by severe organic diseases such as heart and cerebral disease, and liver and kidney disease. Patients had systemic lupus erythematosus, rheumatic arthritis, mental diseases, Endocrine and metabolic diseases, history of intestinal surgery, long-term drug use of proton pump inhibitor and non-steroidal anti-inflammatory drugs, malignant tumor diseases and other colonitis diseases caused by infection, radioactivity, parasite, and ischemia; and Women with period of lactation or pregnancy. The concurrent patients without ulcerative colitis for physical examination via colonoscopy were selected as control group (n=40). The disease activity of patients with ulcerative colitis was evaluated by disease activity index (DAI), also called Mayo scoring system [15], and Rachmilewitz score [16]. According to the criterion of Truelove and Titts while endoscopic grading consisted with the criterion of Turelove [17], the severity of ulcerative colitis was graded. And according to the disease severity grading, these patients with ulcerative colitis were divided into three groups: mild group (n=25), moderate group (n=31) and severe group (n=26). All enrolled patients and their families signed informed consent forms and this study was approved by the Ethics Committee of Shandong Provincial hospital.
Detection of serum HIF-1α and CRP levels
The serum levels of HIF-1α and CRP in patients was compared among different groups. At 12 h after fasting, 3 mL venous blood was drawn from the elbow vein of each patient in the morning, and kept in an EDTA anticoagulant tube. The plasma was isolated by centrifuging at 3000 r/min for 15 min. and then stored at -20°C. The levels of HIF-1α and CRP were examined by the ELISA method, strictly following the instructions on ELISA kits (R&D Systems, USA).
Detection of HIF-1α and CRP mRNA levels by Real-time PCR
Colonic mucosal tissue specimens in each group were obtained during colonoscopy examination. The obtained specimens were triturated, and then the Trizol reagent (Invitrogen, USA) was applied for extracting total RNA. Total RNA was synthesized into cDNA by the method of reverse transcription polymerase chain reaction. The primer sequences were as follows: GAPDH forward primer 5’-TGCAGCGTACTCCCCACAT-3’ and reverse primer 5’-TCCATGACAACTTTGGTATCGTG-3’; HIF-1α forward 5’-GAATGCTCAGAGGAAGCGAA-3’ and reverse primer 5’-CTCTCATCCATTGACTGCCC-3’; CRP forward primer 5’-TGGCCAGACAGACATGTCGAG-3’ and reverse primer 5’-GGCTTCCCATCTACCCAGAAC-3’. Real-time PCR was conducted following the instructions of PCR kits (Thermo Fisher Scientific, USA). 20 μL of reaction system solutions were as follows: forward and reverse primers of 0.7 μL each SYBR Premix Ex TaqTM II (2*) 10 μL, ROX Reference Dye (50*) 0.6 μL, and dH2O 6.0 μL. PCR amplification was performed using Applied Biosystems 7500 PCR System (ThermoFisher Scientific, USA). The reaction conditions of Real-time PCR were following denaturation at 95°C for 30 sec, denaturation at 95°C for 20 sec, renaturation at 58°C for 30 sec, extension at 72°C for 1 min, with 40 cycles. The relative mRNA levels of HIF-1α and CRP in each group were calculated using the 2-ΔΔCt method. The expression level of GAPDH was selected as the internal reference.
Detection of HIF-1α and CRP protein levels by Western blot assay
The tissues were lysed using RIPA buffer (Sigma, USA) and the total proteins were collected. Then, BCA protein assay (Cell Signaling Technology, USA) was applied to examine the concentrations of proteins. Next, the total proteins were separated by SDS-PAGE gels electrophoresis (ThermoFisher Scientific, USA) and transferred into PVDF membrane (Millipore, USA). Then, the membranes were blocked by TBS-T solutions containing 5% non-fat milk powder at the room temperature for 2 h. The rabbit-anti-human HIF-1α (1:300 dilution; Abcam, USA) and CRP primary antibody (1:500 dilution; Abcam, USA) were incubated with the membranes at 4°C in shaker for overnight. The secondary antibody (1:1000 dilution; Santa Cruz, USA) was added and incubated with membranes at room temperature for 30 min. After washing with TBS-T solutions for three times, the membranes were developed by ECL chemiluminescence reagent (ThermoFisher Scientific, USA) and scanned by Gel imaging system. The GAPDH protein was selected as internal reference.
Statistical analysis
Data analysis was performed using SPSS software, version 22.0. The quantitative data were expressed as mean ± standard deviation (Mean ± SD). The student’s t test was used for comparison between two groups, while one-way analysis of variance (ANOVA) was used for comparisons among more than two groups. The correlations analysis was performed by Pearson correlation analysis. The count data were presented as percentages or cases, and the chi-square test was applied for comparison between two groups. The risk factors for disease severity in patients with ulcerative colitis were analyzed by the logistic regression method. P<0.05 indicated statistically significant differences.
Results
Basic information of patients
The basic information of patients with ulcerative colitis was listed in Table 1. Among 82 patients with ulcerative colitis included in this study, there were 15 patients with mild disease activity, 36 patients with moderate disease activity and 31 patients with severe disease activity. The average Rachmilewitz score was 4.52±0.71 and the mean disease activity index (DAI) was 6.71±1.12. And the mean age was 46.30±2.51 years. There was no significant differences regarding age, gender, BMI, and underlying disease between ulcerative colitis group and control group (P>0.05).
Table 1.
The basic information of patients with ulcerative colitis
| Indexes | Values | |
|---|---|---|
| Age (years) | 46.30±2.51 | |
| Gender (male/female) | 33/49 | |
| BMI (kg/m2) | 21.23±0.51 | |
| Course of disease (months) | 24.80±4.61 | |
| Hypertension (n) | 6 | |
| Diabetes (n) | 8 | |
| Hyperlipidemia (n) | 5 | |
| Location of disease (n) | Proctitis | 43 |
| Left colonic | 11 | |
| Extensive colitis | 28 | |
| Severity of disease (n) | Mild | 25 |
| Moderate | 31 | |
| Severe | 26 | |
| DAI | 6.71±1.12 | |
| Rachmilewitz score | 4.52±0.71 |
Note: DAI: Disease activity index; BMI: Body Mass Index.
Comparison of serum HIF-1α and CRP levels between ulcerative colitis group and control group
As shown in Table 2, the serum HIF-1α level in control group was 24.32±6.70 ng/L, while it was 75.83±8.20 ng/L in ulcerative colitis group. The serum HIF-1α level in ulcerative colitis group was significantly higher than that in control group and there were statistical differences between two groups (P<0.001). Moreover, the serum CRP level in ulcerative colitis group was 28.70±8.41 mg/mL, which was obviously higher than that in control group (2.81±0.72 mg/mL). And there were significant differences between two groups (P<0.001).
Table 2.
Comparison of serum levels of HIF-1α and CRP between ulcerative colitis group and control group
| Groups | Cases (n) | HIF-1α (ng/L) | CRP (mg/mL) |
|---|---|---|---|
| Control group | 40 | 24.32±6.70 | 2.81±0.72 |
| Ulcerative colitis group | 82 | 75.83±8.20 | 28.70±8.41 |
| T value | 34.480 | 19.430 | |
| P value | <0.001 | <0.001 |
Note: HIF-1α: Hypoxia-inducible factor; CRP: C-reactive protein.
Comparison of HIF-1α and CRP mRNA levels in colon tissues between ulcerative colitis group and control group
As shown in Figure 1, the HIF-1α mRNA level of colon tissues in control group was 0.23±0.06, while it was 1.21±0.24 in ulcerative colitis group. The HIF-1α mRNA level of colon tissues in ulcerative colitis group was remarkably higher than that in control group and there were significant differences between two groups (P<0.001). In addition, the CRP mRNA level of colon tissues in ulcerative colitis group was 0.88±0.30, which was obviously higher than that in control group (0.27±0.05). And the significant differences were found between two groups (P<0.001).
Figure 1.
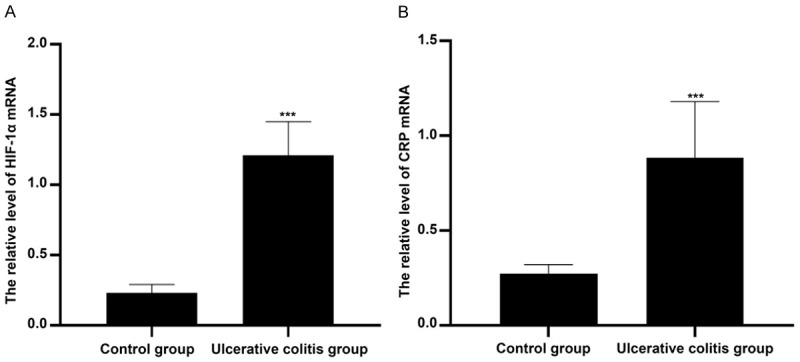
Comparison of HIF-1α and CRP mRNA levels in colon tissues between two groups. Compared with control group, ***P<0.001. Note: HIF-1α: Hypoxia-inducible factor; CRP: C-reactive protein.
Comparison of HIF-1α and CRP protein levels in colon tissues between ulcerative colitis group and control group
As shown in Figure 2, the HIF-1α protein level of colon tissues in ulcerative colitis group was 1.43±0.21, which was significantly higher than that in control group (0.31±0.08). And the significant differences were found between two groups (P<0.001).
Figure 2.
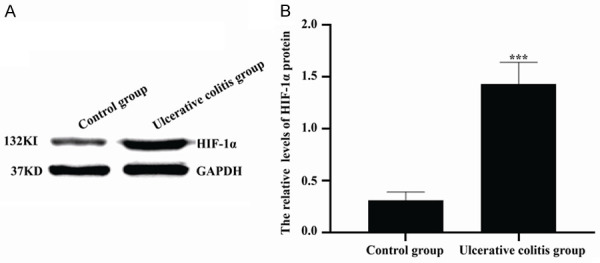
Comparison of HIF-1α protein levels in colon tissues between two groups. (A) Western blot was used to detect HIF-1α protein levels. (B) The quantitative analysis of data shown in (A). ***P<0.001 versus control group.
As seen in Figure 3, the CRP protein levels of colon tissues in control group and ulcerative colitis group were 0.35±0.06 and 1.12±0.25, respectively. The CRP protein level of colon tissues in ulcerative colitis group was significantly higher than that in control group and there was statistical difference between two groups (P<0.001).
Figure 3.
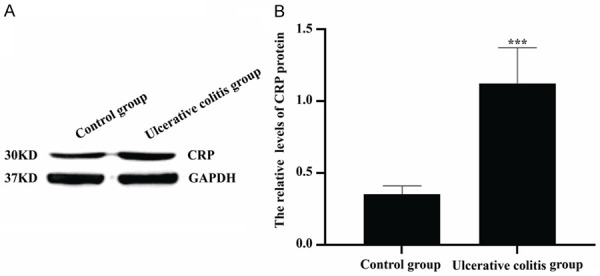
Comparison of CRP protein levels in colon tissues between two groups. (A) Western blot was applied to examine CRP protein levels. (B) The quantitative analysis of data shown in (A). ***P<0.001 versus control group.
Comparison of serum levels of HIF-1α and CRP among patients with different disease severity grading
As seen in Table 3, the serum levels of HIF-1α in mild group, moderate group and severe group were 67.51±6.40 ng/L, 74.93±6.82 ng/L and 84.81±7.13 ng/L, respectively. And the serum levels of CRP in mild group, moderate group and severe group were 24.90±3.11 mg/mL, 27.53±3.62 mg/mL and 33.81±4.32 mg/mL, respectively. Compared with mild group, the serum levels of HIF-1α and CRP in moderate group and severe group were significantly higher, and there were statistical differences (all P<0.001). The serum levels of HIF-1α and CRP in severe group were remarkably higher than those in moderate group (P<0.001).
Table 3.
Comparison of serum levels of HIF-1α and CRP among mild group, moderate group and severe group
| Parameters | Cases (n) | HIF-1α (ng/L) | CRP (mg/mL) |
|---|---|---|---|
| Mild group | 25 | 67.51±6.40 | 24.90±3.11 |
| Moderate group | 31 | 74.93±6.82 | 27.53±3.62 |
| Severe group | 26 | 84.81±7.13 | 33.81±4.32 |
| F value | 41.920 | 39.510 | |
| P value | <0.001 | <0.001 |
Note: HIF-1α: Hypoxia-inducible factor; CRP: C-reactive protein.
Comparison of HIF-1α and CRP mRNA levels in colon tissues among patients with different disease severity grading
As shown in Figure 4, the HIF-1α mRNA levels of colon tissues in mild group, moderate group and severe group were 0.83±0.06, 1.10±0.08 and 1.71±0.10, respectively. And the CRP mRNA levels of colon tissues in mild group, moderate group and severe group were 0.45±0.05, 0.81±0.07 and 1.53±0.12, respectively. HIF-1α and CRP mRNA levels in severe group were obviously higher than those in mild group and moderate group (all P<0.001). And HIF-1α and CRP mRNA levels in mild group were remarkably lower than those in moderate group. The significant differences could be found between two groups (P<0.001).
Figure 4.
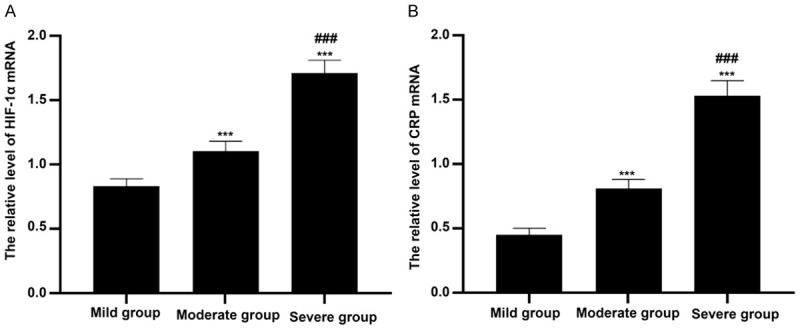
Comparison of HIF-1α and CRP mRNA levels in colon tissues among patients with different disease severity grading. A: HIF-1α mRNA levels in colon tissues were detected by Real-time PCR and compared among mild group, moderate group and severe group. ***P<0.001 versus mild group, ###P<0.001 versus moderate group. B: CRP mRNA levels in colon tissues were examined by Real-time PCR and compared among mild group, moderate group and severe group. ***P<0.001 versus mild group, ###P<0.001 versus moderate group.
Comparison of HIF-1α and CRP protein levels in colon tissues among patients with different disease severity grading
As seen in Figures 5 and 6, the HIF-1α protein levels of colon tissues in mild group, moderate group and severe group were 0.95±0.05, 1.24±0.07 and 1.68±0.09, respectively, while the CRP protein levels of colon tissues in mild group, moderate group and severe group were 0.57±0.05, 0.95±0.08 and 1.63±0.10, respectively. There were significantly statistical differences among patients with different disease severity grading (all P<0.001). And there were the highest levels of HIF-1α and CRP in severe group, while there were lowest levels of HIF-1α and CRP in mild group.
Figure 5.
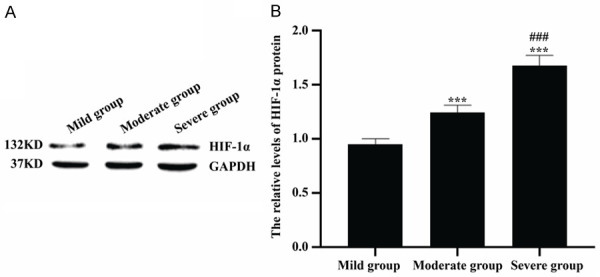
Comparison of HIF-1α protein levels in colon tissues among patients with different disease severity grading. A: Western blot was used to detect HIF-1α protein levels. B: The quantitative analysis of HIF-1α protein levels in mild group, moderate group and severe group. ***P<0.001 versus mild group, ###P<0.001 versus moderate group.
Figure 6.
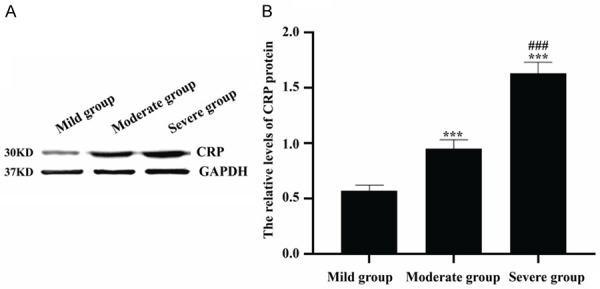
Comparison of CRP protein levels in colon tissues among patients with different disease severity grading. A: Western blot was used to detect CRP protein levels. B: The quantitative analysis of CRP protein levels in mild group, moderate group and severe group. ***P<0.001 versus mild group, ###P<0.001 versus moderate group.
Logistic regression analysis
The results of logistic regression analysis for disease severity grading showed that the values of OR for HIF-1α and CRP were 1.684 (95% CI: 1.295-2.413) and 1.617 (95% CI: 1.267-2.298), respectively. Both HIF-1α and CRP levels were the independent risk factors for patients with ulcerative colitis and there were significantly statistical differences (all P<0.001), as shown in Table 4.
Table 4.
Logistic regression analysis for disease severity grading in patients with ulcerative colitis
| Factors | β | SE | Wald | P | OR | 95% CI |
|---|---|---|---|---|---|---|
| HIF-1α | 1.059 | 3.174 | 1.295 | 0.003 | 1.684 | 1.295-2.413 |
| CRP | 1.022 | 2.418 | 1.263 | 0.001 | 1.617 | 1.267-2.298 |
Note: HIF-1α: Hypoxia-inducible factor; CRP: C-reactive protein; SE: Standard error; OR: odds ration; CI: Confidence interval.
Correlation between HIF-1α levels and Rachmilewitz score/DAI
As shown in Figure 7, the correlation coefficient between HIF-1α levels and Rachmilewitz score was 0738, and the statistical differences were found (P<0.001). Moreover, the statistically significant correlation was found between HIF-1α levels and DAI (r=0.710, P<0.001).
Figure 7.
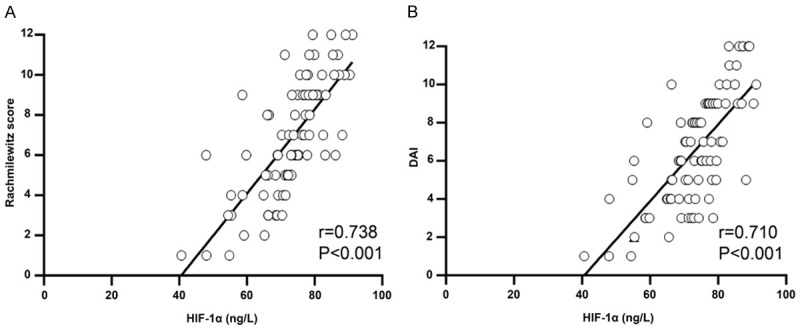
The correlation analysis between HIF-1α and activity indexes. A: HIF-1α levels were positively associated with Rachmilewitz score. B: HIF-1α levels were positively associated with DAI.
Correlation between CRP levels and Rachmilewitz score/DAI
As shown in Figure 8, the correlation coefficient between CRP levels and Rachmilewitz score was 0747, while the correlation coefficient between CRP levels and DAI was 0.752. There was statistically significant relationship of CRP levels with Rachmilewitz score and DAI (all P<0.001).
Figure 8.
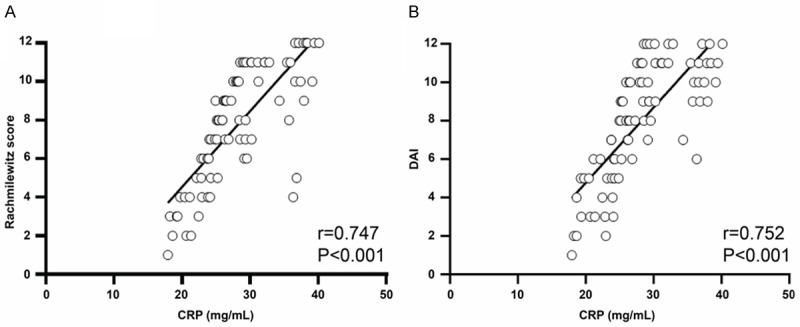
The correlation analysis between CRP and activity indexes. A: CRP levels were positively associated with Rachmilewitz score. B: CRP levels were positively associated with DAI.
Discussion
Ulcerative colitis is an immune-mediated gastrointestinal disorder, which seriously threatens the life quality and physical and psychological health of patients, and also exerts a remarkably financial burden on the health care system. The main underlying pathology of ulcerative colitis is disruption to the protective epithelial barrier, which isolates the intestinal lumen above from the mucosal immune system below [18]. The injury of epithelial barrier could lead to serious and long-term damage to the gut in repetitive cycles. It was reported that the inflammation occurred in intestinal mucosa was a primary standard for diagnosis and for distinguish from other disease [11]. Moreover, Clarke et al reported that the levels of inflammation were very important for evaluation of disease severity and for making treatment plan [19]. Disease activity indices proposed by various scholar were applied for quantify disease severity in patients with ulcerative colitis. Among them, endoscopic examination of disease severity is a crucial assessment and Rachmilewitz score has been considered an endoscopic indicator in term of vascular pattern, granularity, mucosal damage and vulnerability [20]. To make full use of Rachmilewitz score, DAI score from Mayo clinic was developed in detail. It was reported that Mayo score is the most used in clinical practice [21]. In this study, Rachmilewitz score and DAI were used to evaluate disease severity in patients with ulcerative colitis.
To monitor the inflammation of intestinal mucosa, CRP was selected as one of inflammatory indicators in this study. CRP produced in response to disease stimulation is a pentameric protein. Previous studies showed that there were conflicting results for relationship between CRP concentration and disease activity in patients with Crohn’s disease [22]. Solem et al also reported that the elevation of CRP was obviously correlation with severe clinical activity in inflammatory bowel disease [10]. The present study showed that the level of CRP was significantly up-regulated in serum and intestinal mucosa in patients with ulcerative colitis and positively associated with disease severity, which was accordance with results reported by Henriksen et al [23]. Osada et al reported that the disease activity of proximal colonic lesions was well associated with CRP and erythrocyte sedimentation rate [24]. The above results indicate that CRP could reflect endoscopic inflammation and predict the disease severity of ulcerative colitis.
The role of hypoxia in pathophysiology of intestine is gaining more attention. Some studies revealed that there were different degrees of hypoxia in patients with inflammatory bowel disease and in intestinal mucosa of animal models [25]. Under anoxic conditions, some hypoxia-inducible factors such as HIF-1α could be regulated and subsequently control different physiological and pathological response via different mechanisms. It was reported that HIF-1α not only involved in many types of cancer and ischemia disease, but also in maintenance and recovery of functions of intestinal barrier [26,27]. Xu et al [28] reported that the target genes of HIF-1α such as COX-2 and iNOS were significantly up-regulated in intestinal mucosa of patients with ulcerative colitis, while poorly expressed in normal intestinal mucosa. The results of this study revealed that in patients with ulcerative colitis, the level of HIF-1α in serum and colonic mucosa were presented obviously higher than those in control group and closely associated with Rachmilewitz score and DAI in ulcerative colitis. It was similar with results reported by Xu et al [29]. Other studies demonstrated that HIF-1α participated in inflammatory reaction and was identified in many inflammation-mediated diseases such as chronic bronchitis, and rheumatoid arthritis and so on [30,31]. As we can see, HIF-1α may serve as a good mark to evaluate the disease severity of ulcerative colitis.
In conclusion, the presented study indicated that the levels of HIF-1α and CRP are associated with ulcerative colitis. However, the specific molecular mechanism of HIF-1α and CRP in the pathogenesis of ulcerative colitis remains unclear, requiring further experimental confirmation.
Disclosure of conflict of interest
None.
References
- 1.Eisenstein M. Ulcerative colitis: towards remission. Nature. 2018;563:S33. doi: 10.1038/d41586-018-07276-2. [DOI] [PubMed] [Google Scholar]
- 2.Ungaro R, Mehandru S, Allen PB, Peyrin-Biroulet L, Colombel JF. Ulcerative colitis. Lancet. 2017;389:1756–1770. doi: 10.1016/S0140-6736(16)32126-2. [DOI] [PMC free article] [PubMed] [Google Scholar]
- 3.Talley NJ, Abreu MT, Achkar JP, Bernstein CN, Dubinsky MC, Hanauer SB, Kane SV, Sandborn WJ, Ullman TA, Moayyedi P American College of Gastroenterology IBD Task Force. An evidence-based systematic review on medical therapies for inflammatory bowel disease. Am J Gastroenterol. 2011;106(Suppl 1):S2–25. doi: 10.1038/ajg.2011.58. [DOI] [PubMed] [Google Scholar]
- 4.Gajendran M, Loganathan P, Jimenez G, Catinella AP, Ng N, Umapathy C, Ziade N, Hashash JG. A comprehensive review and update on ulcerative colitis. Dis Mon. 2019;65:100851. doi: 10.1016/j.disamonth.2019.02.004. [DOI] [PubMed] [Google Scholar]
- 5.Magro F, Gionchetti P, Eliakim R, Ardizzone S, Armuzzi A, Barreiro-de Acosta M, Burisch J, Gecse KB, Hart AL, Hindryckx P, Langner C, Limdi JK, Pellino G, Zagórowicz E, Raine T, Harbord M, Rieder F European Crohn’s and Colitis Organisation [ECCO] Third european evidence-based consensus on diagnosis and management of ulcerative colitis. Part 1: definitions, diagnosis, extra-intestinal manifestations, pregnancy, cancer surveillance, surgery, and ileo-anal pouch disorders. J Crohns Colitis. 2017;11:649–670. doi: 10.1093/ecco-jcc/jjx008. [DOI] [PubMed] [Google Scholar]
- 6.Ziade F, Rungoe C, Kallemose T, Paerregaard A, Wewer AV, Jakobsen C. Biochemical markers, genotype, and inflammation in pediatric inflammatory bowel disease: a danish population-based study. Dig Dis. 2019;37:140–146. doi: 10.1159/000494215. [DOI] [PubMed] [Google Scholar]
- 7.Moutachakkir M, Lamrani Hanchi A, Baraou A, Boukhira A, Chellak S. Immunoanalytical characteristics of C-reactive protein and high sensitivity C-reactive protein. Ann Biol Clin (Paris) 2017;75:225–229. doi: 10.1684/abc.2017.1232. [DOI] [PubMed] [Google Scholar]
- 8.Chen P, Li Y, Li L, Yu Q, Chao K, Zhou G, Qiu Y, Feng R, Huang S, He Y, Chen B, Chen M, Zeng Z, Zhang S. Circulating microRNA146b-5p is superior to C-reactive protein as a novel biomarker for monitoring inflammatory bowel disease. Aliment Pharmacol Ther. 2019;49:733–743. doi: 10.1111/apt.15159. [DOI] [PubMed] [Google Scholar]
- 9.Vermeire S, Van Assche G, Rutgeerts P. C-reactive protein as a marker for inflammatory bowel disease. Inflamm Bowel Dis. 2004;10:661–665. doi: 10.1097/00054725-200409000-00026. [DOI] [PubMed] [Google Scholar]
- 10.Solem CA, Loftus EV Jr, Tremaine WJ, Harmsen WS, Zinsmeister AR, Sandborn WJ. Correlation of C-reactive protein with clinical, endoscopic, histologic, and radiographic activity in inflammatory bowel disease. Inflamm Bowel Dis. 2005;11:707–712. doi: 10.1097/01.mib.0000173271.18319.53. [DOI] [PubMed] [Google Scholar]
- 11.Cummins EP, Crean D. Hypoxia and inflammatory bowel disease. Microbes Infect. 2017;19:210–221. doi: 10.1016/j.micinf.2016.09.004. [DOI] [PubMed] [Google Scholar]
- 12.Neudecker V, Colgan SP, Eltzschig HK. Novel therapeutic concepts for inflammatory bowel disease-from bench to bedside. J Mol Med (Berl) 2017;95:899–903. doi: 10.1007/s00109-017-1574-9. [DOI] [PMC free article] [PubMed] [Google Scholar]
- 13.Yeung YT, Aziz F, Guerrero-Castilla A, Arguelles S. Signaling pathways in inflammation and anti-inflammatory therapies. Curr Pharm Des. 2018;24:1449–1484. doi: 10.2174/1381612824666180327165604. [DOI] [PubMed] [Google Scholar]
- 14.Chinese Cooperative Group for The Study on IBD; Chinese Society of Gastroenterology. Ouyang Q, Hu PJ, Qian JM, Zheng JJ, Hu RW. Consensus on the management of inflammatory bowel disease in China in 2007. J Dig Dis. 2008;9:52–62. doi: 10.1111/j.1443-9573.2007.00320.x. [DOI] [PubMed] [Google Scholar]
- 15.Lan D, Niu J, Miao J, Dong X, Wang H, Yang G, Wang K, Miao Y. Expression of guanylate cyclase-C, guanylin, and uroguanylin is downregulated proportionally to the ulcerative colitis disease activity index. Sci Rep. 2016;6:25034. doi: 10.1038/srep25034. [DOI] [PMC free article] [PubMed] [Google Scholar]
- 16.Bamba S, Takahashi K, Imaeda H, Nishida A, Kawahara M, Inatomi O, Sugimoto M, Sasaki M, Andoh A. Effect of fermented vegetable beverage containing Pediococcus pentosaceus in patients with mild to moderate ulcerative colitis. Biomed Rep. 2018;9:74–80. doi: 10.3892/br.2018.1099. [DOI] [PMC free article] [PubMed] [Google Scholar]
- 17.Jamali R, Biglari M, Seyyed Hosseini SV, Shakouri Rad A, Kosari F. The correlation between liver fat content and ulcerative colitis disease severity. Acta Med Iran. 2017;55:333–339. [PubMed] [Google Scholar]
- 18.Sinagra E, Orlando A, Mocciaro F, Criscuoli V, Oliva L, Maisano S, Giunta M, La Seta F, Solina G, Rizzo AG, Leone A, Tomasello G, Cappello F, Cottone M. Clinical course of severe colitis: a comparison between crohns disease and ulcerative colitis. J Biol Regul Homeost Agents. 2018;32:415–423. [PubMed] [Google Scholar]
- 19.Clarke K, Chintanaboina J. Allergic and immunologic perspectives of inflammatory bowel disease. Clin Rev Allergy Immunol. 2019;57:179–193. doi: 10.1007/s12016-018-8690-3. [DOI] [PubMed] [Google Scholar]
- 20.Mohammed Vashist N, Samaan M, Mosli MH, Parker CE, MacDonald JK, Nelson SA, Zou GY, Feagan BG, Khanna R, Jairath V. Endoscopic scoring indices for evaluation of disease activity in ulcerative colitis. Cochrane Database Syst Rev. 2018;1:CD011450. doi: 10.1002/14651858.CD011450.pub2. [DOI] [PMC free article] [PubMed] [Google Scholar]
- 21.Xie T, Zhang T, Ding C, Dai X, Li Y, Guo Z, Wei Y, Gong J, Zhu W, Li J. Ulcerative Colitis Endoscopic Index of Severity (UCEIS) versus Mayo Endoscopic Score (MES) in guiding the need for colectomy in patients with acute severe colitis. Gastroenterol Rep (Oxf) 2018;6:38–44. doi: 10.1093/gastro/gox016. [DOI] [PMC free article] [PubMed] [Google Scholar]
- 22.Karoui S, Ouerdiane S, Serghini M, Jomni T, Kallel L, Fekih M, Boubaker J, Filali A. Correlation between levels of C-reactive protein and clinical activity in Crohn’s disease. Dig Liver Dis. 2007;39:1006–1010. doi: 10.1016/j.dld.2007.06.015. [DOI] [PubMed] [Google Scholar]
- 23.Karoui S, Laz S, Serghini M, Bibani N, Boubaker J, Filali A. Correlation of C-reactive protein with clinical and endoscopic activity in patients with ulcerative colitis. Dig Dis Sci. 2011;56:1801–1805. doi: 10.1007/s10620-010-1496-7. [DOI] [PubMed] [Google Scholar]
- 24.Osada T, Ohkusa T, Okayasu I, Yoshida T, Hirai S, Beppu K, Shibuya T, Sakamoto N, Kobayashi O, Nagahara A, Terai T, Watanabe S. Correlations among total colonoscopic findings, clinical symptoms, and laboratory markers in ulcerative colitis. J Gastroenterol Hepatol. 2008;23(Suppl 2):S262–7. doi: 10.1111/j.1440-1746.2008.05413.x. [DOI] [PubMed] [Google Scholar]
- 25.Lehmann Ch, Abdo I, Kern H, Maddison L, Pavlovic D, Sharawi N, Starkopf J, Hall R, Johnson P, Williams L, Cerny V MiDAS (Microcirculation Diagnostics and Applied Studies) group. Clinical evaluation of the intestinal microcirculation using sidestream dark field imaging--recommendations of a round table meeting. Clin Hemorheol Microcirc. 2014;57:137–146. doi: 10.3233/CH-141810. [DOI] [PubMed] [Google Scholar]
- 26.Balamurugan K. HIF-1 at the crossroads of hypoxia, inflammation, and cancer. Int J Cancer. 2016;138:1058–1066. doi: 10.1002/ijc.29519. [DOI] [PMC free article] [PubMed] [Google Scholar]
- 27.Shao T, Zhao C, Li F, Gu Z, Liu L, Zhang L, Wang Y, He L, Liu Y, Liu Q, Chen Y, Donde H, Wang R, Jala VR, Barve S, Chen SY, Zhang X, Chen Y, McClain CJ, Feng W. Intestinal HIF-1alpha deletion exacerbates alcoholic liver disease by inducing intestinal dysbiosis and barrier dysfunction. J Hepatol. 2018;69:886–895. doi: 10.1016/j.jhep.2018.05.021. [DOI] [PMC free article] [PubMed] [Google Scholar]
- 28.Vermeulen N, Vermeire S, Arijs I, Michiels G, Ballet V, Derua R, Waelkens E, Van Lommel L, Schuit F, Rutgeerts P, Bossuyt X. Seroreactivity against glycolytic enzymes in inflammatory bowel disease. Inflamm Bowel Dis. 2011;17:557–564. doi: 10.1002/ibd.21388. [DOI] [PubMed] [Google Scholar]
- 29.Xu C, Dong W. Role of hypoxia-inducible factor-1alpha in pathogenesis and disease evaluation of ulcerative colitis. Exp Ther Med. 2016;11:1330–1334. doi: 10.3892/etm.2016.3030. [DOI] [PMC free article] [PubMed] [Google Scholar]
- 30.Hu F, Liu H, Xu L, Li Y, Liu X, Shi L, Su Y, Qiu X, Zhang X, Yang Y, Zhang J, Li Z. Hypoxia-inducible factor-1alpha perpetuates synovial fibroblast interactions with T cells and B cells in rheumatoid arthritis. Eur J Immunol. 2016;46:742–751. doi: 10.1002/eji.201545784. [DOI] [PubMed] [Google Scholar]
- 31.Lee SH, Lee SH, Kim CH, Yang KS, Lee EJ, Min KH, Hur GY, Lee SH, Lee SY, Kim JH, Shin C, Shim JJ, In KH, Kang KH, Lee SY. Increased expression of vascular endothelial growth factor and hypoxia inducible factor-1alpha in lung tissue of patients with chronic bronchitis. Clin Biochem. 2014;47:552–559. doi: 10.1016/j.clinbiochem.2014.01.012. [DOI] [PubMed] [Google Scholar]


