

Abstract
In situ inventory of sulfurous products from the sulfur K-edge synchrotron X-radiolysis of l-cysteine in solid-phase and anaerobic (pH 5) and air-saturated (pH 5, 7, and 9) solutions without and with 40% glycerol is reported. Sequential K-edge X-ray Absorption Spectroscopic (XAS) spectra were acquired. l-cysteine degraded systematically in the X-ray beam. Radiolytic products were inventoried by fits using the XAS spectra of sulfur model compounds. Solid l-cysteine declined to 92% fraction after a single K-edge XAS scan. After six scans, 60% remained, accompanied by 14% cystine, 16% thioether, 5.4% elemental sulfur, and smaller fractions of more highly oxidized products. In air-saturated pH 5 solution, 73% of l-cysteine remained after ten scans, with 2% cystine and 19% elemental sulfur. Oxidation increased with 40% glycerol, yielding 67%, 5%, and 23% fractions, respectively, after ten scans. Higher pH solutions exhibited less radiolytic chemistry. All the reactivity followed first-order kinetics. The anaerobic experiment displayed two reaction phases, with sharp changes in kinetics and radiolytic chemistry. Unexpectedly, the radiolytic oxidation of l-cysteine was increased in anaerobic solution. After ten scans, only 60% of the l-cysteine remained, along with 17% cystine, 22% elemental sulfur, and traces of more highly oxidized products. A new aerobic reaction cycle is hypothesized, wherein dissolved dioxygen captures radiolytic H• or , enters HO2•/O2•−, reductively quenches cysteine thiyl radicals, and cycles back to O2. This cycle is suggested to suppress the radiolytic production of cystine in aerobic solution.
I. INTRODUCTION
γ-, α-, and X-radiolysis of water, amino acids, or biological materials has been studied since the discovery of radioactivity by Becquerel and the Curies.1,2 Apart from purely scientific interest, the medical effects of radiation and the later threat of atomic weapons brought more pragmatic, indeed more urgent, attention to the effects of radiation on biological materials.3–5 Much early research in radiolysis was inspired by the need for a reliable dosimeter.6–9
Following the discovery of water radiolysis, attention quickly focused on the effects of ionizing radiation on proteins and amino acids, with cysteine and other sulfur-containing biomolecules receiving very early attention.10–15 Identified products from radiolyzed acidic (pH 1.55) aqueous l-cysteine have included H2S, elemental sulfur (S8), sulfate ion (SO42−), ammonia (NH3), alanine (CH3CH2(NH3+)COO−), and CO2.16 Later radiolytic studies found similar products from l-cysteine in both strongly acidic and pH 5 solutions, with the exception that no elemental sulfur was detected.17–20 Solid cysteine has received less attention, but radiolysis has likewise produced H2, H2S, NH3, and cystine.21–23
Like γ-radiolysis, X-radiolysis of water initially produces tracks (including spurs), wherein energy deposition (Compton scattering) decomposes H2O into HO• and H• radicals, as well as and H+.11,24–28 Exposure to X-radiolytic radical flux during synchrotron X-ray absorption spectroscopic (XAS) experiments leads to the degradation of proteins and the reduction of metalloproteins.29–31 However, this same effect has been positively exploited in the synchrotron X-radiation foot-printing of proteins and DNA.32–36 Recent synchrotron experiments have demonstrated the direct production of thiyl radicals in the synchrotron X-irradiation of thiols during acquisition of XAS spectra.37
In experiments to derive the solution structure of dissolved cysteine, a scan-by-scan sequential loss of absorption intensity from the sulfur K-edge XAS spectrum was noted.38 A typical solution to the problem of synchrotron X-ray-induced decay is to employ only the first XAS spectral scan in an analysis. However, the problem of radiolysis-induced chemistry in a synchrotron XAS experiment is general. We have therefore investigated the radiolytic behavior of l-cysteine under sulfur K-edge XAS measurements. Multiple sequential sulfur K-edge XAS spectra were acquired. Conditions included solid l-cysteine, air-saturated pH 5, 7, and 9 solutions both without and with added 40% glycerol, and anaerobic pH 5 solution. Glycerol was included because it is a common cryo-protectant and a glassing agent used for protein XAS measurements.
The sulfur-containing products of synchrotron sulfur K-edge X-radiolysis were assessed by fitting the experimental XAS spectra using a library of sulfur K-edge XAS spectra. We report here the first in situ inventory of products from the synchrotron X-radiolysis of l-cysteine. We also report the unexpected finding that dissolved oxygen suppresses the radiolytic oxidation of l-cysteine.
II. MATERIALS AND METHODS
l-cysteine was purchased from Aldrich Chemical Company (Lot 063215DJ, 97% by specification) and stored prior to use under nitrogen in a Vacuum Atmosphere (VAC) glove box (≤1 ppm O2) at Stanford University. The reported Lot purity was 102.1% by thiosulfate iodometry indicating possible sulfurous impurities of lower molecular weight than cysteine, e.g., cysteamine.39,40 These were not investigated but, as thiols, will have contributed to the sulfur XAS intensity and have a radiolytic reactivity similar to cysteine.15,41 The 2.1% impurity thiols were assumed to contribute to the total XAS intensity as cysteine. All experimental solutions were prepared using doubly deionized 18 MΩ ultrapure water (Milli-Q).
Solutions of l-cysteine were prepared immediately before measurements at the Stanford Synchrotron Radiation Lightsource (SSRL), either at the beamline or within a Vacuum Atmosphere (VAC) nitrogen-filled glove box (≤1 ppm O2) for the anaerobic experiment.
An Orion 2-Star pH meter was two-point calibrated immediately before use. Anaerobic buffers were purged by three freeze-pump-thaw cycles on an argon-gas Schlenk line. The pH values of the anaerobic buffers were verified within the VAC glove box using ColorpHast pH papers (EMD Millipore), accurate to 0.5 pH unit. The accuracy of the ColorpHast papers was verified using buffers of known pH.
Experimental solutions were 50 mM in l-cysteine and buffered using 250 mM sodium citrate at pH 5 or 7. Solutions at pH 9 were buffered using 150 mM carbonate/bicarbonate with added 100 mM sodium citrate. Solutions containing 40% glycerol were diluted directly v/v so that the concentration of l-cysteine was 30 mM, with the buffer concentrations similarly reduced. The l-cysteine solution species distribution with pH was calculated using the Medusa Program,42 and the known pKa values.43,44
Sulfur K-edge XAS spectra were measured on beamline 4-3 at SSRL under ring conditions of 3 GeV and 200-400 mA beam current, using a Si(111) monochromator fully tuned at 3133 eV. The samples were placed 45° with respect to the beam, and fluorescence excitation spectra were measured at 90° using a Plasma Implanted Planar Silicon (PIPS) detector (Canberra Industries). Solution samples were held within Teflon spacer cells of window-size 2 cm × 0.6 cm, with a 2 mm path length, and faced with 5 µm polypropylene windows. The X-ray beam spot was 2 × 8 mm (pH 5 samples) or 2 × 10 mm (pH 7, 9 samples). At 2472 eV, the K-edge energy of elemental sulfur, the 1/e X-ray intensity attenuation length of water alone is 20.7 µm but is 2.00 mm for the 50 mM l-cysteine of average solution sulfur density 1.60 × 10⁻³ gm/cc. Thus, none of the sulfur solution XAS spectra should have suffered distortion from self-absorption.
Solid l-cysteine was finely ground with BN in a mineral oil mull and painted as a thin film onto the surface of Kapton tape. The X-ray beam spot was 2 × 6 mm. The XAS spectra of the reference compounds used in fitting the experimental XAS spectra (see below) were reported earlier.45,46 The sulfur K-edge XAS spectra of hydrogen sulfide in pH 4 and pH 9 solutions were kindly provided by Prof. Graham George, University of Saskatchewan.
l-cysteine XAS spectra were calibrated against the maximum of the first K-edge feature of sodium thiosulfate hexahydrate, assigned to 2472.02 eV. Thiosulfate calibration scans were typically measured initially and then after every five sample scans. Raw XAS spectra were processed as has been described.45 In general, XAS spectra were splined and normalized within the program PySpline.47 Normalization included division of the entire XAS spectrum by its fitted spline. Splines were chosen to pass through unit intensity across the entire X-ray absorption near edge (XANES) energy region. Each scan of solid l-cysteine required approximately 22.6 min, while each solution scan required 16 min.
Compositional fractions of the X-radiolyzed l-cysteine samples were derived by fitting the experimental XAS spectra with linear combinations of the XAS spectra of model compounds, over the energy range of 2460-2485 eV. Fits were carried out using the program DATFIT, part of the EXAFSPAK program suite. EXAFSPAK was written by Prof. Graham George, University of Saskatchewan. The analytical approach to fitting XAS spectra has been described in detail.45,48
A. Fit error
In general, an acceptable fit was required to reproduce both the XAS spectrum and the second derivative of the XAS spectrum. Uncertainty due to the fit systematic error was calculated as Fse = , where TF is the sum of the fractional components. In a perfect fit, TF = 1.00. The systematic error is the sum of measurement error, data normalization, and processing error, and any disparity in XAS spectra between the model functional group and the functional group being modeled.49 The fitted fractions were normalized to yield a sum of 1.00, and the fractional estimated standard deviation (e.s.d.) values for individual fit components were adjusted by the normalization scaling factor. The total uncertainty in a fractional fit component, e.g., in a fitted fraction representing cystine, was calculated as the quadratic sum of the systematic and fit e.s.d. uncertainties, i.e.,
| (1) |
In Eq. (1), f is the normalized component fitted fraction and e.s.d. is the adjusted fit estimated standard deviation in that component fraction.45,48
In the fits to the experimental XAS spectra of radiolyzed l-cysteine, each first scan was used as the l-cysteine XAS reference standard to be used in fitting the subsequent scans. Small cysteine XAS energy calibration errors were occasionally adjusted out by floating the first-scan energy position during the fits. In these instances, the fitted energy offset (mean of offsets = 0.018 ± 0.006 eV) greatly decreased the fit error without impacting the reliability of the functional group assignment.49–52
The first scan was used as the reference l-cysteine XAS spectrum of the fits. However, scan 1 unavoidably contained some radiolyzed products. The loss of l-cysteine in the several first scans was apparent in plots of the derived l-cysteine fraction versus scan number. In these plots, extrapolation to the zero-scan intercept invariably produced an initial cysteine fraction greater than unity. Likewise, similar extrapolations of, e.g., fractional growth of radiolysis products, such as sulfur or cystine, produced positive product fractions at the zero intercept where none should be present. To account for this problem, a variant of the method of constant additions was applied (see below).53–55
Plots of the compositional fraction versus scan number were fitted using linear or first order kinetic models. The first order models were of the functional form y = ae−kx for a declining fraction, e.g., l-cysteine, or y = 1 − ae−kx for a rising product fraction, e.g., sulfur or cystine, where “y” is the fitted fraction, “a” is a pre-exponential factor, “k” is a rate constant in units of scan−1, and the values of “a” and “k” were determined by the fit.
The lines fitted to the l-cysteine fraction were vertically adjusted so as to equal 1.00 at the zero intercept. That is, the fractional purity of l-cysteine was assigned to be 100% prior to the first scan. However, the ±3.6% uncertainty in the purity of the stock l-cysteine, noted above, conditions this assignment. Likewise, the fractional trend of any immediate X-radiolytic product was corrected to be 0.0 at the zero intercept, indicating a 0.00 (±0.036) fraction prior to the first scan. The trends of radiolytic products that appeared after two or more scans were left uncorrected.
The adjusted fractional trends were then again fitted. The reported X-radiolysis rates reflect these latter fits. The fractions reported for the first scans are those extrapolated from the fits. The uncertainties for the fractional components of the first scans were taken as the root-mean-square of the total uncertainties in the later fitted fractions, , where i is the count of n scans.
Prior to measurements, the He-filled detector voltages were adjusted to the response saturation region to minimize pair recombination. The detector SR570 current preamplifiers were operated in tuned mode so that their accuracy is ±0.5% by the manufacturer’s specification. The voltage offset error is specified as constant and subtracts away. X-ray photon flux “N” at the sample was determined at 2420 eV, the beginning of an XAS scan, using Eq. (2) and the absorbance calculated for the 9 cm He-filled I0 ion-chamber, and the detector voltage and gain56
| (2) |
In Eq. (2), N is photons/s, A is the He detector photocurrent in Amperes, Abs is the X-ray absorbance of the He ion chamber, ν = 2420 eV, the X-ray energy at the beginning of a sulfur XAS scan, ℑ is Faraday’s constant (1.6022 × 10⁻¹⁹ C/e), and 41.3 eV/e is the e−-He+ ion pair energy.57 Abs must be in the Beer’s law regime. The methodology is also available at http://gbxafs.iit.edu/training/Photon_estimate.pdf. For this work, the energy deposited per scan = mean (eV)/photon × (photons/s) × (s/scan). The calculation of Grays per scan was followed from this estimate.
The 1/e absorbance attenuation length (the mean free path) for 2420 eV X-ray photons in He gas under conditions of 20 °C and 1 atm pressure is 1813 cm. X-ray mean free path lengths were obtai ned using the interactive website hosted by the Lawrence Berkeley Laboratory: http://henke.lbl.gov/optical_constants/atten2.html. The calculation is based upon a published study.58 At the rising sulfur K-edge, the attenuation length of 19.9 µm for a 2472 eV photon in 50 mM cysteine in 250 mM citrate buffer was calculated for 45° incident angle and a molecule of nominal formula S0.05C1.5Na0.38H110O55. The calculation assumed no volume change on dissolution. Sample solution density was estimated to be 1.032 gm/cc by interpolating the solution densities of H3 citrate and Na3 citrate from the tables of solution densities in the 67th edition of the Handbook of Chemistry and Physics (CRC Press). For sulfur alone in water, the formula used was H110O55S0.05, of density 1.0016 gm/cc.
III. RESULTS
A. Physico-chemical states
Figure 1 compares the sulfur K-edge XAS spectra of solid l-cysteine and dissolved solution-phase zwitterionic l-cysteine in pH 5 citrate buffer. The slight broadening and lower intensity XANES energy region of the solid may indicate some self-absorption and the effects of particle interstitial spaces59 but is nevertheless more intense than the reference l-cysteine XAS spectrum in the ID21 library.60 In the XAS of the solid, the structured intensity near 2478 eV reflects multiple scattering from the rigid molecular lattice, which is lost in solution.38 Solution-phase l-cysteine has five pH-dependent protonation states: one cationic, one neutral, two anionic, and one dianionic (Fig. 1, inset). In aqueous l-cysteine, the pKa values of –NH3+ (8.53) and –SH (8.86) are very similar43,44 so that the (NH2/SH) and (NH3+/S−) species coexist throughout their pH range. The overall-neutral zwitterion dominates in pH 4-7 solutions. In the experiments described below, the X-radiolytic behavior of l-cysteine was examined in solid phase, and in solution at pH 5, 7, and 9.
FIG. 1.

Sulfur K-edge XAS spectrum of l-cysteine: (red) solid phase mineral oil mull and (blue) 50 mM in pH 5 anaerobic citrate buffer solution. Inset: the pH distribution of aqueous l-cysteine.
B. Solid l-cysteine
The radiolytic chemistry of l-cysteine in the solid state has received much less attention than that in solution.21–23 A variety of photon-induced reaction channels have been reported, with cystine and hydrogen as the major products, followed by ammonia and H2S.23
These reported products were taken to imply the following solid state X-radiolytic reactions:
| (R1a) |
| (R1b) |
| (R1c) |
| (R1d) |
| (R1e) |
In Reactions (R1), Ala• is •CH2CH(NH2)COOH, the alanyl radical, and Pr• is propionylate. Radiolytic deamination yields the α-carbon radical intermediate HSCH2CH(•)COOH.23 This radical can rapidly undergo internal hydrogen atom transfer to yield the thiyl radical, •SCH2CH2COOH [Reaction (R1e)].61
SSRL beam line 4-3 produced a flux of about 2.6 × 10¹² photons per second in the sample during the course of this experiment (see Sec. II for the method of calculation). Figure 2(a) shows that radiolytic modification of l-cysteine was already evident in the second measured XAS spectrum and was progressive in subsequent scans. Extrapolation of the fractional data back to zero scans (see below) indicated the immediate appearance of the radiolytic products in the first scan.
FIG. 2.

(a) Sequential sulfur K-edge XANES spectra of solid l-cysteine showing the systematic effects of beam line X-radiolysis (cf. color-coded scan numbers). Inset points are the fractional amounts of (violet) l-cysteine, (orange) cystine, (blue) methionine (model for thioether, see text), and (green) elemental sulfur. The lines are first order kinetic fits. The total uncertainty bars are within the points. (b) The XAS spectra of (○) solid l-cysteine scan 6 and (blue line) the fit to the XAS. The fractional fit components are (purple line) l-cysteine, (orange line) cystine, (blue line) methionine, and (green line) elemental sulfur. Inset: the second derivative of (○) l-cysteine XAS scan 6 and (blue line) the fit.
Fits to the sulfur K-edge XAS spectra of X-radiolyzed l-cysteine were carried out to determine the sulfur-containing products. The fits employed linear combinations of the XAS spectra of model compounds. Previous studies have shown that this method is very sensitive to functional group identity and is even able to differentiate among identical functional groups in alternative structural environments.45,46,49 A total of six sequential XAS spectra were measured across a 619 eV energy range (2420-3039 eV). Two sequential spectral scans of an independent second solid sample were also obtained. The fits yielded fractional compositions and showed that cystine and elemental sulfur were immediate products. The methionine XAS model, also of immediate need to fully fit the XAS spectra, was used to indicate the possible presence of lanthionine (dialanylsulfide). The trends in product fractions are shown in the inset of Fig. 2(a). Hydrogen sulfide was undetected.
The use of methionine in the fit is not meant to imply an improbable radiolytic methylation of cysteine-sulfur. Rather, it implies the radiolytic appearance of a thioether. That is, the XAS of methionine is used to model the appearance of an aliphatic thioether of otherwise unknown structure. In solid l-cysteine, intermolecular proximity of the thiol groups permits attack of an alanyl radical [Reaction (R1d)] on the thiol of the proximate cysteine (see Scheme 1). Lanthionine (Ala–S–Ala) is a known reaction product of aqueous l-cysteine following 60Co γ-radiolysis62 but has not been reported in the radiolysis of solid cysteine. However, radiolysis of pure ethyl mercaptan produced diethyl sulfide in 15% yield.63 Thus, such an attack is a reasonable surmise for the appearance of a dialkyl sulfide radio-product (see below for details).
SCHEME 1.
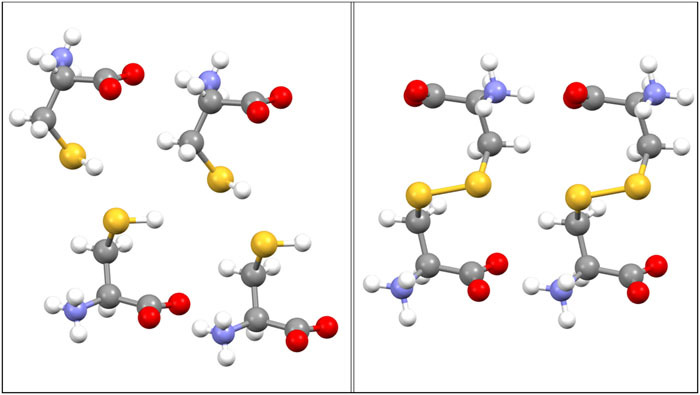
The molecular proximity of sulfur within (left) l-cysteine and (right) l-cystine, within their respective crystalline lattices. The adjacent S–S distances are (cysteine) 3.849 Å and (cystine) 2.047 Å.95,96
Solid l-cysteine followed a first order decay (k = −0.086 ± 0.001 scan−1), while cystine (k = 0.025 ± 0.001 scan−1) and methionine (k = 0.03 ± 0.002 scan−1) followed a first order increase. Growth of elemental sulfur could be fit equally well with a linear or first-order model [k = (9 ± 1) × 10−3 scan−1]. Traces of more highly oxidized forms of sulfur were found in later scans, notably including cysteine sulfinic acid (0.9 ± 0.1% in scan 6). More highly oxidized forms of sulfur produce more intense K-edge XAS white-line features because the transition dipole is larger.50,64,65 Oxidized sulfur can thus be detected at proportionately lower concentrations than lower valent sulfur. Figure S1 of the supplementary material illustrates the ability to resolve small fractions of oxidized sulfur in fits to the XAS spectra of radiolytic composites.
The initial l-cysteine was reduced to 92% ± 1% after a single scan and to 77.5 ± 0.7% after three scans. The second solid sample yielded the identical 92 ± 1% cysteine fraction remaining after a single scan. Sulfur functional group models tested and not detected in any of the six scans included hydrogen sulfide, ethylene episulfide, trimethylsulfonium, sulfite, alkylsulfonate, sulfate, and alkylsulfate ester.
Table I provides the fraction of each sulfur functional group model derived from the fit to the sixth scan. In the first two scans, only cystine, thioether, and elemental sulfur were detected. Each scan comprised about 22.6 min of X-irradiation. The X-ray photon flux rate was estimated to be 2.6 × 10¹² per s, producing 3.5 × 10¹⁵ photons per scan. The yields of radiolysis products are typically reported as G-values, which represent the number of molecules produced per 100 eV of radiant energy deposited.66 However, as the weight and uniformity of the sample in the beam are unknown, accurate G-values could not be determined.
TABLE I.
Sulfur fractions from XAS radiolysis of solid cysteine.a
| Fraction | ||
|---|---|---|
| XAS model | After scan 1 | After scan 6 |
| l-cysteine | 0.92 ± 0.01 | 0.60 ± 0.01 |
| Cystine | 0.025 ± 0.005 | 0.14 ± 0.01 |
| Thioetherb | 0.030 ± 0.008 | 0.16 ± 0.01 |
| Elemental sulfurc | 0.009 ± 0.003 | 0.054 ± 0.005 |
| Sulfoxided | … | 0.005 ± 0.001 |
| Sulfonee | … | 0.002 ± 0.001 |
| Sulfinic acidf | 0.002 ± 0.0006 | 0.01 ± 0.001 |
Each scan delivered a mean of 9.0 × 10¹⁸ eV.
As methionine.
As sulfur atoms.
As methionine sulfoxide.
As methionine sulfone.
As cysteine sulfinic acid.
C. Air-saturated buffered pH 5 solution
The initial products of water X-radiolysis include hydrated electrons (), hydrated protons (H+), hydrogen atoms (H•), and hydroxyl radicals (HO•).67,68 The radical species exhibit diffusion-controlled reaction rates with l-cysteine at pH 5 and pH 7.68 The secondary X-radiolytic molecules, hydrogen (H2) and hydrogen peroxide (H2O2), react slowly or not at all with l-cysteine,17,20,69 which is also unreactive toward the more transient secondary radicals, superoxide ion (O2•−) and hydroperoxyl (HO2•).70·The major reaction pathways in radiolyzed aqueous l-cysteine have been reported in the following equations:16–20,22,69,71
| (R2a) |
| (R2b) |
| (R2c) |
| (R2d) |
| (R2e) |
| (R2f) |
| (R2g) |
| (R2h) |
The X-ray beam spot was 2 × 8 mm, which provided about 2.5 × 10¹¹ photons per second to the sample (see Sec. II). The path length of the sample cell (2 mm) was about 100 times the 19.9 µm 1/e solution attenuation length of 2472 eV X-radiation at the 45° incident angle. Thus, effectively 100% of the incident X-radiant energy was deposited in the sample solution along the beam track. Neglecting radical recombination, there will be approximately 480 radical pairs per 2472 eV photon absorbed. (The bond-dissociation energy of water is 496.9 kJ/mol.72) This is equivalent to 1.2 × 10¹⁴ radical pairs per second (HO• + H• or ) and will produce about 1.2 × 10¹⁷ radical pairs over the course of a 16 min scan.
The experimentally determined prompt G-values for γ-radiolysis of water are, per water molecule, 0.839 , 0.109 H•, 1.00 HO•, 0.0263 H2, and 0.0 H2O2,73 which are similar to predictions from theory.66,74 The subsequent reactive chemistry of the radical species is complete within about a microsecond.74–76 The prompt concentration of HO• or H•/ is maintained throughout irradiation and was thus about 0.83 µM. The ratio /H• = 7.7 implies prompt [] = 0.74 μM and [H•] = 0.095 μM. More than 99.9% of these radicals will have been produced within the first 60 µm from the incident surface of the sample, i.e., 3× the solution attenuation length. The number density of 50 mM l-cysteine per 0.24 ml sample volume is 7.2 × 10¹⁸ molecules. Thus, the total radical flux per scan was equivalent to about 3.3% of the l-cysteine present in 0.24 ml of 50 mM solution. As will be shown, the rate of l-cysteine X-radiolytic transformation is consistent with this production of radicals.
The radiolytic products resulting from aqueous l-cysteine were investigated in pH 5, 7, or 9 buffered solutions, both alone and including 40% glycerol. Buffers consisted of 250 mM citrate (pH 5 or 7) or 150 mM sodium carbonate (pH 9) with 100 mM citrate. Citrate was employed throughout to sequester adventitious transition metals77 and reacts relatively slowly with radiolytic , H•, or HO•.25,68,78
The XAS spectra in Fig. 3 show the sequential radiolytic transformation of pH 5 solution-phase l-cysteine. In contrast to the majority cystine product from solid l-cysteine radiolysis, in pH 5 solution, the dominant product was elemental sulfur. The second derivative feature at 2472 eV in Fig. 3(b) (inset) provides clear evidence of this difference [compare with Fig. 2(b) (inset)].
FIG. 3.

(a) Colored lines: sequential sulfur K-edge XAS spectra of l-cysteine in air-saturated pH 5 solution showing the progress of X-radiolysis. Inset: the points and fitted trends of (blue line) l-cysteine, (orange line) elemental sulfur, and (red line) R3S+. The ±1σ uncertainty bars are within the points. (b) Sulfur K-edge XAS of (○) the tenth scan and (purple line) the fit. The fit components are (blue line) l-cysteine, (orange line) elemental sulfur, (brown line) cystine, and (red line) (CH3)3S+. Inset: the second derivative of (○) the tenth scan and (purple line) the fit. Cystine did not emerge until the third scan but exhibited complex behavior (see below).
Given a constant radical flux, the rate of reaction of l-cysteine should be dependent only on concentration and produce a first order decay. This proved to be the case (k = −0.032 ± 0.001 scan−1). However, both linear and first-order models gave nearly identical fits to the appearance of sulfur (k = 0.019 scan−1) and of R3S+ (k = 0.001 scan−1). Cystine appeared in the third scan and then declined, reaching zero at scan 5. After scan 6, cystine again increased systematically (Table III), reaching 2.4% of sulfur at scan 10 (Fig. S2 of the supplementary material). A similar quasi-cyclic behavior in the appearance of cystine during X-radiolysis of dissolved l-cysteine was reported previously.79 The same sequence was also observed when glycerol was present (see below). Hydrogen sulfide (1.6% of total sulfur) improved the fit to the second scan but was excluded thereafter. More highly oxidized minor products appeared immediately and were modeled by R3S+, alkylsulfonate, and sulfate. The trends in minor products are shown in Fig. S2 of the supplementary material.
TABLE III.
Major product rates for radiolysis of air-saturated aqueous l-cysteine solutions.a
| pH 5 | pH 7 | pH 9 | ||||
|---|---|---|---|---|---|---|
| Compound | Aqueous | 40% Glycerol | Aqueous | 40% Glycerol | Aqueous | 40% Glycerol |
| Cysteine | 3.2 ± 0.1 | 4.0 ± 0.04 | 3.1 ± 0.1 | 3.8 ± 0.2 | 1.3 ± 0.2 | 1.9 ± 0.3 |
| Sulfur | 2.5 ± 0.1 | 2.9 ± 0.02 | 1.4 ± 0.1 | 1.9 ± 0.2 | 0.7 ± 0.2 | 1 ± 0.2 |
| Cystine | 0.01 ± 0.002b | 0.01 ± 0.001c | 0.9 ± 0.2 | 0.7 ± 0.1 | n/a | n/a |
| R3S+ | 0.14 ± 0.01 | 0.24 ± 0.02 | n/a | n/a | … | … |
| Sulfite | 0.08 ± 0.02 | n/a | n/a | n/a | … | … |
| Sulfate | 0.03 ± 0.005 | n/a | 0.09 ± 0.01 | n/a | … | … |
Rate are in units of ×10−2 scan−1.
Rate following scan 7.
Rate following scan 5.
D. Air-saturated buffered pH 5 solution with 40% glycerol
Addition of glycerol strongly affected the composition of radiolytic products. Glycerol itself quenches hydroxyl radicals at a nearly diffusion-limited rate, with the production of glyceraldehyde, 1,3-dihydroxy acetone, or formaldehyde.29,78,80 However, the reaction of glycerol with hydrogen atoms is much slower, ∼107 M−1 s−1, and occurs about the same rate that H• abstracts an α-hydrogen from l-cysteine.78,81 Thus, added glycerol can suppress oxidation, but not hydrogenolysis.82
The disappearance of l-cysteine was more rapid in the presence of 40% glycerol, falling to 67% of total sulfur by the tenth scan (k = 0.040 ± 0.04 scan−1), relative to 73% in the absence of glycerol (Table II). The major radiolytic product was again elemental sulfur, which exhibited a faster rate of appearance (k = 0.029 ± 0.0002 scan−1) than when glycerol was absent and accounted for 23% of total sulfur by the tenth scan. Radiolytic cystine exhibited complex behavior, reaching an early maximum in scan 2 and then systematically decreasing to zero by scan 6. After scan 6, the cystine fraction again increased, reaching 5% of sulfur by scan 10. As noted above, an attenuated version of this rise-and-fall behavior was also observed in the absence of glycerol. Scan-by-scan XAS changes are shown in Fig. 4.
TABLE II.
Air-saturated radiolysis tenth scan fractions.a
| pH 5 | pH 7 | pH 9b | ||||
|---|---|---|---|---|---|---|
| Component | Aqueous | 40% Glycerol | Aqueous | 40% Glycerol | Aqueous | 40% Glycerol |
| l-cysteine | 0.73 ± 0.004 | 0.67 ± 0.02 | 0.74 ± 0.02 | 0.72 ± 0.02 | 0.87 ± 0.02 | 0.82 ± 0.03 |
| Cystine | 0.02 ± 0.004 | 0.05 ± 0.003 | 0.09 ± 0.005 | 0.07 ± 0.01 | 0.02 ± 0.01 | 0.07 ± 0.01 |
| Sulfur | 0.19 ± 0.003 | 0.23 ± 0.01 | 0.11 ± 0.004 | 0.17 ± 0.01 | 0.08 ± 0.01 | 0.10 ± 0.01 |
| R3S+ | 0.01 ± 0.001 | 0.02 ± 0.001 | n/a | n/a | … | … |
| Sulfite | 0.01 ± 0.001 | 0.02 ± 0.001 | n/a | nd | … | … |
| Sulfoxide | n/a | n/a | 0.01 ± 0.001 | n/a | … | … |
| Sulfonate | n/a | n/a | n/a | n/a | … | … |
| Sulfate | n/a | n/a | 0.01 ± 0.0003 | n/a | … | … |
“nd” is not detected; “n/a” is present but of fraction less than 0.01.
For pH 9 solutions, only five scans were recorded, and the fractions for the tenth scan represent extrapolations from linear fits to the data. The extrapolations allow comparison with pH 5 and pH 7 fractions. The pH 9 fifth scan fitted fractions were (aqueous or glycerol) as follows: l-cysteine, 0.95 ± 0.02, 0.92 ± 0.03; cystine, 0.01 ± 0.004, 0.03 ± 0.002; and sulfur, 0.05 ± 0.002, 0.04 ± 0.002. The mean energy deposited per scan was 6.2 × 10¹⁷ eV, equivalent to 4 × 10⁵ Gy (sample solution mass = 2.5 × 10⁻⁷ kg).
FIG. 4.

(a) Colored lines are sequential sulfur K-edge XAS spectra of l-cysteine in pH 5 solution with 40% added glycerol (cf. the color-coded scan numbers). Inset: points and fitted trends of (blue line) l-cysteine, (orange line) sulfur, (green line) cystine, and (red line) R3S+. The error bars are the fit ±1σ uncertainty. The lines are first order kinetic fits, except for that of cystine which is arbitrary. (b) The sulfur K-edge XAS of (○) the tenth scan and (purple line) the fit. The fit components are (blue line) l-cysteine, (orange line) elemental sulfur, (green line) cystine, (red line) (CH3)3S+, (brown line) cysteine sulfinate, (pink line) methyl sulfonate, and (light aqua line) sulfate. Inset: the second derivative of (○) the tenth scan and (purple line) the fit.
Hydrogen sulfide again contributed to the fit to the second scan (1.9% of total sulfur) but was excluded in fits to subsequent scans. Traces of more highly oxidized sulfur slightly improved fits to later scans. These included sulfoxide, cysteine sulfinic acid, methyl sulfonate, and sulfate. In contrast to the case without glycerol, none of the minor more oxidized sulfur products appeared before the second scan. A sulfate fraction did not appear until scan 4. Of these, only the cysteine sulfinic acid fraction approached 1% by the tenth scan. The scan-by-scan trends of these minor products are shown in Fig. S3 of the supplementary material.
The experiments were repeated at pH 7 and 9, again without and with 40% added glycerol. The XAS scans of l-cysteine in pH 7 solution are shown in Figs. S4 and S5 of the supplementary material. At pH 7, the rates of l-cysteine decay were similar to those found for pH 5 (Table II). Although radiolytic cystine did not appear until the third scan at pH 7, it then increased far more quickly and achieved a greater final fraction than in pH 5 solution (see Table II). However, while elemental sulfur alone completely dominated the radio-product in pH 5 solution, both sulfur and cystine were significant among the radiolytic products at pH 7. No other sulfur product, including H2S, contributed significantly.
The experimental XAS spectra for the pH 9 l-cysteine solutions without and with 40% glycerol are shown in Figs. S6 and S7 of the supplementary material, respectively. The trace fractions of oxidized sulfur found present by scan 5 in pH 5 and 7 solutions were undetectable at pH 9.
The major radiolytic products for all the tested solutions are given in Table II, representing the fractions found for the tenth scan. Only five XAS scans were obtained for the pH 9 samples. The 10-scan values for pH 9 are thus extrapolated from lines fitted to the five points. Table III shows the per-scan rates of disappearance of l-cysteine and the appearance of radiolytic products.
E. Anaerobic pH 5 buffered solution
Finally, a single long-duration anaerobic experiment was carried out, consisting of thirty-five sequential sulfur K-edge XAS scans on a single anaerobic solution sample under the pH 5 conditions. The experimental solution was prepared under an inert atmosphere immediately prior to measurements (see Sec. II). The experimental solution dehydrated over the 13-h course of this experiment (see below). However, careful inspection of the sample cell at the end of the measurements revealed no holes, leaks, or external residues, showing that the 5 μm-thick polypropylene window had remained intact and sealed throughout.
Although dehydration was an unexpected development, this contingent eventuality produced a striking result. It was thus decided to include it here as an inadvertent but revealing and highly interesting experiment.
The radiolysis products strongly modified the XAS spectrum of l-cysteine over the course of the measurements (Fig. S8 of the supplementary material). The sulfur K-edge XAS spectra of all thirty-five scans were fit using the model XAS spectra to derive the fractions of sulfur radiolysis products (cf. Fig. S9 of the supplementary material for representative fits to the XAS spectra of scans 5, 15, 25, and 35).
Two remarkable results originated from this experiment, as shown in Fig. 5. The first was the unexpected bimodal reaction track of both l-cysteine and every major radiolytic product. In each track, the change-over from the initial to the final mode of the reaction occurred near scan 13. All of the prompt minor X-ray induced reaction-products exhibited similar behavior (Fig. S10 of the supplementary material). The second surprise was that sulfur oxidation was more pronounced under anaerobic conditions than in air saturated solution. By scan 35, the fraction of l-cysteine was reduced to about 7% of the total sulfur. At the same time, cystine had come to represent some 65% of the sulfur. Elemental sulfur rose to 20% of the total sulfur by scan 12 but declined thereafter, finishing at about 9%. The overall radiolytic response was very different from that observed in air-saturated buffer (discussed below).
FIG. 5.

Left panel: the biphasic X-radiolytic response of (red line) l-cysteine, (green line) cystine, and (blue line) elemental sulfur. Right panel: the same data fit with first order kinetic models. A change in the reaction trajectory occurs in each case at about scan 13. In the right panel, the uncertainty bars are the ±1σ of the fractional fit (see Sec. II).
The notable transformation of the sulfur K-edge XAS spectrum is shown in Fig. S8 of the supplementary material. The XAS signature of l-cysteine was serially diminished, and by the fifteenth scan, it was completely subsumed beneath the XAS intensity of the products; primarily radiolytic cystine. H2S was undetectable throughout. In addition, multiple XAS features at energies greater than 2476 eV signaled the appearance of oxidized sulfur in the later scans, with a sulfate feature visible at 2483 eV. Figure S9 of the supplementary material provides examples of the fits to these XAS spectra. The fits to the late scans are of diminished quality, indicating radiolytic products unaccounted using the available model XAS library.
As noted above, this sample was observed to have dried over the course of the experiment, thereby starting as a solution and ending as an evaporite. The most reasonable conjecture for the behavior displayed in Fig. 5, therefore, is that radiolysis was solution-phase in the early stage but solid-phase in the later stage. The turnover from solution-phase to solid-phase reactivity apparently occurred at about scan 13.
To test this idea quantitatively, the amount of water, q (cm3), that could pass through the polypropylene window over a given time was estimated using the following equation:83
| (3) |
In Eq. (3), Q is the permeability coefficient of a given plastic material in units of cm2/(s-torr), A is the area of the film (cm2), P1 − P2 is the difference in vapor pressure across the film (torr), d is the film thickness (cm), and t is the time (s). The value of Q for polypropylene is 2.26 × 10⁻¹⁰ cm2/(s-torr) at 293 K.84,85 The sweep of dry He gas (P2 = 0 mm Hg) through the sample chamber efficiently carried away any emergent water vapor.
In the anaerobic experiment, the vapor pressure of water exerted by the sample will have decreased to a near negligible value as evaporation proceeded toward dryness. The average pressure difference across the film during drying is therefore taken as half the vapor pressure of water at 20 °C so that (P2 − P1)avg = 8.8 mm Hg. The estimate from Eq. (3) is that the 5 μm thick polypropylene window (1.2 cm2) was capable of passing about 0.227 cm3 of water vapor over the 13.2 h consumed by the 35 scans. This volume is not enough to reduce the 240 μL sample to dryness. The possibility of bulk solution loss is eliminated by the absence of solid evaporate on the external faces of the sample cell and the residual solids within it. Loss through evaporation by X-ray heating is unlikely.86 Thus, the mechanism of solvent water loss remains unknown at present. Nevertheless, the sample was reduced to a hydrous solid that should have consisted primarily of citrate with about 20% sulfurous impurities. Possible loss of H2S by a similar mechanism was also considered and is discussed in the supplementary material.
Table IV provides the fractional composition of this anaerobic solution at the tenth and thirty-fifth scans, which allows comparison with the tenth scan of the aerobic radiolysis experiments.
TABLE IV.
Anaerobic radiolysis fractions for scans 10 and 35.
| Compound | Scan 10 | Scan 35 |
|---|---|---|
| Cysteine | 0.60 ± 0.01a | 0.079 ± 0.007a |
| Cystine | 0.17 ± 0.01 | 0.66 ± 0.07 |
| Sulfur | 0.22 ± 0.006 | 0.10 ± 0.01 |
| R3S+ | ndb | 0.052 ± 0.006 |
| Sulfite | nd | 0.027 ± 0.004 |
| Sulfoxide | 0.013 ± 0.001 | 0.0 |
| Sulfonate | n/ac | … |
| Sulfate | 0.004 ± 0.001 | 0.010 ± 0.002 |
| EtepiSd | 0.058 ± 0.006 | 0.0 |
| Thiamine | 0.021 ± 0.003 | 0.08 ± 0.01 |
| Cysteine sulfinate | 0.006 ± 0.001 | 0.023 ± 0.003 |
| MeOSO3− | 0.034 ± 0.002 | 0.016 ± 0.004 |
Total fractional uncertainty.
nd is not detected.
n/a is fraction less than 0.001.
Ethylene epi-sulfide. The mean energy deposited per scan was 6.2 × 10¹⁷ eV, equivalent to 4 × 10⁵ Gy (sample solution mass = 2.5 × 10⁻⁷ kg).
The trends in radiolytic products could invariably be fit with first order kinetic models (see Sec. II). The uniformly first order processes indicated single-reaction pathways within each of the two unique regions of the reaction. All of the major reactions and most of the minor reactions showed this biphasic behavior (see Figs. S10 and S12 of the supplementary material) with the second reaction phase invariably initiating at about the 13th scan. Thus, in Fig. 5, the first declining trend in l-cysteine would have apparently terminated near fraction 0.5. However, termination was interrupted by initiation of the second declining trend, which began at about a 0.55 fraction of cysteine. Likewise for cystine, after the slower first-phase rise reached about 0.2 fraction, the more rapid production initiated following scan 13.
In fits to Fig. 5 fractional trends, the first order kinetic equation including an offset, y = ae−kx + b, was applied to account for the second phase of a declining sulfur fraction such as l-cysteine. This floated linear offset, “b,” accommodated fractional trends that neither tend toward nor begin at zero, or did not begin at unity. Table V lists the radiolytic products detected in this anaerobic experiment and their fitted fractional rates.
TABLE V.
Product rates from radiolysis of pH 5 anaerobic aqueous l-cysteine.a
| Initial phase | Late phase | |||
|---|---|---|---|---|
| Group | Rate (scan−1) | Offset | Rate (scan−1) | Offset |
| Cysteine | 0.18 ± 0.03 | 0.47 ± 0.04 | 0.21 ± 0.01 | 0.065 ± 0.004 |
| Cystine | 0.12 ± 0.05 | −0.74 ± 0.05 | 0.20 ± 0.01 | −0.32 ± 0.01 |
| Sulfur | 0.10 ± 0.05 | −0.69 ± 0.09 | 0.12 ± 0.02 | −0.91 ± 0.01 |
| Episulfide | 0.19 ± 0.08 | −0.92 ± 0.01 | nd | … |
| Thiamine | 0.37 ± 0.14 | −0.97 ± 0.002 | 0.17 ± 0.03 | −0.91 ± 0.003 |
| R3S+ | nd | … | 0.20 ± 0.02 | −0.95 ± 0.001 |
| Sulfoxide | 0.12 ± 0.12 | 0.97 ± 0.01 | 0.36 ± 0.12 | … |
| Sulfone | nd | … | 0.35 ± 0.05 | −0.98 ± 0.001 |
| Cys sulfinate | nd | … | 0.11 ± 0.06 | −0.98 ± 0.002 |
| Sulfite | nd | … | 0.09 ± 0.01 | −0.97 ± 0.002 |
| Sulfate ester | 0.13 ± 0.08 | −0.95 ± 0.02 | 0.19 ± 0.03 | 0.01 ± 0.001 |
| Sulfate | nd | … | 0.10 ± 0.06 | −0.99 ± 0.002 |
Rates are units of fraction per scan. “nd” is not detected.
Under anaerobic radiolysis, l-cysteine declined at about twice the air-saturated rate [compare Figs. 5 and 3(a)], due to a more rapid production of cystine. Under aerobic radiolysis, cystine was never more than a minor product (Fig. 3). However, elemental sulfur appeared at the nearly same rate under both conditions. By scan 10, anaerobic or aerobic, elemental sulfur reached 20% ± 0.7% or 19% ± 0.3% of total sulfur, respectively (Table II, Fig. 3). In contrast, cystine and elemental sulfur appeared together immediately only under anaerobic conditions. There, they increased rapidly at the nearly same rate, and totaled 41% of sulfur by scan 13. After scan 13, the rate of cystine production increased, quickly bringing cystine into dominance of the reaction product, while the fraction of elemental sulfur declined. During the apparently emergent solid phase, and only during this phase, the declining trend of l-cysteine showed a 0.999 linear correlation with the corresponding rise of cystine, with a near unit slope (see Fig. S13 of the supplementary material). This implies a direct conversion of cysteine to cystine, as well as that cystine entered no further chemistry. Following scan 13, therefore, all the later-appearing minor products evidently arose from modification of the prior radio-products. This includes products represented by the thiamine, sulfone, trimethylsulfonium, sulfite, cysteine sulfinic acid, and sulfate models (see Figs. S10 and S12 of the supplementary material).
The minor functional groups also exhibited the trends shown in Fig. 5, with a reactivity transition again at about scan 13. Minor fractions were modeled by the XAS spectra of thiamine, sulfoxide, sulfone, and methylsulfate (see Fig. S10 of the supplementary material). The thiamine model was unique to the anaerobic experiment. Sulfoxide rose to about 2% of total sulfur by scan 13 but then declined to zero by scan 17. A sulfone appeared at scan 15, reaching 2% of total sulfur by the final scan. Sulfate ester rose to 4% of sulfur by scan 13, declining thereafter to 2% by scan 35. Further minor functional groups also appeared later in the XAS scan series and were modeled using sulfite, cysteine sulfinic acid, sulfate ion, and trimethylsulfonium ion, which latter reached about 5% of total sulfur (Fig. S12 of the supplementary material). Sulfur functional group XAS spectra are structure-dependent, and the sulfate ester was modeled here with the XAS of dissolved CH3OSO3− ions.48,49
The available library of sulfur XAS spectra was not extensive enough to model some of the intensity appearing in the anaerobic experiment after long irradiation times. Thus, small fit lacunae became visually emergent by scan 17 (see Fig. S9 of the supplementary material). The poorer fit quality of the later scans implies that certain late-emergent sulfur functionalities remained unfit. However, each functional group is defined by unique intensity characteristics.49–52,87,88 The model spectra were not allowed to shift energy position during the fit so that any one model XAS spectrum could not fit the intensity produced by any unique and late-emergent sulfur functional group.
Thus, the sulfur functional group identities of the fitted fractions should not have been compromised by the unfit intensity. However, the unfit newly emergent minor components remain absent from the list of discerned sulfur functional groups. This point is discussed more fully in the supplementary material.
Figure 6 compares radiolytic progress of l-cysteine, cystine, and elemental sulfur across ten scans under the three pH 5 conditions: in aerobic solution both without and with 40% glycerol, and in anaerobic solution. l-cysteine was removed slightly faster with glycerol present than in its absence. Glycerol also caused a more rapid production of elemental sulfur. Cystine appeared immediately in the absence and presence of 40% glycerol, traversed a fractional maximum in scan 2, and then declined to zero by scan 6. At scan 7, cystine appeared again and then increased through scan 10. This behavior was reported previously79 and implies that radiolytic cystine reacts further. Irradiation of cystine itself produces elemental sulfur, as does irradiation of H2S.16
FIG. 6.

Radiolytic progress in pH 5 citrate buffer of (•) l-cysteine, (⧫) cystine, and (■) elemental sulfur. Further conditions are (blue lines) air saturated, (green lines) air saturated with 40% glycerol, and (red lines) anaerobic. All lines but those of cystine are fit with a first order kinetic model (cf. Tables II and III). The fit to cystine points 0-5 in the 40% glycerol data is an arbitrary Gaussian of no physical meaning. The lines for anaerobic cystine and sulfur nearly overlay. Uncertainty bars are left out for clarity (cf. Figs. 3–5).
Under anaerobic conditions, l-cysteine diminished at about twice the air-saturated rate. The difference was caused by a greatly increased production of cystine, which now appeared at a rate approximately equal to that of elemental sulfur (Fig. 6). Indeed, when the anaerobic radiolytic trends in cysteine and cystine fractions are summed, the combined line matches the trend in aerobic pH 5 l-cysteine, within noise. However, elemental sulfur appeared at a nearly unchanged rate through scan 10 under all three conditions.
Figures 7(a) and 7(b) display the XAS spectra and fits of the tenth scan measured under air-saturated and anaerobic conditions, respectively, illustrating the remarkable product differences between the two pH 5 experiments. The anaerobic experiment produced considerably more products, including oxidation products that are visible as the greater intensity between 2476 and 2485 eV. That the air-saturated sample [Fig. 7(a)] was the less oxidized provides a certain irony to this comparison.
FIG. 7.

(Points) The tenth-scan sulfur K-edge XAS spectra of l-cysteine in 250 mM pH 5 citrate buffer under (a) air-saturated and (b) anaerobic conditions. The blue line is the fit to the XAS spectrum. The XAS spectra of the components of the fit are (green) l-cysteine, (red) elemental sulfur, and (mauve) cystine. In (b), they also include (light green) ethylene epi-sulfide, (violet) thiamine, (light blue) sulfoxide, and (orange) alkyl sulfate ester. See Tables II and V for component fractions.
IV. DISCUSSION
Synchrotron X-ray beams are both monochromatic and can be tuned to the energy of an X-ray absorption resonance of a particular element. Only the first of these capacities is typical of radiolysis using Co60 γ-radiation or other energetic sources. Few molecular radiolysis studies have utilized synchrotron X-rays, although synchrotron sources are now extensively used to produce hydroxyl radicals for protein footprint studies.33 Synchrotron K-edge radiolysis of cysteine, methionine, and cystine revealed energy-dependent differences in fragmentation patterns.89 Similar differences were found on irradiation of solid cystathionine (Ala-S-γ-aminobutyric acid) at 2472 eV (the sulfur K-edge) relative to irradiation below the K-edge at 2466 eV.90 The 2472 eV irradiation was about three times more efficient at cleaving a cystathionine C–S bond, with the favored pathway being the release of γ-aminobutyric acid. K-edge enhanced photo-cleavage has also been observed on the synchrotron irradiation of molecular solids containing phosphorous, bromine, or iodine.35,91–94 In solution, the Auger effect enhances macromolecular bond-scission following K-edge photo-absorption, and this photo-process has been recently reviewed.36 Thus, resonant energy absorption at the K-edge provides direct photolytic routes to radical chemistry, in addition to the reactions that can follow the radiolytic decomposition of water.
A. Solid l-cysteine
Scheme 1 shows the disposition of l-cysteine and l-cystine within their respective crystalline lattices.
In the solid, l-cysteine is immobilized within a rigid lattice. The absence of lattice water removes the radiolytic chemistry of hydroxyl radicals. The appearance of cystine in the radiolyzed solid thus implies the direct production of cysteine thiyl radicals [Reaction (R1a)] and their subsequent dimerization. Scheme 1 shows that the thiol sulfurs of crystalline l-cysteine are 3.849 Å apart and well-positioned for disulfide formation. Direct lattice-bound disulfide formation is thus facilitated by proximity and then effected by translation.
The major products reported previously for radiolyzed solid cysteine include cystine, H2, H2S, and NH3.23,97 In partial conformance with these results, cystine was found here, while hydrogen sulfide was undetected. Unlike prior studies, the synchrotron X-radiolysis produced a significant fraction of elemental sulfur. It thus seems likely that any H2S produced was rapidly converted to elemental sulfur. In previous studies, direct irradiation of H2S was found to produce considerable S8, as did cystine irradiation.16 Although elemental sulfur was unreported in the earlier studies, it could have constituted part of an insoluble fraction gravimetrically assayed and reported as cystine.23 Cystathionine X-irradiated at 2472 eV reportedly developed a yellow color that did not appear with irradiation at 2466 eV.90 If this color indicated elemental sulfur, then the dependence on resonant energy absorption is implied.
A lanthionine (dialanyl sulfide) product was also unreported previously in radiolysis of solid cysteine.23 However, the methionine XAS model needed here is a reasonable spectroscopic model for lanthionine or another dialkyl sulfide. In this regard, the distance between sulfur and the most proximate adjacent α-carbon is 3.777 Å, within crystalline l-cysteine, which is slightly less than the intermolecular S–S distance. The production of an α- or β-carbon radical can follow from intramolecular hydrogen-atom transfer in a radiolytic cysteine thiyl radical.61 Deamination reaction (R1e) also produces an α-carbon radical. These are situated to attack the thiol of an adjacent cysteine molecule, with the production of a dialkyl sulfide and a hydrogen atom. The latter will contribute to the evolution of radiolytic H2. In the radiolysis of pure ethyl mercaptan, the carbon radical reaction at sulfur produced diethyl sulfide.63
The small fractions of oxygenated products are unlikely to have arisen from the reaction with molecular oxygen because the sample was measured as a mineral oil mull spread on tape in a helium-flow atmosphere. However, direct quenching by carboxylate of an Auger dication could be the source of oxygenate products in irradiated dry anaerobic solid cysteine. That likelihood is estimated here. At 2473.4 eV, the X-ray attenuation length of alanine (i.e., the mean free path of an X-ray photon in the cysteine framework without the sulfur) is 20.3 µm, while for cysteine it is 6.4 µm (see Sec. II for the method of mean free path calculation). Thus, about [(20.3−6.4)/20.3] × 100 = 68% of the incident X-radiation incident on solid cysteine is absorbed at sulfur. Following resonant X-ray absorption, a 0.922 fraction of the photo-excited sulfur decays through a dication by two-electron KLL Auger emission.98 The X-ray beam provided 2.4 × 10¹² photons per second. Thus, the number of Auger decays per 23 min scan can be estimated as 2.4 × 10¹² photons/s × 1.38 × 10³ s/scan × 0.922 Auger transitions/(photon absorbed) × 0.68 photon absorbed = 2.1 × 10¹⁵.
The number of l-cysteine molecules under irradiation in the solid could be approximated through an estimate of the net absorbance of the sample. Well above the rising K-edge energy, the K-edge absorption coefficient can be estimated to within about ±1% per element for lighter atoms, yielding a total uncertainty of about ±2% for solid cysteine (ignoring H).99,100 Thus, the 1/e attenuation length (7.9 μm) for solid cysteine at 2729 eV (the mean energy of each XAS scan) and the corresponding 0.368 transmittance can be entered into Lambert’s law, , where It and I0 are transmitted and incident intensities, respectively, μ(E) is the linear absorption coefficient, and x is the thickness.101 This yields the X-ray absorption coefficient of solid cysteine at 2729 eV as εCys = 1.27 × 103 cm−1.
The net absorbance at 2729 eV for the first scan of solid cysteine was determined as the total absorbance minus the baseline absorbance (0.195-0.066) = 0.129 units. However, the Kα fluorescence efficiency of sulfur is 0.078, with Auger processes accounting for the remaining 0.922 of the absorbed energy.102 The corrected absorbance was thus 0.129/0.078 = 1.65 units. Entering this absorbance back into Lambert’s law, the average sample thickness x = 13 μm. The irradiated sample area (45° to the beam) of 0.085 cm2 thus produced an estimated mean sample volume of 1.1 × 10⁻⁴ cm3. The density of crystalline l-cysteine (1.525 g/cm3)95,103 then indicated an effective sample weight of 168 µg or 8.5 × 10¹⁷ molecules subject to X-irradiation. Thus about (2.1 × 10¹⁵/8.5 × 1017) × 100 = 0.25% of the cysteine molecules were converted into the Auger dication in each scan. This fraction is comparable to the production of oxido-sulfur (see Table I). It seems possible that some of the solid state dication might be quenched by the reaction with the negative carboxylate group, perhaps through an intramolecular 5-membered ring. Subsequent decarbonylation would yield a sulfenic acid. In another study, solid cysteine reportedly lost much of its carboxyl group during γ-radiolysis and suffered a 45% loss of carboxylate during irradiation with a 25 keV Ar+ beam.21,22
B. Dissolved l-cysteine
Following the transfer of the X-ray photon energy to a water molecule, the physical excitation process is complete in femtoseconds, diffusion of the prompt radiolytic products from the ionization track occurs over picoseconds, and any subsequent chemistry is complete in microseconds.74,75 Product formation over the course of a scan can therefore be assessed in terms of reactive radicals maintained at a steady-state concentration determined by the constant flux of incident X-rays.
The unexpectedly greater oxidation of l-cysteine in anaerobic solution, relative to air-saturated solution, requires some comment. The possible contribution of Auger processes to the formation of cysteine oxy-acids was first considered. The physico-chemical sequelae of synchrotron irradiation included both water radiolysis and the ionization of l-cysteine following resonant energy absorption at the sulfur K-edge. Following X-ray induced photo-ionization, 0.922 fraction of photo-excited sulfur decays through the two-electron KLL Auger process, while 0.078 fraction decays by Kα emission.98 The two-electron KLL Auger ejection of both K-shell and higher-shell electrons leads to a 2-hole dication transient state,89 opening possible reactions of Cys–SH2+.
Recently, the sulfur of dissolved l-cysteine was found to persistently retain a hydrogen bonded water molecule [see Reaction (R3)].38 The 2.2 Å Cys–(H)S⋯H–OH hydrogen bond was proposed to endure despite its low energy (2 kcal/mole) because the water molecule can be anchored through a hydrogen-bonding bridge to the adjacent –NH3+ group. In response to the sudden appearance of Cys–SH2+, the time, T, necessary for translation of this water oxygen by 1.2 Å to achieve a 1.7 Å S–O bonding distance,104 can be estimated from the diffusion coefficient of water in water.105 Thus, T = [1/(2 × 2.299 × 10−9 m2/s)] × (1.2 × 10⁻¹⁰ m)2 = 3.1 fs. The reaction of water with the Auger dication of cysteine sulfur during its transient lifetime will yield cysteine sulfenic acid106
 |
(R3) |
Cysteine sulfenic acid can react in multiple ways, including disproportionation to cysteine sulfinic acid and cysteine, and may go on to eventually produce cysteine sulfonic acid.107,108 To determine whether cysteine dication contributed to the observed solution chemistry, it is necessary to know the fraction of cysteine that becomes photo-ionized. The mean free path of 2472 eV X-rays through water at 45° incidence, without and with 50 mM sulfur, is 20.69 and 20.62 μm, respectively (see Sec. II for the calculation). The difference implies that sulfur itself absorbs only about [(20.69-20.62)/20.69] = 3.38 × 10⁻³ fraction of the incident X-ray photons at the K-edge. This fraction, multiplied by the X-ray photon flux of 2.5 × 10¹¹ per s, implies 8.5 × 10⁸ cysteine absorptions per s, or 8.1 × 10¹¹ resonantly excited molecules per 16 min scan (assuming no cysteine molecule is photo-excited twice per scan). The total spectroscopic sample included 7.2 × 10¹⁸ cysteine molecules. Of these, about 6.9 × 10¹⁵ cysteine molecules were in the spectroscopically active sample volume (60 µm × 0.2 cm × 0.8 cm). Thus, a 1.2 × 10⁻⁴ fraction of the irradiated molecules could have been activated by resonant absorption, per scan. This fraction is far too small to have contributed significantly to the radiolytic chemistry. It is, however, consistent with the small fraction of the sulfinic acid product (Table IV). Nevertheless, the Auger dication can be eliminated as a source of any of the observed major products. This leaves the explanation for the greater oxidation of the anaerobic sample to be found in water radiolysis.
Table VI gives the bimolecular rate constants and initial conversion rates for the most relevant radical reactions contributing to the radiolytic chemistry discussed here.68,78,81
TABLE VI.
Bimolecular rate constants in the radiolysis of cysteine.a
| Rate constant | |
|---|---|
| Reaction | (L mol−1 s−1)68 |
| + O2 →O2•− | 1.9 × 10¹⁰ |
| + H+ → H• | 2 × 10¹⁰ |
| + HO• → HO− | 3 × 10¹⁰ |
| H• + HO• → H2O | 7.0 × 10⁹ |
| H• + O2 → HO2• | 2.1 × 10¹⁰ |
| H• + HO2• → H2O2 | 2 × 10¹⁰ |
| + Cys-SH → HS− + Ala•b | 1.2 × 10¹⁰ |
| H• + Cys-SH → H2 + Cys-S• | 1.8 × 10⁹ |
| H• + Cys-SH → H2S + Ala• | 1.0 × 10⁹ |
| HO• + HO2• → H2O + O2 | 6 × 10⁹ |
| HO• + O2•− → HO− + O2 | 8 × 10⁹ |
| HO• + Cys–SH → H2O + Cys–S• | 3.4 × 10¹⁰ |
| H• + glycerol → H2 + glyceryl• | 2.9 × 10⁷ |
| HO• + glycerol → H2O + glyceryl• | 1.9 × 10⁹ |
| RS•+ RS•→ RSSR109 | 2 × 10⁹ |
[Cys–SH]0 = 50 mM, radiolytic steady state [HO•] = 0.83 µM, [H•] = 0.095 µM, [] = 0.74 µM. Aerobic solution [O2]0 = 284 µM, 40% v/v glycerol ≈5.5M.
Reaction with apparently does not produce Cys–S•.
When a solute concentration is >10−3M, the reaction with prompt water radiolysis products becomes important [cf. Reaction (R2)].110 This consideration applies to all the solution experiments reported here. For example, [l-cysteine]0 = 50 mM equates to one molecule per 3.3 × 10⁴ Å3. In comparison, the volume swept out by the ionization track of a single 2472 eV X-radiolytic photon is ≈3.9 × 10⁸ Å3, as estimated from the mean free path and a 25 Å radius for the ionization track (under the assumption of uniform Compton scattering).111–114 About 1.2 × 10⁴ l-cysteine molecules will be within any ionization track, and thus well-situated to encounter the prompt radiolytic radicals (HO•, H•, ), prior to their recombination. The immediate reaction of cysteine with hydroxyl radicals will produce cysteine thiyl radicals [Reaction (R2b)]. Subsequent known radiolytic chemistry can produce all the observed oxido-sulfur products.15,16,115 Figures 5 and 7, as well as Figs. S8 and S9 of the supplementary material, show this progression. All the oxidation chemistry stemming from hydroxyl radicals is present in both aerobic and anaerobic solutions.
Thus, the question to be answered is not why so much oxidation occurred anaerobically, but rather why relatively less oxidation was observed in air-saturated solution. Comparison of the product ratios of Tables II and IV indicates that air-saturation strongly limited the production of cystine. This difference is qualitatively independent of added glycerol and is the only major feature distinguishing the aerobic from the anaerobic product suite. Thus, dissolved oxygen apparently suppressed the cystine consequent to hydroxyl radical reaction (R2b).
Also relevant and no less surprising is that in air-saturated solution the production of cystine (pH 5 and 9) and of elemental sulfur increased with added glycerol. Table VI shows that 40% glycerol should have captured and removed much of the HO•.116,117 Nevertheless, at pH 5 in the presence of glycerol, the production of cystine exceeded that in the air-saturated solution alone (Fig. 6). The same quasi-oscillation in [cystine] noted in aerobic solution was still present but displayed a higher fractional amplitude with added glycerol. Thus, cystine production increased with the removal of either dissolved oxygen or HO• radical. These results taken together indicate, first, that dissolved oxygen somehow quenches most of the cysteine thiyl radicals produced under radiolysis. Second, most of the radiolytic cystine is not produced by HO• oxidation of dissolved cysteine [cf. Reaction (R2b)].
The standard reduction potential for radiolytic H• or is about −2.3 V or −2.9 V, respectively.68 These moieties will react to completion with even a mild oxidant. Reaction simulations of water radiolysis and experimental results indicate that dissolved O2 will capture virtually all of the radiolytic by way of Reaction (R4).75,118,119 The [O2]0 = 284 µM so that each 3.9 × 10⁸ Å3 ionization track contained about 67 O2 molecules. Table VI shows the reactions of H• and with O2 which are about 10 times and 1.6 times faster, respectively, than their rate of reaction with cysteine. The reaction of cysteine thiyl with O2 itself, to produce Cys–S–O–O• radicals, is about three orders of magnitude slower.120 Both H• and have an appreciable recombination rate with hydroxyl radicals, but the low concentrations restrict conversion. However, while H• reacts with cysteine to produce cystine or H2S, produces only HS−.14,69,121 The Ala• radical accompanies both H2S and HS− production. Radiolysis of H2S is known to produce considerable elemental sulfur, as does radiolysis of cystine.16
Reaction (R5) is governed by pKa = 4.85,122 producing 0.42 and 0.58 fractions of HO2• and O2•−, respectively, in aerobic pH 5 buffer. However, neither hydroperoxyl nor superoxide reacts rapidly with cysteine at pH 5123
| (R4) |
| (R5) |
The presence and influence of Reactions (R4) and (R5) in aerobic solution represent the only major difference in prompt chemistry relative to anaerobic radiolysis. The air-saturated [O2]0 ≈ 284 μM (at 20 °C) equates to 4.1 × 10¹⁶ molecules of O2 per 0.24 ml, or about 340× the per-second production of HO• (1.2 × 10¹⁴ s−1).124 From Table VI, and H• can produce about 222/950 times faster than their loss to HO−/H2O through recombination with HO•.125 Therefore, in aerobic solution, it seems likely that dissolved O2 has captured much of the H• and , thereby limiting reactions (R2a), (R2c), and (R2d) and the production of cystine by those routes.
In each scan, the total X-ray photon flux has produced a cumulative 87 μM of H• and 682 μM of . Thus, Reaction (R4) should have converted all of the 284 μM of dissolved O2 into during the first scan. Had Reaction (R4) been terminal, the initially aerobic solution would have become effectively anaerobic at the beginning of scan 2.15,126 In that case, Reaction (R4) would have ceased removing H• and , and these would have become available again to react with cysteine. The production of cystine would then resemble that of the anaerobic experiment. Nevertheless, Fig. 3 and Fig. S2 show that this eventuality did not happen. Therefore, a reaction that restored and recycled O2 into the continual removal of H• and must be inferred. A further role in the suppression of cystine is also inferred. The following reaction is one possibility:
| (R6) |
Here, Reaction (R6) cycles dissolved oxygen and quenches the thiyl product of Reaction (R2b). In support of this idea, the pH 7 one-electron redox potential of Cys–S• + . + H+ → Cys–SH, E0′ ≈ 0.9 V.127–129 This emf becomes about 1 V at pH 5, relative to −0.18 V for → O2 + , and −0.20 V for HO2 → O2 + + H+.130,129,131 Thus, Reaction (R6) is highly thermodynamically favored at pH 5. Reaction (R6) combined with Reaction (R4) constitutes a cycle that can restore and recycle dissolved O2. This cycle is illustrated in Scheme 2.
SCHEME 2.

Proposed radiolytic reaction cycle that restores l-cysteine in air saturated solution.
If Scheme 2 is operative, the dioxygen cycle will continuously quench Cys–S•, thereby reconstituting cysteine and thus suppressing cystine production. It is only required that the overall rate of Reaction (R6) be significantly greater than the dimerization of cysteine thiyl to cystine. This requirement is likely to be met because by about 6 min into scan 1, [] ≈ 284 mM ≫ [Cys–S•]. It is proposed that, taken together, Reaction (R4) through Reaction (R6) constitute a cycle during radiolysis that can reduce the production of cystine while retaining an effective concentration of dissolved oxygen across multiple scans. This mechanism could account for the counter-intuitive observation that dissolved oxygen diminished the radiolytic oxidation of aqueous l-cysteine.
The rate constants of the or reaction with Cys–S• are apparently unknown. However, by way of illustrative comparison, reductive electron transfer from to radicals (E0 = 0.936 V) or photo-excited [Ru(bipy)3]2+* proceed with rates of 3 × 10⁹ l mol−1 s−1 and 1.3 × 10¹⁰ l mol−1 s−1, respectively. These rates are similar to the rate of reaction of with HO• itself (Table VI).132,133 Thus, the rate of reaction (R6) is likely to be sufficient to support the inference.
Reaction (R6) is evidently not mentioned in any review or study of the radiolysis of cysteine in aerobic solution, or any study of the reactivity of thiyl radicals.109,127,128,130,134–137 Its significance is therefore unknown but is offered here as a reasonable hypothesis that explains the present results. The relative lack of sulfoxide products in the aerobic radiolysis (Fig. 7) indicates that the reductive electron transfer from to cysteine thiyl also predominates over reactive coupling of thiyl with to produce Cys–S–O–OH. Additionally, the radical Ala• has an α-carbon redox potential of about 1 V.138,139 This radical can also oxidize both and back to O2.
Within the anaerobic radiolysis, several unique minor radiolysis products were found in the fits to the late XAS spectra, shown in Figs. S9 and S10 of the supplementary material. Similar to the major products, these products also exhibited a reactive break at scan 13. The sulfoxide groups can be envisioned as oxidation products from the action of HO•. Hydrogen peroxide reaches a limiting concentration of about 200 μM during radiolysis of water, including under anaerobic conditions.119,140 Although H2O2 does not react with cysteine, it reacts with thiyl radicals and sulfenic acids to produce sulfoxide products. The oxidation of sulfur proceeds all the way to sulfonic acids.15,141
However, the thiamine and Me3S+ models among the product fractions imply complex secondary chemistry. 4-Thiazolidinecarboxylic acid was reported as a product of cysteine irradiation with 257.3 nm UV radiation.10 Electron beam irradiation of cysteine produced carbon disulfide and mercaptomethane, while similar irradiation of cystine produced acetone and acetaldehyde.142 These reactive molecules may enter a reaction channel resulting in a thiazole or a sulfonium product. Thermal degradation of aqueous cysteine or cystine produced multiple thiazoles, in one case amounting to about 18% of the products.143,144
Finally, a low-valent form of sulfur appeared during the early stage of anaerobic radiolysis, which was fit with an epi-sulfide XAS model (see the inset of Fig. S10 of the supplementary material). This low-valent sulfur appeared immediately and then declined to zero by scan 15. Its production was thus evidently restricted to the solution phase and was first thought to be H2S. However, substitution of the sulfur K-edge XAS spectrum of H2S (pH 4) led to uniformly poorer fits than those that employed the K-edge XAS of ethylene epi-sulfide. The same proved true following tests using the sulfur K-edge XAS of thiourea or of other low-valent sulfur candidates (see Fig. S11 of the supplementary material and the associated discussion). Although it is difficult to imagine how an epi-sulfide product could form during radiolysis, propylene-epi-sulfide (methyl thiirane) was reported among the products of electron-beam irradiation of methionine methyl ester and of the Met-Ala dimer.145,146 Thus, the epi-sulfide identity remains tentative. Nevertheless, an unusual low-valent sulfur product of l-cysteine radiolysis appears to be indicated.
When 40% glycerol is also present, the following reaction removes HO• almost entirely:80
| (R7) |
Reaction (R7) proceeds with a nearly diffusion controlled rate of 2 × 10⁹M−1 s−1,68 which is about 100× faster than the 2 × 10⁷M−1 s−1 rate of glycerol reaction with hydrogen atoms.78,81 Thus, the added glycerol removes HO• and thereby ensures the dominance of H• chemistry with solutes. This chemistry explains the enhanced X-ray photon-induced reduction of metalloproteins when glycerol or glycol cryo-protectants are included in synchrotron XAS experiments.31,147 Glyceraldehyde or dihydroxyacetone is the final product of glycerol oxidation by HO•.
It is worth noting again that cystine production was greater when glycerol was present to diminish [HO•], implying that HO• is not responsible for much of the cystine production in aerobic radiolysis of dissolved cysteine.
Differences between the aerobic and anaerobic radiological experiments also include the precipitated phase of the anaerobic experiment. The precipitated solid appeared amorphous, comprising a hydrous mixture of citrate plus residual l-cysteine and all the radiolysis products. This mixture provided the reaction environment for the surprising late disappearance of elemental sulfur, the concomitant enhanced production of cystine (or a spectroscopically similar alkyl disulfide), and the absence of a thioether product. In contrast, the direct radiolysis of solid l-cysteine itself (Fig. 2) did produce a thioether, but did not evidence consumption of elemental sulfur. Therefore, a secondary reactivity is implicated in the evaporate that was not present in crystalline l-cysteine. Any production of disulfide at the expense of S8 must have involved Ala•.
In summary, this work represents the first XAS spectroscopic inventory of sulfur products resulting from the synchrotron K-edge X-radiolysis of l-cysteine, both in the solid state and in anaerobic and aerobic solutions; the latter in the absence or presence of glycerol. Cystine formation is suppressed by both glycerol and dissolved oxygen, implying radiolytic H• as the source of this product by way of the reaction Cys–SH + H• → Cys–S• + H2 (and possibly Cys–SH + Ala• → Cys–S• + AlaH). The unexpected suppression of cystine production in air-saturated solution has required the hypothesis of a new reaction cycle that both quenches thiyl radicals and interconverts HO2•/O2•− with dissolved O2.
SUPPLEMENTARY MATERIAL
See supplementary material for XAS resolution of minor fractions. Sequential XAS scans of cysteine under various conditions: aerobic pH 5 (late appearing), pH 7, and pH 9, and anaerobic pH 5 solutions. Correlation of anaerobic [cysteine] and [cystine]. The possibility of H2S loss. Various tests with discussion of fit quality and reliability.
ACKNOWLEDGMENTS
This work was supported by Grant No. P41GM103393 (K.O.H.). Use of the Stanford Synchrotron Radiation Lightsource, SLAC National Accelerator Laboratory, was supported by the U.S. Department of Energy, Office of Science, Office of Basic Energy Sciences under Contract No. DE-AC02-76SF00515. The SSRL Structural Molecular Biology Program was supported by the DOE Office of Biological and Environmental Research and by the National Institutes of Health, National Institute of General Medical Sciences (including P41GM103393). The contents of this publication are solely the responsibility of the authors and do not necessarily represent the official views of NIGMS or NIH.
Contributor Information
Patrick Frank, Email: .
Ritimukta Sarangi, Email: .
Britt Hedman, Email: .
Keith O. Hodgson, Email: .
REFERENCES
- 1.Badash L., “The discovery of radioactivity,” Physics Today 49(2), 21–26 (1996). 10.1063/1.881485 [DOI] [Google Scholar]
- 2.Walton H. F., “The Curie-Becquerel story,” J. Chem. Educ. 69, 10–15 (1992). 10.1021/ed069p10 [DOI] [Google Scholar]
- 3.Stannard J. N. and Baalman R. W. J., Radioactivity and Health: A History (Pacific Northwest Laboratory, Richland, WA, 1988), DOE/RL/01830-T59, DE88013791. [Google Scholar]
- 4.Mozumder A., “Radiation chemistry: Background, current status and outlook,” J. Phys. Chem. Lett. 2, 2994–2995 (2011). 10.1021/jz2012758 [DOI] [Google Scholar]
- 5.Garrett B. C., Dixon D. A., Camaioni D. M., Chipman D. M., Johnson M. A., Jonah C. D., Kimmel G. A., Miller J. H., Rescigno T. N., Rossky P. J., Xantheas S. S., Colson S. D., Laufer A. H., Ray D., Barbara P. F., Bartels D. M., Becker K. H., Bowen K. H., Bradforth S. E., Carmichael I., Coe J. V., Corrales L. R., Cowin J. P., Dupuis M., Eisenthal K. B., Franz J. A., Gutowski M. S., Jordan K. D., Kay B. D., LaVerne J. A., Lymar S. V., Madey T. E., McCurdy C. W., Meisel D., Mukamel S., Nilsson A. R., Orlando T. M., Petrik N. G., Pimblott S. M., Rustad J. R., Schenter G. K., Singer S. J., Tokmakoff A., Wang L.-S., and Zwier T. S., “Role of water in electron-initiated processes and radical chemistry: Issues and scientific advances,” Chem. Rev. 105, 355–390 (2005). 10.1021/cr030453x [DOI] [PubMed] [Google Scholar]
- 6.Chorzempa M. A., Ionizing Radiation and its Chemical Effects: A Historical Study of Chemical Dosimetry (1902-1962) (Oregon State University, Eugene, OR, 1971). [Google Scholar]
- 7.Fricke H. and Morse S., “The chemical action of Roengten rays on dilute ferrosulphate solutions as a measure of dose,” Am. J. Roentgenol. Radium Ther. 18, 430–432 (1927). [Google Scholar]
- 8.Fricke H. and Morse S., “XIII. The action of X-rays on ferrous sulphate solutions,” London, Edinburgh, Dublin Philos. Magaz. J. Sci. 7, 129–141 (1929). 10.1080/14786440108564721 [DOI] [Google Scholar]
- 9.Fricke H., “The chemical-physical foundations for the biological effects of X-rays,” Cold Spring Harbor Symp. Quant. Biol. 2, 241–248 (1934). 10.1101/sqb.1934.002.01.030 [DOI] [Google Scholar]
- 10.Forbes W. F. and Savige W. E., “Photolysis and photo-oxidation of amino acids and peptides—II. Photo-degradation of cysteine and related amino acids,” Photochem. Photobiol. 1, 77–89 (1962). 10.1111/j.1751-1097.1962.tb08080.x [DOI] [Google Scholar]
- 11.Barron E. S. G., “The role of free radicals and oxygen in reactions produced by ionizing radiations,” Radiat. Res. 1, 109–124 (1954). 10.2307/3570183 [DOI] [PubMed] [Google Scholar]
- 12.Dale W. M. and Davies J. V., “The liberation of hydrogen sulphide by X-radiation from cysteine and glutathione,” Biochem. J. 48, 129–132 (1951). 10.1042/bj0480129 [DOI] [PMC free article] [PubMed] [Google Scholar]
- 13.Dale W. M., Gray L. H., and Meredith W. J., “The inactivation of an enzyme (carboxypeptidase) by X- and α-radiation,” Philos. Trans. R. Soc. London Ser. A: Math. Phys. Sci. 242, 33–62 (1949). 10.1098/rsta.1949.0004 [DOI] [Google Scholar]
- 14.Littman F. E., Carr E. M., and Brady A. P., “The action of atomic hydrogen on aqueous solutions: I. Effect on silver, cysteine, and glutathione solutions,” Radiat. Res. 7, 107–119 (1957). 10.2307/3570457 [DOI] [PubMed] [Google Scholar]
- 15.Shapiro B. and Eldjarn L., “The mechanism for the degradation of cystamine by ionizing radiation,” Radiat. Res. 3, 393–399 (1955). 10.2307/3570165 [DOI] [PubMed] [Google Scholar]
- 16.Markakis P. and Tappel A. L., “Products of γ-irradiation of cysteine and cystine,” J. Am. Chem. Soc. 82, 1613–1617 (1960). 10.1021/ja01492a025 [DOI] [Google Scholar]
- 17.Al-Thannon A., Peterson R. M., and Trumbore C. N., “Aqueous radiation chemistry of cysteine. I. Deaerated acidic solutions,” J. Phys. Chem. 72, 2395–2400 (1968). 10.1021/j100853a020 [DOI] [PubMed] [Google Scholar]
- 18.Al-Thannon A. A., Barton J. P., Packer J. E., Sims R. J., Trumbore C. N., and Winchester R. V., “The radiolysis of aqueous solutions of cysteine in the presence of oxygen,” Intl. J. Radiat. Phys. Chem. 6, 233–248 (1974). 10.1016/0020-7055(74)90024-2 [DOI] [Google Scholar]
- 19.Wilkening V. G., Lal M., Arends M., and Armstrong D. A., “The γ-radiolysis of cysteine in deaerated 1 N HClO4 solutions,” Can. J. Chem. 45, 1209–1214 (1967). 10.1139/v67-200 [DOI] [PubMed] [Google Scholar]
- 20.Wilkening V. G., Lal M., Arends M., and Armstrong D. A., “Cobalt-60 .gamma. radiolysis of cysteine in deaerated aqueous solutions at pH values between 5 and 6,” J. Phys. Chem. 72, 185–190 (1968). 10.1021/j100847a035 [DOI] [PubMed] [Google Scholar]
- 21.Cataldo F., Ragni P., Iglesias-Groth S., and Manchado A., “Solid state radiolysis of sulphur-containing amino acids: Cysteine, cystine and methionine,” J. Radioanal. Nucl. Chem. 287, 573–580 (2011). 10.1007/s10967-010-0787-y [DOI] [Google Scholar]
- 22.Ke Z., Huang Q., Dang B., Lu Y., Yuan H., Zhang S., and Yu Z., “A study of low-energy ion induced radiolysis of thiol-containing amino acid cysteine in the solid and aqueous solution states,” Nucl. Instrum. Methods Phys. Res., Sect. B 268, 2729–2734 (2010). 10.1016/j.nimb.2010.06.017 [DOI] [Google Scholar]
- 23.Peterson D. B., Holian J., and Garrison W. M., “Radiation chemistry of the α-amino acids. γ radiolysis of solid cysteine,” J. Phys. Chem. 73, 1568–1572 (1969). 10.1021/j100725a065 [DOI] [PubMed] [Google Scholar]
- 24.Allen A. O., “The yields of free H and OH in the irradiation of water,” Radiat. Res. 1, 85–96 (1954). 10.2307/3570181 [DOI] [PubMed] [Google Scholar]
- 25.Madden K. P. and Mezyk S. P., “Critical review of aqueous solution reaction rate constants for hydrogen atoms,” J. Phys. Chem. Ref. Data 40, 023103 (2011). 10.1063/1.3578343 [DOI] [Google Scholar]
- 26.LaVerne J. A., “OH radicals and oxidizing products in the gamma radiolysis of water,” Radiat. Res. 153, 196–200 (2000). 10.1667/0033-7587(2000)153[0196:oraopi]2.0.co;2 [DOI] [PubMed] [Google Scholar]
- 27.Ferradini C. and Jay-Gerin J.-P., “The effect of pH on water radiolysis: A still open question—A minireview,” Res. Chem. Intermed. 26, 549–565 (2000). 10.1163/156856700x00525 [DOI] [Google Scholar]
- 28.Jonah C. D., Matheson M. S., Miller J. R., and Hart E. J., “Yield and decay of the hydrated electron from 100 ps to 3 ns,” J. Phys. Chem. 80, 1267–1270 (1976). 10.1021/j100553a001 [DOI] [Google Scholar]
- 29.George G. N., Pickering I. J., Pushie M. J., Nienaber K., Hackett M. J., Ascone I., Hedman B., Hodgson K. O., Aitken J. B., Levina A., Glover C., and Lay P. A., “X-ray-induced photo-chemistry and X-ray absorption spectroscopy of biological samples,” J. Synchroton Radiat. 19, 875–886 (2012). 10.1107/s090904951203943x [DOI] [PMC free article] [PubMed] [Google Scholar]
- 30.George S. J., Fu J., Guo Y., Drury O. B., Friedrich S., Rauchfuss T., Volkers P. I., Peters J. C., Scott V., Brown S. D., Thomas C. M., and Cramer S. P., “X-ray photochemistry in iron complexes from Fe(0) to Fe(IV)—Can a bug become a feature?,” Inorg. Chim. Acta 361, 1157–1165 (2008). 10.1016/j.ica.2007.10.039 [DOI] [Google Scholar]
- 31.Meents A., Gutmann S., Wagner A., and Schulze-Briese C., “Origin and temperature dependence of radiation damage in biological samples at cryogenic temperatures,” Proc. Natl. Acad. Sci. U. S. A. 107, 1094–1099 (2010). 10.1073/pnas.0905481107 [DOI] [PMC free article] [PubMed] [Google Scholar]
- 32.Maleknia S. D., Brenowitz M., and Chance M. R., “Millisecond radiolytic modification of peptides by synchrotron X-rays identified by mass spectrometry,” Anal. Chem. 71, 3965–3973 (1999). 10.1021/ac990500e [DOI] [PubMed] [Google Scholar]
- 33.Maleknia S. D. and Downard K. M., “Advances in radical probe mass spectrometry for protein footprinting in chemical biology applications,” Chem. Soc. Rev. 43, 3244–3258 (2014). 10.1039/C3CS60432B [DOI] [PubMed] [Google Scholar]
- 34.Xu G. and Chance M. R., “Radiolytic modification of sulfur-containing amino acid residues in model peptides: Fundamental studies for protein footprinting,” Anal. Chem. 77, 2437–2449 (2005). 10.1021/ac0484629 [DOI] [PubMed] [Google Scholar]
- 35.Yamada H., Kobayashi K., and Hieda K., “Effects of the K-shell X-ray absorption of phosphorus on the scission of the pentadeoxythymidylic acid,” Int. J. Radiat. Biol. 63, 151–159 (1993). 10.1080/09553009314550201 [DOI] [PubMed] [Google Scholar]
- 36.Yokoya A. and Ito T., “Photon-induced Auger effect in biological systems: A review,” Int. J. Radiat. Biol. 93, 743–756 (2017). 10.1080/09553002.2017.1312670 [DOI] [PubMed] [Google Scholar]
- 37.Sneeden E. Y., Hackett M. J., Cotelesage J. J. H., Prince R. C., Barney M., Goto K., Block E., Pickering I. J., and George G. N., “Photochemically generated thiyl free radicals observed by X-ray absorption spectroscopy,” J. Am. Chem. Soc. 139, 11519–11526 (2017). 10.1021/jacs.7b05116 [DOI] [PubMed] [Google Scholar]
- 38.Sarangi R., Frank P., Benfatto M., Morante S., Minicozzi V., Hedman B., and Hodgson K. O., “The x-ray absorption spectroscopy model of solvation about sulfur in aqueous L-cysteine,” J. Chem. Phys. 137, 205103–205113 (2012). 10.1063/1.4767350 [DOI] [PMC free article] [PubMed] [Google Scholar]
- 39.Lavine T. F., “The iodometric determination of cysteine,” J. Biol. Chem. 109, 141–145 (1935). [Google Scholar]
- 40.Srivastava A., “Improvement of the iodometric determination of cysteine,” Fresenius’ Z. Anal. Chem. 287, 316 (1977). 10.1007/bf00634511 [DOI] [Google Scholar]
- 41.Lal M., “Radiation induced oxidation of sulphydryl molecules in aqueous solutions. A comprehensive review,” Radiat. Phys. Chem. 43, 595–611 (1994). 10.1016/0969-806X(94)90174-0 [DOI] [Google Scholar]
- 42.Puigdomenech I. M., Chemical Equilibrium Software, https://sites.google.com/site/chemdiagr/, 16 July 2013.
- 43.Albert A., “Quantitative studies of the avidity of naturally occurring substances for trace metals: 2. Amino acids having three ionizing groups,” Biochem. J. 50, 690–697 (1952). 10.1042/bj0500690 [DOI] [PMC free article] [PubMed] [Google Scholar]
- 44.Benesch R. E. and Benesch R., “The acid strength of the -SH group in cysteine and related compounds,” J. Am. Chem. Soc. 77, 5877–5881 (1955). 10.1021/ja01627a030 [DOI] [Google Scholar]
- 45.Frank P., Caruso F., and Caponetti E., “Ancient wood of the Acqualadrone rostrum: Materials history through gas chromatography/mass spectrometry and sulfur X-ray absorption spectroscopy,” Anal. Chem. 84, 4419–4428 (2012). 10.1021/ac3001258 [DOI] [PMC free article] [PubMed] [Google Scholar]
- 46.Frank P., DeBeer George S., Anxolabéhère-Mallart E., Hedman B., and Hodgson K. O., “A systematic resolution of sulfur in reticulated vitreous carbon using X-ray absorption spectroscopy,” Inorg. Chem. 45, 9864–9876 (2006). 10.1021/ic0610637 [DOI] [PubMed] [Google Scholar]
- 47.Tenderholt A., Hedman B., and Hodgson K. O., “PySpline: A modern, cross-platform program for the processing of raw averaged XAS edge and EXAFS data,” in X-Ray Absorption Fine Structure—XAFS13, edited by Hedman B. and Pianetta P. (American Institute of Physics; Stanford University, 2007), pp. 105–107. [Google Scholar]
- 48.Frank P., Hedman B., and Hodgson K. O., “XAS spectroscopy, sulfur, and the brew within blood cells from Ascidia ceratodes,” J. Inorg. Biochem. 131, 99–108 (2014). 10.1016/j.jinorgbio.2013.11.004 [DOI] [PMC free article] [PubMed] [Google Scholar]
- 49.Sarangi R., Frank P., Hodgson K. O., and Hedman B., “When identical functional groups are not identical: A DFT study of the effects of molecular environment on sulfur K-edge X-ray absorption spectra,” Inorg. Chim. Acta 361, 956–964 (2008). 10.1016/j.ica.2007.05.047 [DOI] [Google Scholar]
- 50.Frank P., Hedman B., Carlson R. M. K., Tyson T. A., Roe A. L., and Hodgson K. O., “A large reservoir of sulfate and sulfonate resides within plasma cells from Ascidia ceratodes, revealed by X-ray absorption near-edge structure spectroscopy,” Biochemistry 26, 4975–4979 (1987). 10.1021/bi00390a014 [DOI] [PubMed] [Google Scholar]
- 51.George G. N. and Gorbaty M. L., “Sulfur K-edge X-ray absorption-spectroscopy of petroleum asphaltenes and models,” J. Am. Chem. Soc. 111, 3182–3186 (1989). 10.1021/ja00191a012 [DOI] [Google Scholar]
- 52.Hedman B., Frank P., Penner-Hahn J. E., Roe A. L., Hodgson K. O., Carlson R. M. K., Brown G., Cerino J., Hettel R., Troxel T., Winick H., and Yang J., “Sulfur K-edge X-ray absorption studies using the 54-pole wiggler at SSRL in undulator mode,” Nucl. Instrum. Methods Phys. Res., Sect. A 246, 797–800 (1986). 10.1016/0168-9002(86)90196-8 [DOI] [Google Scholar]
- 53.Foster J. S. and Horton C. A., “Quantitative spectrographic analysis of biological material–II,” Proc. R. Soc. London, Ser. B: Biol. Sci. 123, 422–430 (1937). 10.1098/rspb.1937.0060 [DOI] [Google Scholar]
- 54.Foster J. S., Langstroth G. O., and McRae D. R., “Quantitative spectrographic analysis of biological material. I. A method for the determination of lead in cerebrospinal fluid,” Proc. R. Soc. London, Ser. A: Math. Phys. Sci. 153, 141–152 (1935). 10.1098/rspa.1935.0226 [DOI] [Google Scholar]
- 55.Welz B., “Abuse of the analyte addition technique in atomic absorption spectrometry,” Fresenius’ Z. Anal. Chem. 325, 95–101 (1986). 10.1007/bf00983409 [DOI] [Google Scholar]
- 56.Bunker G., “Estimating photon flux from ion chamber currents,” in Introduction to EXAFS: A Practical Guide to X-Ray Absorption Fine Structure Spectroscopy, edited by Bunker G. (Cambridge University, Cambridge, 2010), p. 260. [Google Scholar]
- 57.Wedlund C. S., Gronoff G., Lilensten J., Ménager H., and Barthélemy M., “Comprehensive calculation of the energy per ion pair or W values for five major planetary upper atmospheres,” Ann. Geophys. 29, 187–195 (2011). 10.5194/angeo-29-187-2011 [DOI] [Google Scholar]
- 58.Henke B. L., Gullikson E. M., and Davis J. C., “X-ray interactions: Photoabsorption, scattering, transmission, and reflection at E = 50-30000 eV, Z = 1-92,” At. Data Nucl. Data Tables 54, 181–342 (1993). 10.1006/adnd.1993.1013 [DOI] [Google Scholar]
- 59.Pickering I. J., George G. N., Yu E. Y., Brune D. C., Tuschak C., Overmann J., Beatty J. T., and Prince R. C., “Analysis of sulfur biochemistry of sulfur bacteria using X-ray absorption spectroscopy,” Biochemistry 40, 8138–8145 (2001). 10.1021/bi0105532 [DOI] [PubMed] [Google Scholar]
- 60.Castillo-Michel H. A., Diaz-Sanchez A. G., Martinez-Martinez A., and Hesse B., “Investigations of sulfur chemical status with synchrotron micro focused X-ray fluorescence and X-ray absorption spectroscopy,” Protein Peptide Lett. 23, 291–299 (2016). 10.2174/0929866523666160108120117 [DOI] [PubMed] [Google Scholar]
- 61.Nauser T., Koppenol W. H., and Schöneich C., “Reversible hydrogen transfer reactions in thiyl radicals from cysteine and related molecules: Absolute kinetics and equilibrium constants determined by pulse radiolysis,” J. Phys. Chem. B 116, 5329–5341 (2012). 10.1021/jp210954v [DOI] [PMC free article] [PubMed] [Google Scholar]
- 62.Lal M., “60Co-Gamma radiolysis of cysteine in aerated solutions at pH 5.5-6.0,” Radiat. Effects 22, 237–242 (1974). 10.1080/10420157408230800 [DOI] [Google Scholar]
- 63.Myron J. J. J. and Johnsen R. H., “The radiolysis of ethyl mercaptan,” J. Phys. Chem. 70, 2951–2955 (1966). 10.1021/j100881a039 [DOI] [Google Scholar]
- 64.Sarangi R., DeBeer George S., Rudd D. J., Szilagyi R. K., Ribas X., Rovira C., Almeida M., Hodgson K. O., Hedman B., and Solomon E. I., “Sulfur K-edge X-ray absorption spectroscopy as a probe of ligand-metal bond covalency: Metal vs ligand oxidation in copper and nickel dithiolene complexes,” J. Am. Chem. Soc. 129, 2316–2326 (2007). 10.1021/ja0665949S0002-7863(06)06594-2 [DOI] [PMC free article] [PubMed] [Google Scholar]
- 65.Waldo G. S., Carlson R. M. K., Moldowan J. M., Peters K. E., and Penner-Hahn J. E., “Sulfur speciation in heavy petroleums: Information from X-ray absorption near-edge structure,” Geochim. Cosmochim. Acta 55, 801–814 (1991). 10.1016/0016-7037(91)90343-4 [DOI] [Google Scholar]
- 66.Yamaguchi H., Uchihori Y., Yasuda N., Takada M., and Kitamura H., “Estimation of yields of OH radicals in water irradiated by ionizing radiation,” J. Radiat. Res. 46, 333–341 (2005). 10.1269/jrr.46.333 [DOI] [PubMed] [Google Scholar]
- 67.Agarwal A., “Introduction to radiation chemistry,” in Simulation Studies of Recombination Kinetics and Spin Dynamics in Radiation Chemistry (Springer International Publishing, Cham, 2014), pp. 1–21. [Google Scholar]
- 68.Buxton G. V., Greenstock C. L., Helman W. P., and Ross A. B., “Critical review of rate constants for reactions of hydrated electrons, hydrogen atoms and hydroxyl radicals (OH/O−) in aqueous solution,” J. Phys. Chem. Ref. Data 17, 513–886 (1988). 10.1063/1.555805 [DOI] [Google Scholar]
- 69.Armstrong D. A. and Wilkening V. G., “Effects of pH in the γ-radiolysis of aqueous solutions of cysteine and methyl mercaptan,” Can. J. Chem. 42, 2631–2635 (1964). 10.1139/v64-389 [DOI] [Google Scholar]
- 70.Garrison W. M., “Reaction mechanisms in the radiolysis of peptides, polypeptides, and proteins,” Chem. Rev. 87, 381–398 (1987). 10.1021/cr00078a006 [DOI] [Google Scholar]
- 71.Barton J. P. and Packer J. E., “The radiolysis of oxygenated cysteine solutions at neutral pH. The role of RSSR and O2−,” Int. J. Radiat. Phys. Chem. 2, 159–166 (1970). 10.1016/0020-7055(70)90029-X [DOI] [Google Scholar]
- 72.Blanksby S. J. and Ellison G. B., “Bond dissociation energies of organic molecules,” Acct. Chem. Res. 36, 255–263 (2003). 10.1021/ar020230d [DOI] [PubMed] [Google Scholar]
- 73.Elliot A. J., Chenier M. P., and Ouellette D. C., “g-Values for γ-irradiated water as a function of temperature,” Can. J. Chem. 68, 712–719 (1990). 10.1139/v90-111 [DOI] [Google Scholar]
- 74.Kreipl M. S., Friedland W., and Paretzke H. G., “Time- and space-resolved Monte Carlo study of water radiolysis for photon, electron and ion irradiation,” Radiat. Environ. Biophys. 48, 11 (2009). 10.1007/s00411-008-0194-8 [DOI] [PubMed] [Google Scholar]
- 75.Watanabe R. and Saito K., “Monte Carlo simulation of water radiolysis in oxygenated condition for monoenergetic electrons from 100 eV to 1 MeV,” Radiat. Phys. Chem. 62, 217–228 (2001). 10.1016/S0969-806X(01)00195-5 [DOI] [Google Scholar]
- 76.Uehara S. and Nikjoo H., “Monte Carlo simulation of water radiolysis for low-energy charged particles,” J. Radiat. Res. 47, 69–81 (2006). 10.1269/jrr.47.69 [DOI] [PubMed] [Google Scholar]
- 77.Bagiyan G. A., Koroleva I. K., Soroka N. V., and Ufimtsev A. V., “Oxidation of thiol compounds by molecular oxygen in aqueous solutions,” Russ. Chem. Bull. 52, 1135–1141 (2003). 10.1023/a:1024761324710 [DOI] [Google Scholar]
- 78.Anbar M. and Neta P., “A compilation of specific bimolecular rate constants for the reactions of hydrated electrons, hydrogen atoms and hydroxyl radicals with inorganic and organic compounds in aqueous solution,” Int. J. Appl. Radiat. Isotopes 18, 493–523 (1967). 10.1016/0020-708X(67)90115-9 [DOI] [Google Scholar]
- 79.Witcher S. L., Rotheram M., and Todd N., “Radiation chemistry of cysteine solutions,” Nucleonics 11, 30–33 (1953). [Google Scholar]
- 80.Laurie V. F. and Waterhouse A. L., “Oxidation of glycerol in the presence of hydrogen peroxide and iron in model solutions and wine. Potential effects on wine color,” J. Agric. Food Chem. 54, 4668–4673 (2006). 10.1021/jf053036p [DOI] [PubMed] [Google Scholar]
- 81.Neta P. and Schuler R. H., “Rate constants for reaction of hydrogen atoms with compounds of biochemical interest,” Radiat. Res. 47, 612–627 (1971). 10.2307/3573354 [DOI] [Google Scholar]
- 82.Sakakibara A., “Hydrogenolysis,” in Methods in Lignin Chemistry, edited by Lin S. Y. and Dence C. W. (Springer Berlin Heidelberg, Berlin, Heidelberg, 1992), pp. 350–368. [Google Scholar]
- 83.Shriver D. F. and Drezdzon M. A., The Manipulation of Air-Sensitive Compounds, 2nd ed. (John Wiley and Sons, New York, 1986). [Google Scholar]
- 84.Wypych G., “PP polypropylene,” in Handbook of Polymers, edited by Wypych G. (Elsevier, Oxford, 2012), pp. 479–486. [Google Scholar]
- 85.Yasuda H., “Units of gas permeability constants,” J. Appl. Polymer Sci. 19, 2529–2538 (1975). 10.1002/app.1975.070190915 [DOI] [Google Scholar]
- 86.Witala M., Han J., Menzel A., and Nygard K., “In situ small-angle X-ray scattering characterization of X-ray-induced local heating,” J. Appl. Crystallogr. 47, 2078–2080 (2014). 10.1107/S1600576714020159 [DOI] [Google Scholar]
- 87.Frank P. and Hodgson K. O., “Defining chemical species in complex environments using K-edge X-ray absorption spectroscopy: Vanadium in intact blood cells and Henze solution from the tunicate,” Ascidia ceratodes. Inorg. Chem. 39, 6018–6027 (2000). 10.1021/ic000546m [DOI] [PubMed] [Google Scholar]
- 88.George G. N., Gorbaty M. L., Kelemen S. R., and Sansone M., “Direct determination and quantification of sulfur forms in coals from the Argonne premium sample program,” Energy Fuels 5, 93–97 (1991). 10.1021/ef00025a016 [DOI] [Google Scholar]
- 89.Baba Y., Sekiguchi T., and Shimoyama I., “Fragment-ion desorption from sulfur-containing amino acids by localized core-level excitation,” Surf. Rev. Lett. 09, 77–83 (2002). 10.1142/s0218625x02002130 [DOI] [Google Scholar]
- 90.Yokoya A., Kobayashi K., Usami N., and Ishizaka S., “Radiolytic degradation of cystathionine irradiated with monochromatic soft X-rays at the K-shell resonance absorption of sulfur,” J. Radiat. Res. 32, 215–223 (1991). 10.1269/jrr.32.215 [DOI] [PubMed] [Google Scholar]
- 91.Halpern A. and Stöcklin G., “A radiation chemical resonance effect in solid 5-bromodeoxyuridine; chemical consequences of the Auger effect,” Radiat. Res. 58, 329–337 (1974). 10.2307/3573903 [DOI] [Google Scholar]
- 92.Takakura K., “Auger effects on bromo-deoxyuridine-monophosphate irradiated with monochromatic X-rays around bromine K-absorption edge,” Rad. Environ. Biophys. 28, 177–184 (1989). 10.1007/bf01211254 [DOI] [PubMed] [Google Scholar]
- 93.El-Hussieny M. D., Lothar S., and Bodo D., “Chemical consequences of the Auger effect: Iodine yield from iodoamino acids as a function of X-ray dose and energy,” Radiat. Res. 44, 273–281 (1970). 10.2307/3573190 [DOI] [PubMed] [Google Scholar]
- 94.Furusawa Y., Maezawa H., Takakura K., Kobayashi K., and Hieda K., “Radiolytic products of bromodeoxyuridine in solids by 60Co γ-rays and monoenergetic soft X-rays at the K-absorption edge of bromine,” Acta Oncol. 35, 877–882 (1996). 10.3109/02841869609104040 [DOI] [PubMed] [Google Scholar]
- 95.Moggach S. A., Clark S. J., and Parsons S., “L-Cysteine-I at 30 K,” Acta Crystallogr. 61, o2739–o2742 (2005). 10.1107/S1600536805023688 [DOI] [Google Scholar]
- 96.Dahaoui S., Pichon-Pesme V., Howard J. A. K., and Lecomte C., “CCD charge density study on crystals with large unit cell parameters: The case of hexagonal L-cystine,” J. Phys. Chem. A 103, 6240–6250 (1999). 10.1021/jp990641k [DOI] [Google Scholar]
- 97.Zubavichus Y., Fuchs O., Weinhardt L., Heske C., Umbach E., Denlinger J. D., and Grunze M., “Soft X-ray-induced decomposition of amino acids: An XPS, mass spectrometry, and NEXAFS study,” Radiat. Res. 161, 346–358 (2004). 10.1667/RR3114.1 [DOI] [PubMed] [Google Scholar]
- 98.Krause M. O. and Oliver H. H., “Natural widths of K and L levels, Kα X-ray lines and several KLL Auger lines,” J. Phys. Chem. Ref. Data 8, 329–338 (1979). 10.1063/1.555595 [DOI] [Google Scholar]
- 99.Chantler C. T., “Theoretical form factor, attenuation, and scattering tabulation for Z = 1–92 from E = 1–10 eV to E = 0.4–1.0 MeV,” J. Phys. Chem. Ref. Data 24, 71–643 (1995). 10.1063/1.555974 [DOI] [Google Scholar]
- 100.Chantler C. T., “Detailed tabulation of atomic form factors, photoelectric absorption and scattering cross section, and mass attenuation coefficients in the vicinity of absorption edges in the soft X-ray (Z = 30–36, Z = 60–89, E = 0.1 keV–10 keV), addressing convergence issues of earlier work,” J. Phys. Chem. Ref. Data 29, 597–1056 (2000). 10.1063/1.1321055 [DOI] [PubMed] [Google Scholar]
- 101.Koningsberger D. C., Mojet B. L., van Dorssen G. E., and Ramaker D. E., “XAFS spectroscopy; fundamental principles and data analysis,” Top. Catal. 10, 143–155 (2000). 10.1023/a:1019105310221 [DOI] [Google Scholar]
- 102.Krause M. O., “Atomic radiative and radiationless yields for K and L shells,” J. Phys. Chem. Ref. Data 8, 307–327 (1979). 10.1063/1.555594 [DOI] [Google Scholar]
- 103.Gorbitz C. H., Dalhus B., and l-Cysteine, “Monoclinic form, redetermination at 120 K,” Acta Cryst. C 52, 1756–1759 (1996). 10.1107/S0108270196003952 [DOI] [Google Scholar]
- 104.Tripolt R., Belaj F., and Nachbaur E., “Eine unerwartet stabile Sulfensäure: 4,6-Dimethoxy-l,3,5-triazin-2-sulfensäure; Synthese, Eigenschaften, Molekül- und Kristallstruktur,” Zeit. Naturforsch. 48b, 1212–1222 (1993). 10.1515/znb-1993-0909 [DOI] [Google Scholar]
- 105.Easteal A. J., Price W. E., and Woolf L. A., “Diaphragm cell for high-temperature diffusion measurements. Tracer diffusion coefficients for water to 363 K,” J. Chem. Soc., Faraday Trans. 1 85, 1091–1097 (1989). 10.1039/F19898501091 [DOI] [Google Scholar]
- 106.Hollas D., Pohl M. N., Seidel R., Aziz E. F., Slavíček P., and Winter B., “Aqueous solution chemistry of ammonium cation in the Auger time window,” Sci. Rep. 7, 756 (2017). 10.1038/s41598-017-00756-x [DOI] [PMC free article] [PubMed] [Google Scholar]
- 107.Freeman F., Adesina I. T., La J. L., Lee J. Y., and Poplawski A. A., “Conformers of cysteine and cysteine sulfenic acid and mechanisms of the reaction of cysteine sulfenic acid with 5,5-Dimethyl-1,3-cyclohexanedione (dimedone),” J. Phys. Chem. B 117, 16000–16012 (2013). 10.1021/jp409022m [DOI] [PubMed] [Google Scholar]
- 108.Abraham R. T., Benson L. M., and Jardine I., “Synthesis and pH-dependent stability of purine-6-sulfenic acid, a putative reactive metabolite of 6-thiopurine,” J. Med. Chem. 26, 1523–1526 (1983). 10.1021/jm00364a031 [DOI] [PubMed] [Google Scholar]
- 109.Purdie J. W., Gillis H. A., and Klassen N. V., “The pulse radiolysis of penicillamine and penicillamine disulfide in aqueous solution,” Can. J. Chem. 51, 3132–3142 (1973). 10.1139/v73-466 [DOI] [Google Scholar]
- 110.Schwarz H. A., “The effect of solutes on the molecular yields in the radiolysis of aqueous solutions,” J. Am. Chem. Soc. 77, 4960–4964 (1955). 10.1021/ja01624a004 [DOI] [Google Scholar]
- 111.Turner J. E., Magee J. L., Wright H. A., Chatterjee A., Hamm R. N., and Ritchie R. H., “Physical and chemical development of electron tracks in liquid water,” Radiat. Res. 96, 437–449 (1983). 10.2307/3576111 [DOI] [Google Scholar]
- 112.Schwarz H. A., “Applications of the spur diffusion model to the radiation chemistry of aqueous solutions,” J. Phys. Chem. 73, 1928–1937 (1969). 10.1021/j100726a047 [DOI] [Google Scholar]
- 113.Draganić I. G., Draganić Z. D., “Interaction of ionizing radiation with water and the origin of short-lived species that cause chemical changes in irradiated water,” in Physical Chemistry, edited by Draganić I. G. and Draganić Z. D. (Elsevier, 1971), Vol. 26, Chap. 2, pp. 23–46. [Google Scholar]
- 114.Mozumder A. and Magee J. L., “Model of tracks of ionizing radiations for radical reaction mechanisms,” Radiat. Res. 28, 203–214 (1966). 10.2307/3572190 [DOI] [PubMed] [Google Scholar]
- 115.Purdie J. W., “γ radiolysis of cystine in aqueous solution. Dose-rate effects and a proposed mechanism,” J. Am. Chem. Soc. 89, 226–230 (1967). 10.1021/ja00978a007 [DOI] [PubMed] [Google Scholar]
- 116.Steenken S., Behrens G., and Schulte-Frohlinde D., “Radiation chemistry of DNA model compounds. Part IV. Phosphate ester cleavage in radicals derived from glycerol phosphates,” Int. J. Radiat. Biol. Relat. Stud. Phys.: Chem. Med. 25, 205–209 (1974). 10.1080/09553007414550231 [DOI] [PubMed] [Google Scholar]
- 117.Samuni A. and Neta P., “Hydroxy radical reaction with phosphate esters and the mechanism of phosphate cleavage,” J. Phys. Chem. 77, 2425–2429 (1973). 10.1021/j100639a012 [DOI] [Google Scholar]
- 118.Sehested K., Corfitzen H., and Fricke H., “Cobalt-60 .gamma.-ray radiolysis of aqueous solutions of H2+O2. Determination of Geaq-+GH at pH 0.46-6.5,” J. Phys. Chem. 74, 211–213 (1970). 10.1021/j100696a041 [DOI] [Google Scholar]
- 119.Joseph J. M., Seon Choi B., Yakabuskie P., and Clara Wren J., “A combined experimental and model analysis on the effect of pH and O2(aq) on γ-radiolytically produced H2 and H2O2,” Radiat. Phys. Chem. 77, 1009–1020 (2008). 10.1016/j.radphyschem.2008.06.001 [DOI] [Google Scholar]
- 120.Mönig J., Asmus K.-D., Forni L. G., and Willson R. L., “On the reaction of molecular oxygen with thiyl radicals: A re-examination,” Int. J. Radiat. Biol. Relat. Stud. Phys.: Chem. Med. 52, 589–602 (1987). 10.1080/09553008714552081 [DOI] [PubMed] [Google Scholar]
- 121.Lefort M., “Radiation chemistry,” Ann. Rev. Phys. Chem. 9, 123–156 (1958). 10.1146/annurev.pc.09.100158.001011 [DOI] [Google Scholar]
- 122.Rao P. S. and Hayon E., “Redox potentials of free radicals. IV. Superoxide and hydroperoxy radicals .O2− and .HO2,” J. Phys. Chem. 79, 397–402 (1975). 10.1021/j100571a021 [DOI] [Google Scholar]
- 123.Bielski B. H. J., Cabelli D. E., Arudi R. L., and Ross A. B., “Reactivity of HO2/ radicals in aqueous solution,” J. Phys. Chem. Ref. Data 14, 1041–1100 (1985). 10.1063/1.555739 [DOI] [Google Scholar]
- 124.Weiss R. F., “The solubility of nitrogen, oxygen and argon in water and seawater,” Deep Sea Res. Oceanogr. Abstr. 17, 721–735 (1970). 10.1016/0011-7471(70)90037-9 [DOI] [Google Scholar]
- 125.Baxendale J. H., “Effects of oxygen and pH in the radiation chemistry of aqueous solutions,” in Basic Mechanisms in the Radiation Chemistry of Aqueous Media (Radiation Research Society, Gatlinburg, TN, 1964), Vol. 4, pp. 114–138. [Google Scholar]
- 126.Hart E. J., “Development of the radiation chemistry of aqueous solutions,” J. Chem. Educ. 36, 266–272 (1959). 10.1021/ed036p266 [DOI] [Google Scholar]
- 127.Wardman P. and von Sonntag C., “Kinetic factors that control the fate of thiyl radicals in cells,” in Methods in Enzymology (Academic Press, 1995), Vol. 251, pp. 31–45. [DOI] [PubMed] [Google Scholar]
- 128.Wardman P., “The fate of glutathione thiyl radicals in biological systems,” Free Radical Biol. Med. 9, 62 (1990). 10.1016/0891-5849(90)90390-5 [DOI] [Google Scholar]
- 129.Surdhar P. and Armstrong D. A., “Redox potentials of some sulfur-containing radicals,” J. Phys. Chem. 90, 5915–5917 (1986). 10.1021/j100280a091 [DOI] [Google Scholar]
- 130.Das T. N., Huie R. E., Neta P., and Padmaja S., “Reduction potential of the sulfhydryl radical: Pulse radiolysis and laser flash photolysis studies of the formation and reactions of ·SH and HSSH−· in a queous solutions,” J. Phys. Chem. A 103, 5221–5226 (1999). 10.1021/jp9907544 [DOI] [Google Scholar]
- 131.Armstrong D. A., Huie R., Lymar V., S., Koppenol W., Merényi G., Neta P., Stanbury M., D., Steenken S., and Wardman P., Standard Electrode Potentials Involving Radicals in Aqueous Solution: Inorganic Radicals (2013), Vol. 9. [Google Scholar]
- 132.Huie R. E. and Neta P., “Kinetics of one-electron transfer reactions involving chlorine dioxide and nitrogen dioxide,” J. Phys. Chem. 90, 1193–1198 (1986). 10.1021/j100278a046 [DOI] [Google Scholar]
- 133.Mulazzani Q. G., D’Angelantonio M., Venturi M., and Rodgers M. A. J., “Oxidation of superoxide radical anion by excited tris(2,-bipyridine)ruthenium(II) ion in acetonitrile: A search for singlet molecular oxygen,” J. Phys. Chem. 95, 9605–9608 (1991). 10.1021/j100176a101 [DOI] [Google Scholar]
- 134.Ross D., and Moldeus P., “Thiyl radicals—Their generation and further reactions,” in Biological Reactive Intermediates III: Mechanisms of Action in Animal Models and Human Disease, edited by Kocsis J. J., Jollow D. J., Witmer C. M., Nelson J. O., and Snyder R. (Springer US, Boston, MA, 1986), pp. 329–335. [DOI] [PubMed] [Google Scholar]
- 135.Włodek L., “Beneficial and harmful effects of thiols,” Pol. J. Pharmacol. 54, 215–223 (2002). [PubMed] [Google Scholar]
- 136.Schöneich C., “Thiyl radicals and induction of protein degradation,” Free Radical Res. 50, 143–149 (2016). 10.3109/10715762.2015.1077385 [DOI] [PMC free article] [PubMed] [Google Scholar]
- 137.Asada K. and Kanematsu S., “Reactivity of thiols with superoxide radicals,” Agric. Biol. Chem. 40, 1891–1892 (1976). 10.1271/bbb1961.40.1891 [DOI] [Google Scholar]
- 138.Diggle J. W. and Parker A. J., “Solvation of ions—XX. The ferrocene—ferrocenium couple and its role in the estimation of free energies of transfer of single ions,” Electrochim. Acta 18, 975–979 (1973). 10.1016/0013-4686(73)87030-6 [DOI] [Google Scholar]
- 139.Masek A., Chrzescijanska E., and Zaborski M., “Estimation of the antioxidative properties of amino acids—An electrochemical approach,” Int. J. Electrochem. 9, 7904–7915 (2014). [Google Scholar]
- 140.Ebert M. and Boag J. W., “The formation and decomposition of H2O2 in aqueous solutions by the action of high energy electrons and X-radiation,” Discuss. Faraday Soc. 12, 189–203 (1952). 10.1039/DF9521200189 [DOI] [Google Scholar]
- 141.van Bergen L. A. H., Roos G., and De Proft F., “From thiol to sulfonic acid: Modeling the oxidation pathway of protein thiols by hydrogen peroxide,” J. Phys. Chem. A 118, 6078–6084 (2014). 10.1021/jp5018339 [DOI] [PubMed] [Google Scholar]
- 142.Ahn D. U., Joo Lee E., Feng X., Zhang W., Lee J. H., Jo C., and Nam K., “Mechanisms of volatile production from sulfur-containing amino acids by irradiation,” Rad. Phys. Chem. 119, 80–84 (2016). 10.1016/j.radphyschem.2015.09.009 [DOI] [Google Scholar]
- 143.Shu C. K., Hagedorn M. L., Mookherjee B. D., and Ho C. T., “Volatile components of the thermal degradation of cystine in water,” J. Agric. Food Chem. 33, 438–442 (1985). 10.1021/jf00063a028 [DOI] [Google Scholar]
- 144.Shu C. K., Hagedorn M. L., Mookherjee B. D., and Ho C. T., “pH Effect on the volatile components in the thermal degradation of cysteine,” J. Agric. Food Chem. 33, 442–446 (1985). 10.1021/jf00063a029 [DOI] [Google Scholar]
- 145.Ahn D. U., “Production of volatiles from amino acid homopolymers by irradiation,” J. Food Sci. 67, 2565–2570 (2002). 10.1111/j.1365-2621.2002.tb08777.x [DOI] [Google Scholar]
- 146.Feng X., Lee E. J., Nam K., Jo C., Ko K., and Ahn D. U., “Mechanisms of volatile production from amino acid esters by irradiation,” Food Res. Int. 81, 100–107 (2016). 10.1016/j.foodres.2016.01.006 [DOI] [Google Scholar]
- 147.Nienaber K. H., Pushie M. J., Cotelesage J. J. H., Pickering I. J., and George G. N., “Cryoprotectants severely exacerbate X-ray-induced photoreduction,” J. Phys. Chem. Lett. 9, 540–544 (2018). 10.1021/acs.jpclett.7b03111 [DOI] [PubMed] [Google Scholar]
Associated Data
This section collects any data citations, data availability statements, or supplementary materials included in this article.
Supplementary Materials
See supplementary material for XAS resolution of minor fractions. Sequential XAS scans of cysteine under various conditions: aerobic pH 5 (late appearing), pH 7, and pH 9, and anaerobic pH 5 solutions. Correlation of anaerobic [cysteine] and [cystine]. The possibility of H2S loss. Various tests with discussion of fit quality and reliability.