

Abstract
Background
Recent studies have reported the association between pericoronary inflammation assessed by pericoronary adipose tissue attenuation (PCATA) on computed tomography angiography and worse outcomes in patients with coronary artery disease. We investigated the determinants predicting increased PCATA in patients with known or suspected coronary artery disease.
Methods and Results
A total of 540 patients who underwent computed tomography angiography and invasive coronary angiography were studied. Mean computed tomography attenuation values of PCAT (−190 to −30 Hounsfield units) (PCATA) were assessed at the proximal 40‐mm segments of all 3 major coronary arteries by crude analysis. Univariable and multivariable analyses were performed to determine the predictors of increased PCATA surrounding the proximal right coronary artery. Mean right coronary artery‐PCATA was −72.22±8.47 Hounsfield units and the average of 3‐vessel PCATA was −70.24±6.60 Hounsfield units. Multivariable linear regression analysis revealed that the independent determinants of right coronary artery‐PCATA were male (β coefficient=4.965, P<0.001), left ventricular mass index (β coefficient=0.040, P=0.025), and angiographically significant stenosis (diameter stenosis >50%) (β coefficient=2.418, P=0.008). Sex‐related determinants were NT‐proBNP level (N‐terminal pro‐B‐type natriuretic peptide; β coefficient <0.001, P=0.026), Agatston score (β coefficient=−0.002, P=0.010), left ventricular mass index (β coefficient=0.041, P=0.028), and significant stenosis (β coefficient=4.006, P<0.001) in male patients and left ventricular ejection fraction (β coefficient=−0.217, P=0.010) and significant stenosis (β coefficient=3.835, P=0.023) in female patients.
Conclusions
Right coronary artery‐PCATA was associated with multiple clinical characteristics, established risk factors, and the presence of significant stenosis. Our results suggest that clinically significant factors such as sex, left ventricular hypertrophy, ejection fraction, calcification, and epicardial stenosis should be taken into account in the assessment of pericoronary inflammation using computed tomography angiography.
Keywords: adipose tissue, computed tomography angiography, coronary artery disease, inflammation
Subject Categories: Computerized Tomography (CT)
Nonstandard Abbreviations and Acronyms
- ACS
acute coronary syndrome
- CAD
coronary artery disease
- CT
computed tomography
- CTA
computed tomography angiography
- HU
Hounsfield units
- LAD
left anterior descending coronary artery
- LV
left ventricular
- PCAT
pericoronary adipose tissue
- PCATA
pericoronary adipose tissue attenuation
- RCA
right coronary artery
Clinical Perspective
What Is New?
This study investigated the determinants that predict increased pericoronary adipose tissue attenuation on coronary computed tomography angiography in patients with known or suspected coronary artery disease.
Elevated pericoronary adipose tissue attenuation surrounding the right coronary artery was associated with the presence of significant epicardial stenosis in the right coronary artery, whereas pericoronary adipose tissue attenuation was also influenced by multiple clinical characteristics including sex, stenosis severity, and left ventricular mass index.
What Are the Clinical Implications?
Our results suggest that clinically significant confounders such as sex, left ventricular hypertrophy, and sex‐related contributing factors such as coronary artery calcification and left ventricular ejection fraction should be taken into account in the assessment of pericoronary inflammation using computed tomography angiography.
Vascular inflammation is linked with progression of coronary atherosclerosis and pathogenesis of acute coronary syndromes (ACS). 1 , 2 , 3 In the vasculature, inflammatory cells such as macrophages and T lymphocytes usually emigrate from the blood to the intima and multiply within the atherosclerotic lesion in response to inflammatory cytokines. 1 Recent studies have reported that epicardial adipose tissue surrounding myocardium also releases adipocytokines, leading to amplified local vascular inflammation through paracrine effects. 4 , 5 Inflammation impairs lipid accumulation in preadipocytes and differentiation of small, immature preadipocytes to large mature adipocytes rich in intracellular lipid droplets. 6 A recent study reported that fat attenuation index on computed tomography (CT), defined as the mean CT attenuation of adipose tissue within a volume of interest, was associated with adipocyte lipid content/size quantified by histology and 18F‐fluorodeoxyglucose uptake on positron emission tomography. 7 A milestone in the recent studies of inflammation has reported that high fat attenuation index of pericoronary adipose tissue (PCAT) of the proximal right coronary artery (RCA), a part of epicardial adipose tissue that directly surrounds the coronary artery, was associated with increased cardiac mortality. 8 These studies suggest the feasibility of CT attenuation of PCAT for noninvasive assessment of coronary inflammation and risk stratification by using routine coronary CT angiography (CTA). However, in vivo data on CT attenuation of PCAT and its potential confounders have not been fully elucidated. In the present study, we aimed to investigate the determinants that predict the increased pericoronary inflammation status as assessed by the crude analysis of CT attenuation values of PCAT in patients with coronary artery disease (CAD).
Methods
The data that support the findings of this study are available from the corresponding author upon reasonable request.
Study Population
This post hoc analysis included 2474 patients from the institutional CTA registry enrolled between January 2013 and January 2019 at Tsuchiura Kyodo General Hospital. The reason for choosing this period was that CTA image acquisition was performed by using single CT system (Aquilion ONE; Canon Medical Systems Corporation, Otawara, Tochigi, Japan) in accordance with the Society of Cardiovascular Computed Tomography guidelines. 9 The indications of coronary CTA were considered based on the appropriate use criteria for coronary CTA. 10 Stable CAD was defined as angina with no change in frequency, duration, or intensity of anginal symptoms within 4 weeks before coronary angiography. Diagnosis of non–ST‐segment–elevation ACS included non–ST‐segment–elevation myocardial infarction and unstable angina, as previously reported. 11 Non–ST‐segment–elevation myocardial infarction was defined as ischemic symptoms in the absence of ST‐segment–elevation on ECG with elevated cardiac biomarkers (a rise and/or fall of high‐sensitivity cardiac troponin‐I values >99th percentile upper reference limit). 12 Unstable angina was defined as new‐onset angina, progressive crescendo pattern of angina, or angina at rest, without an increase in cardiac biomarkers. Patients with low or intermediate pretest probability for CAD underwent coronary CTA examination, but final decisions to examine CTA were made at the discretion of the physicians. In addition, this institutional CTA registry included cases involved in the clinical research, which was approved by the institutional ethics committee on human research of our hospital, investigating the efficacy of CTA preceding invasive coronary angiography in patients with non–ST‐segment–elevation ACS and stable hemodynamics. In this subgroup, CTA was performed within a few hours from the arrival to the emergency room to accurately rule in/out significant epicardial stenosis and to provide the diagnostic information of atherosclerotic burden, lesion location, and preprocedural planning of revascularization, using a relatively low dose of radiation and contrast. In the present study, 823 patients with known or suspected CAD who underwent CTA and subsequent invasive coronary angiography were screened. The exclusion criteria were as follows: patients with a history of coronary stenting or coronary artery bypass grafting, renal insufficiency with a baseline creatinine level of >2.0 mg/dL, congestive heart failure, and cardiogenic shock. Patients with suboptimal image quality were also excluded. A total of 540 patients with known or suspected CAD from the registry were included in the final analysis. Patients' clinical characteristics and angiographic findings were evaluated. Then, univariable and multivariable analyses were performed to determine the predictors of the increased pericoronary adipose tissue attenuation (PCATA) surrounding the RCA because RCA represents a current standardized model for PCAT analysis. 8 , 13 This study protocol was approved by the institutional ethics committee on human research of our hospital and written informed consent was obtained from all individual participants.
CTA Image Acquisition
CT examinations were performed using a 320‐slice CT scanner (Aquilion ONE; Canon Medical Systems Corporation, Otawara, Tochigi, Japan). Patients received oral administration of metoprolol (20–40 mg) 1 hour before the scheduled scan if their resting heart rate was >65 beats per minute, and all patients received sublingual nitroglycerin (0.3 mg) just before the scan. Noncontrast cardiac CT images with a 3‐mm slice thickness were obtained before coronary CTA to measure coronary artery calcification score according to the Agatston method. 14 Coronary CTA images were acquired with the scan protocol as follows: tube voltage of 120 kVp, tube current of 50 to 750 mA, gantry rotation speed of 350 ms per rotation, field matrix of 512×512, and scan slice thickness of 0.5 mm. As soon as the signal density level in the ascending aorta reached a predefined threshold of 150 Hounsfield units (HU), acquisition of CT data and an ECG trace were automatically started. Images were acquired after a bolus injection of 30 to 60 mL of contrast media (iopamidol, 370 mg iodine/mL, Bayer Yakuhin, Ltd., Osaka, Japan) at a rate of 3 to 6 mL/s, using prospective ECG‐triggering or retrospective ECG‐gating with automatic tube current modulation. All scans were performed during a single breath‐hold. Images were reconstructed at a window centered at 75% of the R‐R interval to coincide with left ventricular (LV) diastasis. LV mass was calculated as the LV myocardial volume derived by manually corrected automated delineation of the endocardial and epicardial borders and multiplied with the specific gravity of myocardial tissue (assuming a tissue density of 1.055 g/mL). 15 , 16 The LV mass index was calculated as the quotient of LV mass divided by body surface area.
PCAT Analysis
PCAT analysis was performed using a dedicated workstation (Aquarius iNtuition Edition version 4.4.13.P3; TeraRecon Inc., Foster City, CA, USA). The proximal 40‐mm segments of the left anterior descending coronary artery (LAD) and left circumflex coronary artery and the proximal 10 to 50 mm‐segment of the RCA were traced, as previously described. 8 Within the preidentified segment of interest, the lumen as well as the inner and outer vessel wall border were tracked in an automated manner with additional manual optimization. PCAT was defined as the adipose tissue located within a radial distance from the outer vessel wall equal to the diameter of the coronary vessel. 7 , 8 Voxel histograms of CT attenuation were plotted and the mean CT attenuation of all voxels between −190 to −30 HU (thresholds used for the definition of adipose tissue 8 , 17 ) within the PCAT volume was calculated. The PCATA was defined as the mean CT attenuation of PCAT of the traced 40‐mm segment by the crude analysis. Representative images of PCATA analysis are shown in Figure 1. In the present study, PCATA surrounding the RCA was used for further analysis. PCAT analysis was performed by investigators who were blinded to clinical data.
Figure 1. Representative computed tomography (CT) images of a patient with stable coronary artery disease.
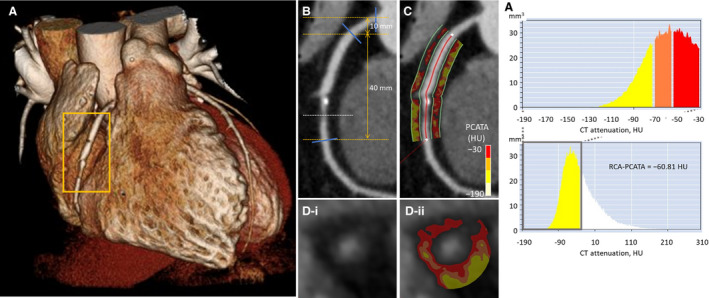
A, Three‐dimensional reconstruction of the heart. B, Curved planar reformation view shows an intermediate stenosis (dotted line) in the mid right coronary artery (RCA). C, Pericoronary adipose tissue (defined as the adipose tissue located within a radial distance from the outer wall equal to the diameter of the coronary vessel) at the proximal 40‐mm segment was traced. D, Cross‐sectional view shows an atherosclerotic plaque at the stenotic site. E, Histogram of CT attenuation within the traced proximal 10 to 50 mm segment revealed that the pericoronary adipose tissue attenuation (PCATA) in the RCA was −60.81 Hounsfield units (HU).
Statistical Analysis
All analyses were performed using SPSS Statistics 23.0 software (IBM Corporation, Armonk, NY, USA). Categorical data were expressed as absolute frequencies and percentages and compared using the chi‐square test or Fisher's exact test, as appropriate. Continuous variables were expressed as mean±SD for normally distributed variables and as median (interquartile range) for nonnormally distributed variables, and compared using the Student t test or one‐way analysis of variance, Mann‒Whitney test, or Kruskal‒Wallis test, as appropriate. Multivariable linear and logistic regression analyses were performed to determine the predictors of RCA‐PCATA. The associated variables in univariable analyses (P<0.10) were included in the multivariable model. The Hosmer–Lemeshow test was used to establish the goodness‐of‐fit for the logistic regression model and a P>0.05 indicated that the model provided a valid representation. A P<0.05 was considered statistically significant.
Results
Patient Characteristics
In a total of 540 patients, the median age was 68 years and 75.4% were male. In the present study, 311 patients (57.6%) presented with stable CAD and 229 patients (42.4%) presented with non–ST‐segment–elevation ACS. Patients' baseline clinical characteristics and laboratory findings of the study population are described in Table 1. Comparison of baseline characteristics between male and female patients is shown in Table S1.
Table 1.
Patients' Baseline Characteristics
| All (n=540) | |
|---|---|
| Age, y | 68 (60, 74) |
| Sex | |
| Male | 407 (75.4) |
| Female | 133 (24.6) |
| Body mass index, kg/m2 | 24.7±3.7 |
| Diagnosis | |
| ACS | 229 (42.4) |
| Stable CAD | 311 (57.6) |
| Hypertension | 384 (71.1) |
| Dyslipidemia | 295 (54.6) |
| Diabetes mellitus | 199 (36.9) |
| Current smoking | 169 (31.3) |
| Medication | |
| Aspirin | 290 (53.7) |
| Beta blockers | 126 (23.3) |
| RAS‐inhibitors | 246 (45.6) |
| Calcium channel blockers | 210 (38.9) |
| Statins | 240 (44.4) |
| Nitrates | 84 (15.6) |
| Oral hypoglycemic agents | 116 (21.5) |
| eGFR, mL/min per 1.73 m2 | 71.5±18.6 |
| LDL‐C, mg/dL | 112.3±32.4 |
| HDL‐C, mg/dL | 48.1±13.1 |
| Triglyceride, mg/dL | 150.4±106.2 |
| HbA1C, % | 6.2±1.2 |
| WBC count, /μL | 6255 (5200, 7800) |
| Hemoglobin, g/dL | 13.8 (12.9, 14.9) |
| hs‐cTnI on admission, ng/L | 14 (3, 360) |
| hs‐CRP, mg/dL | 0.10 (0.04, 0.38) |
| NT‐proBNP, pg/mL | 147 (61, 510) |
| LV‐EF*, % | 63.1±9.2 |
| CTA findings | |
| Agatston score | |
| Total | 328.42 (64.51, 835.31) |
| RCA | 52.51 (0.00, 246.36) |
| LMT | 0.00 (0.00, 0.77) |
| LAD | 141.11 (21.25, 386.74) |
| LCx | 15.60 (0.00, 124.86) |
| LV mass, g | 148.6 (121.4, 180.2) |
| LV mass index, g/m2 | 87.3 (75.4, 102.6) |
| Angiographic findings | |
| RCA MLD, mm | 1.13±0.93 |
| RCA RD, mm | 3.12±0.74 |
| RCA DS, % | 25.4±35.7 |
| RCA LL, mm | 15.49±9.74 |
| RCA DS >50% | 158 (29.3) |
| ACC/AHA | |
| A | 29 (18.4) |
| B1 | 54 (34.2) |
| B2 | 38 (24.1) |
| C | 37 (23.4) |
| Multivessel disease | 161 (29.8) |
| Gensini score | 16.0 (9.0, 32.0) |
Data are presented as number (%), mean±SD, or median (interquartile range). ACC/AHA indicates American College of Cardiology/American Heart Association; ACS, acute coronary syndrome; CAD, coronary artery disease; CTA, computed tomography angiography; DS, diameter stenosis; EF, ejection fraction; eGFR, estimated glomerular filtration rate; HbA1c, glycosylated hemoglobin; HDL‐C, high‐density lipoprotein cholesterol; hs‐CRP, high‐sensitivity C‐reactive protein; hs‐cTnI, high‐sensitivity cardiac troponin‐I; LAD, left anterior descending coronary artery; LCx, left circumflex coronary artery; LDL‐C, low‐density lipoprotein cholesterol; LL, lesion length; LMT, left main trunk; LV, left ventricular; MLD, minimal lumen diameter; NT‐proBNP, N‐terminal pro‐B‐type natriuretic peptide; RAS, renin‐angiotensin system; RCA, right coronary artery; RD, reference vessel diameter; and WBC, white blood cell.
Assessed by echocardiography.
PCATA Findings
Mean PCATA surrounding the coronary artery was −72.22±8.47 HU in the RCA, −71.45±8.03 HU in the LAD, and −66.80±7.44 HU in the left circumflex coronary artery, respectively (Figure 2A). Although there were significant mutual correlations among the PCATA of the 3 epicardial coronary arteries (Figure 2B), PCATA in the RCA was significantly lower than those in the LAD or left circumflex coronary artery (Figure 2A). The histogram of RCA‐PCATA is shown in Figure 2C. Patients with RCA involvement as culprit/target vessel had higher RCA‐PCATA than those without RCA involvement in the subgroups of ACS and stable CAD, whereas patients with ACS involving RCA as culprit vessel and those with stable CAD involving RCA as target vessel showed similar RCA‐PCATA (Figure 3A). In contrast, patients with ACS involving LAD as culprit vessel had higher LAD‐PCATA than those with stable CAD involving LAD as target vessel, whereas patients with LAD involvement as culprit/target vessel and those without LAD involvement showed similar LAD‐PCATA in the subgroups of ACS and stable CAD (Figure 3B).
Figure 2. The comparisons (A) and the correlations (B) of pericoronary adipose tissue attenuation (PCATA) among the 3 epicardial coronary arteries, and the distribution of PCATA surrounding the right coronary artery (RCA) (C).
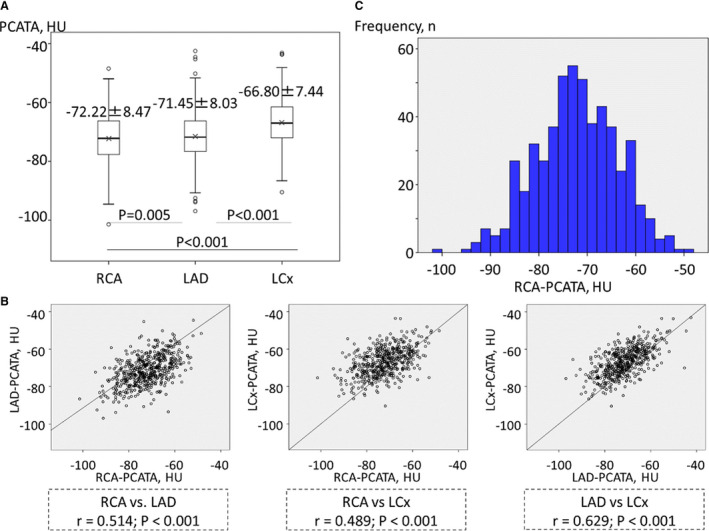
LAD indicates left anterior descending coronary artery; and LCx, left circumflex coronary artery.
Figure 3. Comparisons of pericoronary adipose tissue attenuation (PCATA) surrounding the right coronary artery (RCA) (A) and left anterior descending coronary artery (LAD) (B) according to the localization and the clinical presentation.
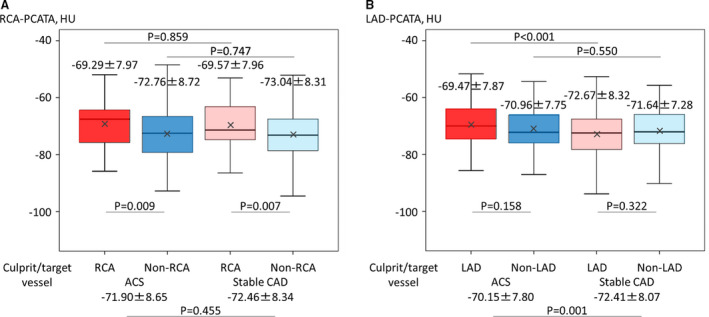
ACS indicates acute coronary syndrome; CAD, coronary artery disease; and HU, Hounsfield units.
Determinants of PCATA Surrounding the RCA
RCA‐PCATA was significantly higher in male patients than in female patients (−70.90±8.12 versus −76.22±8.29 HU, P<0.001). Patients with angiographically significant epicardial stenosis (diameter stenosis >50%) in the RCA had a higher RCA‐PCATA than those without significant stenosis in the RCA (−70.17±8.05 versus −73.07±8.51 HU, P<0.001). Patients with angiographically significant stenosis in the LAD had a higher LAD‐PCATA than those without significant stenosis in the LAD (−70.84±7.89 versus −72.30±8.16 HU, P=0.037). Univariable linear regression analysis revealed that the significant determinants of PCATA in the RCA were age, male sex, high‐sensitivity C‐reactive protein level, LV mass index, and the presence of significant stenosis in the RCA (Table 2). PCATA in the RCA was not associated with the presence of significant stenosis in the LAD (β coefficient, 0.343, P=0.645). Multivariable linear regression analysis revealed that the significant determinants of RCA‐PCATA were male sex (β coefficient, 4.965, P<0.001), LV mass index (β coefficient, 0.040, P=0.025), and the presence of significant stenosis in the RCA (β coefficient, 2.418, P=0.008) (Table 2). Multivariable logistic regression analysis demonstrated that the significant determinants of elevated RCA‐PCATA (≥ −70.1 HU) (the cutoff value derived from the previous study by Oikonomou et al 8 ) were male sex (odds ratio, 3.665, P<0.001) and the presence of significant stenosis in the RCA (odds ratio, 1.687, P=0.028) (Table 3). The Hosmer–Lemeshow test provided a proper goodness‐of‐fit for the model (P=0.999). Sex‐related determinants of RCA‐PCATA were NT‐pro‐BNP (β coefficient, <0.001, P=0.026), Agatston score in the RCA (β coefficient, −0.002, P=0.010), LV mass index (β coefficient, 0.041, P=0.028), and the presence of significant stenosis in the RCA (β coefficient, 4.006, P<0.001) in male patients (Table 4) and LV ejection fraction (β coefficient, −0.217, P=0.010) and the presence of significant stenosis in the RCA (β coefficient, 3.835, P=0.023) in female patients (Table 5).
Table 2.
Determinants of Pericoronary Adipose Tissue Attenuation Surrounding the Right Coronary Artery
| Univariable | Multivariable | |||||||
|---|---|---|---|---|---|---|---|---|
| β Coefficient |
95% CI Lower |
95% CI Upper |
P Value | β Coefficient |
95% CI Lower |
95% CI Upper |
P Value | |
| Age, y | −0.072 | −0.139 | −0.005 | 0.035 | ||||
| Male | 5.325 | 3.721 | 6.930 | <0.001 | 4.965 | 3.067 | 6.862 | <0.001 |
| Body mass index, kg/m2 | −0.067 | −0.264 | 0.131 | 0.507 | ||||
| Hypertension | 0.395 | −1.194 | 1.983 | 0.626 | ||||
| Dyslipidemia | −0.862 | −2.310 | 0.586 | 0.243 | ||||
| Diabetes mellitus | 0.858 | −0.637 | 2.353 | 0.260 | ||||
| Current smoking | 0.783 | −0.774 | 2.340 | 0.324 | ||||
| ACS | 0.555 | −0.904 | 2.015 | 0.455 | ||||
| Statins | −0.017 | −1.469 | 1.435 | 0.981 | ||||
| eGFR, mL/min per 1.73 m2 | 0.023 | −0.016 | 0.063 | 0.239 | ||||
| LDL‐C, mg/dL | −0.018 | −0.041 | 0.004 | 0.113 | ||||
| HDL‐C, mg/dL | −0.053 | −0.109 | 0.003 | 0.064 | ||||
| Triglyceride, mg/dL | −0.002 | −0.008 | 0.005 | 0.668 | ||||
| HbA1C, % | 0.067 | −0.543 | 0.677 | 0.829 | ||||
| WBC count, /μL | 0.000 | 0.000 | 0.000 | 0.665 | ||||
| Hemoglobin, g/dL | 0.474 | −0.016 | 0.965 | 0.058 | ||||
| hs‐cTnI on admission, ng/L | <0.001 | <0.001 | <0.001 | 0.897 | ||||
| hs‐CRP, mg/dL | 0.497 | 0.068 | 0.926 | 0.023 | ||||
| NT‐proBNP, pg/mL | <0.001 | <0.001 | <0.001 | 0.210 | ||||
| LV‐EF, % | −0.064 | 0.143 | 0.015 | 0.110 | ||||
| RCA stenosis (DS >50%) | 2.902 | 1.332 | 4.472 | <0.001 | 2.418 | 0.625 | 4.210 | 0.008 |
| RCA Agatston score | −0.001 | −0.002 | 0.001 | 0.243 | ||||
| LV mass index, g/m2 | 0.072 | 0.041 | 0.102 | <0.001 | 0.040 | 0.005 | 0.075 | 0.025 |
ACS indicates acute coronary syndrome; CI, confidence interval; DS, diameter stenosis; EF, ejection fraction; eGFR, estimated glomerular filtration rate; HbA1c, glycosylated hemoglobin; HDL‐C, high‐density lipoprotein cholesterol; hs‐CRP, high‐sensitivity C‐reactive protein; hs‐cTnI, high‐sensitivity cardiac troponin‐I; LDL‐C, low‐density lipoprotein cholesterol; LV, left ventricular; NT‐proBNP, N‐terminal pro‐B‐type natriuretic peptide; RCA, right coronary artery; and WBC, white blood cell.
Table 3.
Determinants of Elevated Pericoronary Adipose Tissue Attenuation Surrounding the Right Coronary Artery (≥ −70.1 Hounsfield Units)
| Univariable | Multivariable | |||||||
|---|---|---|---|---|---|---|---|---|
| Odds Ratio |
95% CI Lower |
95% CI Upper |
P Value | Odds Ratio |
95% CI Lower |
95% CI Upper |
P Value | |
| Age, y | 0.984 | 0.968 | 1.000 | 0.055 | ||||
| Male | 2.925 | 1.862 | 4.594 | <0.001 | 3.665 | 2.109 | 6.369 | <0.001 |
| Body mass index, kg/m2 | 0.981 | 0.936 | 1.029 | 0.438 | ||||
| Hypertension | 1.221 | 0.831 | 1.795 | 0.309 | ||||
| Dyslipidemia | 0.848 | 0.599 | 1.201 | 0.353 | ||||
| Diabetes mellitus | 1.080 | 0.755 | 1.546 | 0.673 | ||||
| Current smoking | 1.352 | 0.933 | 1.960 | 0.112 | ||||
| ACS | 1.301 | 0.917 | 1.847 | 0.140 | ||||
| Statins | 1.014 | 0.716 | 1.437 | 0.937 | ||||
| eGFR, mL/min per 1.73 m2 | 1.002 | 0.993 | 1.012 | 0.652 | ||||
| LDL‐C, mg/dL | 0.994 | 0.989 | 1.000 | 0.045 | ||||
| HDL‐C, mg/dL | 0.987 | 0.974 | 1.001 | 0.066 | ||||
| Triglyceride, mg/dL | 1.000 | 0.999 | 1.002 | 0.852 | ||||
| HbA1C, % | 1.018 | 0.880 | 1.178 | 0.808 | ||||
| WBC count, /μL | 1.000 | 1.000 | 1.000 | 0.088 | ||||
| Hemoglobin, g/dL | 1.115 | 0.987 | 1.258 | 0.080 | ||||
| hs‐cTnI on admission, ng/L | 1.000 | 1.000 | 1.000 | 0.609 | ||||
| hs‐CRP, mg/dL | 1.066 | 0.962 | 1.182 | 0.223 | ||||
| NT‐proBNP, pg/mL | 1.000 | 1.000 | 1.000 | 0.918 | ||||
| LV‐EF, % | 0.985 | 0.967 | 1.004 | 0.115 | ||||
| RCA stenosis (DS >50%) | 1.553 | 1.064 | 2.267 | 0.022 | 1.687 | 1.059 | 2.687 | 0.028 |
| RCA Agatston score | 1.000 | 0.999 | 1.000 | 0.187 | ||||
| LV mass index, g/m2 | 1.016 | 1.008 | 1.024 | <0.001 | ||||
ACS indicates acute coronary syndrome; CI, confidence interval; DS, diameter stenosis; EF, ejection fraction; eGFR, estimated glomerular filtration rate; HbA1c, glycosylated hemoglobin; HDL‐C, high‐density lipoprotein cholesterol; hs‐CRP, high‐sensitivity C‐reactive protein; hs‐cTnI, high‐sensitivity cardiac troponin‐I; LDL‐C, low‐density lipoprotein cholesterol; LV, left ventricular; NT‐proBNP, N‐terminal pro‐B‐type natriuretic peptide; RCA, right coronary artery; and WBC, white blood cell.
Table 4.
Determinants of Pericoronary Adipose Tissue Attenuation Surrounding the Right Coronary Artery in Male Patients
| Univariable | Multivariable | |||||||
|---|---|---|---|---|---|---|---|---|
| β Coefficient |
95% CI Lower |
95% CI Upper |
P Value | β Coefficient |
95% CI Lower |
95% CI Upper |
P Value | |
| Age, y | −0.022 | −0.098 | 0.054 | 0.570 | ||||
| Body mass index, kg/m2 | −0.162 | −0.385 | 0.061 | 0.154 | ||||
| Hypertension | 0.200 | −1.547 | 1.948 | 0.822 | ||||
| Dyslipidemia | −0.523 | −2.124 | 1.077 | 0.521 | ||||
| Diabetes mellitus | 0.743 | −0.901 | 2.387 | 0.375 | ||||
| Current smoking | −0.337 | −1.983 | 1.309 | 0.687 | ||||
| ACS | 0.827 | −0.790 | 2.444 | 0.315 | ||||
| Statins | 0.057 | −1.554 | 1.667 | 0.945 | ||||
| eGFR, mL/min per 1.73 m2 | 0.010 | −0.035 | 0.054 | 0.669 | ||||
| LDL‐C, mg/dL | −0.018 | −0.042 | 0.007 | 0.158 | ||||
| HDL‐C, mg/dL | −0.008 | −0.073 | 0.057 | 0.810 | ||||
| Triglyceride, mg/dL | −0.003 | −0.010 | 0.004 | 0.392 | ||||
| HbA1C, % | 0.062 | −0.598 | 0.722 | 0.853 | ||||
| WBC count, /μL | <0.001 | <0.001 | <0.001 | 0.662 | ||||
| Hemoglobin, g/dL | −0.179 | −0.750 | 0.392 | 0.538 | ||||
| hs‐cTnI on admission, ng/L | <0.001 | <0.001 | <0.001 | 0.935 | ||||
| hs‐CRP, mg/dL | 0.527 | 0.076 | 0.978 | 0.022 | ||||
| NT‐proBNP, pg/mL | 0.001 | <0.001 | 0.001 | 0.017 | <0.001 | <0.001 | 0.001 | 0.026 |
| LV‐EF, % | −0.001 | −0.087 | 0.086 | 0.988 | ||||
| RCA stenosis (DS >50%) | 3.416 | 1.697 | 5.135 | <0.001 | 4.006 | 2.216 | 5.796 | <0.001 |
| RCA Agatston score | −0.002 | −0.003 | <0.001 | 0.089 | −0.002 | −0.004 | −0.001 | 0.010 |
| LV mass index, g/m2 | 0.044 | 0.008 | 0.079 | 0.016 | 0.041 | 0.004 | 0.078 | 0.028 |
ACS indicates acute coronary syndrome; CI, confidence interval; DS, diameter stenosis; EF, ejection fraction; eGFR, estimated glomerular filtration rate; HbA1c, glycosylated hemoglobin; HDL‐C, high‐density lipoprotein cholesterol; hs‐CRP, high‐sensitivity C‐reactive protein; hs‐cTnI, high‐sensitivity cardiac troponin‐I; LDL‐C, low‐density lipoprotein cholesterol; LV, left ventricular; NT‐proBNP, N‐terminal pro‐B‐type natriuretic peptide; RCA, right coronary artery; and WBC, white blood cell.
Table 5.
Determinants of Pericoronary Adipose Tissue Attenuation Surrounding the Right Coronary Artery in Female Patients
| Univariable | Multivariable | |||||||
|---|---|---|---|---|---|---|---|---|
| β Coefficient |
95% CI Lower |
95% CI Upper |
P Value | β Coefficient |
95% CI Lower |
95% CI Upper |
P Value | |
| Age, y | −0.014 | −0.156 | 0.127 | 0.843 | ||||
| Body mass index, kg/m2 | −0.073 | −0.445 | 0.299 | 0.700 | ||||
| Hypertension | 1.558 | −1.644 | 4.760 | 0.337 | ||||
| Dyslipidemia | −0.904 | −3.807 | 1.999 | 0.539 | ||||
| Diabetes mellitus | 0.345 | −2.689 | 3.379 | 0.822 | ||||
| Current smoking | −1.979 | −6.618 | 2.660 | 0.400 | ||||
| ACS | 0.007 | −2.872 | 2.886 | 0.996 | ||||
| Statins | 0.343 | −2.516 | 3.202 | 0.813 | ||||
| eGFR, mL/min per 1.73 m2 | 0.004 | −0.071 | 0.079 | 0.912 | ||||
| LDL‐C, mg/dL | −0.024 | −0.071 | 0.022 | 0.305 | ||||
| HDL‐C, mg/dL | −0.041 | −0.146 | 0.064 | 0.440 | ||||
| Triglyceride, mg/dL | −0.012 | −0.033 | 0.010 | 0.282 | ||||
| HbA1C, % | −0.276 | −1.588 | 1.036 | 0.678 | ||||
| WBC count, /μL | <0.001 | −0.001 | 0.001 | 0.631 | ||||
| Hemoglobin, g/dL | 0.273 | −0.854 | 1.401 | 0.632 | ||||
| hs‐cTnI on admission, ng/L | <0.001 | −0.001 | <0.001 | 0.152 | ||||
| hs‐CRP, mg/dL | 0.252 | −0.775 | 1.280 | 0.628 | ||||
| NT‐proBNP, pg/mL | <0.001 | <0.001 | <0.001 | 0.205 | ||||
| LV‐EF, % | −0.184 | −0.349 | −0.020 | 0.028 | −0.217 | −0.381 | 0.021 | 0.010 |
| RCA stenosis (DS >50%) | 3.972 | 0.703 | 7.240 | 0.018 | 3.835 | 0.549 | 7.121 | 0.023 |
| RCA Agatston score | 0.001 | −0.002 | 0.003 | 0.584 | ||||
| LV mass index, g/m2 | 0.076 | 0.016 | 0.136 | 0.013 | ||||
ACS indicates acute coronary syndrome; CI, confidence interval; DS, diameter stenosis; EF, ejection fraction; eGFR, estimated glomerular filtration rate; HbA1c, glycosylated hemoglobin; HDL‐C, high‐density lipoprotein cholesterol; hs‐CRP, high‐sensitivity C‐reactive protein; hs‐cTnI, high‐sensitivity cardiac troponin‐I; LDL‐C, low‐density lipoprotein cholesterol; LV, left ventricular; NT‐proBNP, N‐terminal pro‐B‐type natriuretic peptide; RCA, right coronary artery; and WBC, white blood cell.
Discussion
The main findings of this study include (1) PCATA in the RCA was significantly lower than those in the LAD or left circumflex coronary artery; (2) univariable linear regression analysis revealed that RCA‐PCATA was associated with multiple clinical characteristics including age, sex, other established risk factors such as high‐sensitivity C‐reactive protein level and LV mass index and the presence of significant epicardial stenosis in the RCA; (3) multivariable linear regression analysis revealed that RCA‐PCATA was associated with sex, LV mass index, and the presence of significant stenosis in the RCA; (4) multivariable logistic regression analysis revealed that elevated RCA‐PCATA was associated with male sex and the presence of significant stenosis in the RCA; and (5) there were sex‐related determinants of RCA‐PCATA, which were NT‐pro‐BNP level, coronary artery calcification, LV mass index, and the presence of significant stenosis in the RCA in male patients and LV ejection fraction and the presence of significant stenosis in the RCA in female patients.
Visualizing Coronary Inflammation by Noninvasive Imaging Modalities
Recent studies have focused on detection of vascular inflammation by using noninvasive imaging modalities such as positron emission tomography imaging. Several studies have demonstrated a strong correlation between 18F‐fluorodeoxyglucose uptake on positron emission tomography and histologic inflammation as assessed by macrophage infiltration and CD68 staining. 18 , 19 18F‐sodium fluoride uptake on positron emission tomography detects active vascular calcification as a result of vascular inflammation. 20 A recent study reported that mean CT attenuation of adipose tissue as described by fat attenuation index was associated with 18F‐fluorodeoxyglucose uptake, 7 indicating the feasibility of CT attenuation of PCAT for detecting pericoronary inflammation.
Association Between PCATA, Coronary Atherosclerosis, and Pericoronary Inflammation
Previous studies have reported the association between coronary atherosclerosis and regional PCAT by qualitative and quantitative assessments. PCAT volume 21 , 22 and PCAT attenuation 23 were increased in segments with atherosclerotic plaque. Other studies have reported the increase in PCAT attenuation 24 , 25 and the presence of PCAT stranding (irregular obscuration) 26 for culprit lesions in ACS. Increased PCAT attenuation may also predict future plaque progression. 13 These reports are all supportive of the hypothesis that PCAT may reflect regional atherosclerotic burden and the extent of local inflammation. A recent post hoc analysis of outcome data gathered prospectively from 2 independent cohorts has demonstrated the significant association between higher PCAT attenuation in the proximal RCA and a higher adjusted risk of all‐cause mortality, indicating the association between vessel‐oriented low‐grade local inflammation status and systemic vulnerability. 8 Based on their methods, the present study conducted the crude analysis of PCAT by evaluating PCATA at the proximal 40‐mm segment in the RCA. Our result showed the association between elevated PCATA and the presence of epicardial stenosis in the RCA. Our findings indicate that elevated PCATA may reflect higher levels of vessel‐oriented inflammation, independently of high‐sensitivity C‐reactive protein level.
Determinants of PCATA
In contrast to the previous studies that used models that had adjusted for clinical characteristics such as age, sex, body mass index, CT equipment‐associated differences, and traditional coronary risk factors, 21 , 27 , 28 we analyzed the crude data of PCATA in the present study. Our results implied that male patients may have potentially higher PCAT‐defined inflammatory status compared with female patients. To the best of our knowledge, the present study is the first series that demonstrated the potential sex specificity of PCATA. Moreover, our results showed that PCATA was associated with LV hypertrophy. Because LV hypertrophy is a strong predictor of worse cardiac outcomes, 29 elevated PCATA associated with LV hypertrophy may result in worse outcomes.
Our results showed that RCA‐PCATA was associated with the localization (culprit/target versus nonculprit/target vessel), whereas LAD‐PCATA was associated with the clinical presentation. A recent study demonstrated that PCATA of culprit lesions of patients with ACS was higher compared with those of nonculprit lesions of patients with ACS and highest‐grade stenotic lesions of matched control patients. 24 The main difference between the referenced study and ours was that PCATA in the proximal 40‐mm RCA, regardless of the culprit vessel localization and lesion segment, was investigated in our study, whereas PCATA in the culprit lesions (segmental assessment) was applied in the referenced study. Our findings were in line with the study by Oikonomou et al 8 and may further suggest the clinical significance and/or importance of the interrogated segment for inflammation. Further large population studies are needed to clarify the clinical significance of the interrogated segment and its relationship with prognostic information.
Clinical Implications
PCATA assessed by coronary CTA can detect pericoronary inflammatory status, which may not be detected by systemic inflammation biomarker of high‐sensitivity C‐reactive protein as was in the present study. Our findings suggest that clinically significant confounders such as sex, LV mass index, coronary artery calcification, LV ejection fraction, and other established risk factors as well as the presence of significant epicardial stenosis should be taken into account in the assessment of coronary inflammation using CTA. Considering the modest association between PCATA and other confounders, our results suggest that PCATA provides incremental ability to stratify high‐risk patients with increased pericoronary inflammation on top of established risk factors.
Study Limitations
First, this is a retrospective observational study from a single center and therefore has intrinsic risk of selection bias. Second, coronary plaque features on CTA were not evaluated. Our objective was to investigate the determinants of PCAT‐defined pericoronary inflammation status. Third, PCATA may be affected by suboptimal CTA image quality such as artifacts and partial volume‐effects. The optimal cutoff value of elevated PCATA should be clarified in future studies. Fourth, because of a moderate number of our study population, sex‐related subgroup analysis may be underpowered. Fifth, because all patients enrolled in the present study cohort were Asian (Japanese) subjects, we did not have any data regarding the racial difference in PCATA. Ethnic diversity and its prognostic implication should be clarified in further studies. Finally, clinical outcomes were not evaluated.
Conclusions
Elevated PCATA in the RCA was associated with the presence of significant epicardial stenosis in the RCA, whereas PCATA was also influenced by multiple clinical characteristics. Our results suggest that clinically significant confounders such as sex, LV hypertrophy, and sex‐related contributing factors such as coronary artery calcification and LV ejection fraction should be taken into account in the assessment of pericoronary inflammation using CTA.
Sources of Funding
None.
Disclosures
None.
Supporting information
Table S1
Acknowledgments
The authors thank all the physicians, nurses, other heart team members, and patients who are involved in this study.
(J Am Heart Assoc. 2020;9:e016202 DOI: 10.1161/JAHA.120.016202.)
For Sources of Funding and Disclosures, see page 10.
References
- 1. Ross R. Atherosclerosis–an inflammatory disease. N Engl J Med. 1999;340:115–126. [DOI] [PubMed] [Google Scholar]
- 2. Libby P. Inflammation in atherosclerosis. Arterioscler Thromb Vasc Biol. 2012;32:2045–2051. [DOI] [PMC free article] [PubMed] [Google Scholar]
- 3. Libby P, Tabas I, Fredman G, Fisher EA. Inflammation and its resolution as determinants of acute coronary syndromes. Circ Res. 2014;114:1867–1879. [DOI] [PMC free article] [PubMed] [Google Scholar]
- 4. Mazurek T, Zhang L, Zalewski A, Mannion JD, Diehl JT, Arafat H, Sarov‐Blat L, O'Brien S, Keiper EA, Johnson AG, et al. Human epicardial adipose tissue is a source of inflammatory mediators. Circulation. 2003;108:2460–2466. [DOI] [PubMed] [Google Scholar]
- 5. Shimabukuro M, Hirata Y, Tabata M, Dagvasumberel M, Sato H, Kurobe H, Fukuda D, Soeki T, Kitagawa T, Takanashi S, et al. Epicardial adipose tissue volume and adipocytokine imbalance are strongly linked to human coronary atherosclerosis. Arterioscler Thromb Vasc Biol. 2013;33:1077–1084. [DOI] [PubMed] [Google Scholar]
- 6. Ghaben AL, Scherer PE. Adipogenesis and metabolic health. Nat Rev Mol Cell Biol. 2019;20:242–258. [DOI] [PubMed] [Google Scholar]
- 7. Antonopoulos AS, Sanna F, Sabharwal N, Thomas S, Oikonomou EK, Herdman L, Margaritis M, Shirodaria C, Kampoli AM, Akoumianakis I, et al. Detecting human coronary inflammation by imaging perivascular fat. Sci Transl Med. 2017;9:eaal2658. [DOI] [PubMed] [Google Scholar]
- 8. Oikonomou EK, Marwan M, Desai MY, Mancio J, Alashi A, Hutt Centeno E, Thomas S, Herdman L, Kotanidis CP, Thomas KE, et al. Non‐invasive detection of coronary inflammation using computed tomography and prediction of residual cardiovascular risk (the CRISP CT study): a post‐hoc analysis of prospective outcome data. Lancet. 2018;392:929–939. [DOI] [PMC free article] [PubMed] [Google Scholar]
- 9. Abbara S, Blanke P, Maroules CD, Cheezum M, Choi AD, Han BK, Marwan M, Naoum C, Norgaard BL, Rubinshtein R, et al. SCCT guidelines for the performance and acquisition of coronary computed tomographic angiography: a report of the society of Cardiovascular Computed Tomography Guidelines Committee: endorsed by the North American Society for Cardiovascular Imaging (NASCI). J Cardiovasc Comput Tomogr. 2016;10:435–449. [DOI] [PubMed] [Google Scholar]
- 10. Taylor AJ, Cerqueira M, Hodgson JM, Mark D, Min J, O'Gara P, Rubin GD, Kramer CM, Berman D, Brown A, et al. ACCF/SCCT/ACR/AHA/ASE/ASNC/NASCI/SCAI/SCMR 2010 appropriate use criteria for cardiac computed tomography. A report of the American College of Cardiology Foundation Appropriate Use Criteria Task Force, the Society of Cardiovascular Computed Tomography, the American College of Radiology, the American Heart Association, the American Society of Echocardiography, the American Society of Nuclear Cardiology, the North American Society for Cardiovascular Imaging, the Society for Cardiovascular Angiography and Interventions, and the Society for Cardiovascular Magnetic Resonance. J Am Coll Cardiol. 2010;56:1864–1894. [DOI] [PubMed] [Google Scholar]
- 11. Amsterdam EA, Wenger NK, Brindis RG, Casey DE Jr, Ganiats TG, Holmes DR Jr, Jaffe AS, Jneid H, Kelly RF, Kontos MC, et al. 2014 AHA/ACC guideline for the management of patients with non‐ST‐elevation acute coronary syndromes: a report of the American College of Cardiology/American Heart Association Task Force on Practice Guidelines. Circulation. 2014;130:e344–e426. [DOI] [PubMed] [Google Scholar]
- 12. Thygesen K, Alpert JS, Jaffe AS, Chaitman BR, Bax JJ, Morrow DA, White HD. Fourth universal definition of myocardial infarction (2018). Eur Heart J. 2019;40:237–269. [DOI] [PubMed] [Google Scholar]
- 13. Goeller M, Tamarappoo BK, Kwan AC, Cadet S, Commandeur F, Razipour A, Slomka PJ, Gransar H, Chen X, Otaki Y, et al. Relationship between changes in pericoronary adipose tissue attenuation and coronary plaque burden quantified from coronary computed tomography angiography. Eur Heart J Cardiovasc Imaging. 2019;20:636–643. [DOI] [PMC free article] [PubMed] [Google Scholar]
- 14. Agatston AS, Janowitz WR, Hildner FJ, Zusmer NR, Viamonte M Jr, Detrano R. Quantification of coronary artery calcium using ultrafast computed tomography. J Am Coll Cardiol. 1990;15:827–832. [DOI] [PubMed] [Google Scholar]
- 15. Fuchs A, Mejdahl MR, Kuhl JT, Stisen ZR, Nilsson EJ, Kober LV, Nordestgaard BG, Kofoed KF. Normal values of left ventricular mass and cardiac chamber volumes assessed by 320‐detector computed tomography angiography in the Copenhagen General Population Study. Eur Heart J Cardiovasc Imaging. 2016;17:1009–1017. [DOI] [PubMed] [Google Scholar]
- 16. Gheorghe AG, Fuchs A, Jacobsen C, Kofoed KF, Mogelvang R, Lynnerup N, Banner J. Cardiac left ventricular myocardial tissue density, evaluated by computed tomography and autopsy. BMC Med Imaging. 2019;19:29. [DOI] [PMC free article] [PubMed] [Google Scholar]
- 17. Tamarappoo B, Dey D, Shmilovich H, Nakazato R, Gransar H, Cheng VY, Friedman JD, Hayes SW, Thomson LE, Slomka PJ, et al. Increased pericardial fat volume measured from noncontrast CT predicts myocardial ischemia by SPECT. JACC Cardiovasc Imaging. 2010;3:1104–1112. [DOI] [PMC free article] [PubMed] [Google Scholar]
- 18. Rudd JH, Warburton EA, Fryer TD, Jones HA, Clark JC, Antoun N, Johnstrom P, Davenport AP, Kirkpatrick PJ, Arch BN, et al. Imaging atherosclerotic plaque inflammation with [18F]‐fluorodeoxyglucose positron emission tomography. Circulation. 2002;105:2708–2711. [DOI] [PubMed] [Google Scholar]
- 19. Tawakol A, Migrino RQ, Bashian GG, Bedri S, Vermylen D, Cury RC, Yates D, LaMuraglia GM, Furie K, Houser S, et al. In vivo 18F‐fluorodeoxyglucose positron emission tomography imaging provides a noninvasive measure of carotid plaque inflammation in patients. J Am Coll Cardiol. 2006;48:1818–1824. [DOI] [PubMed] [Google Scholar]
- 20. Dweck MR, Chow MW, Joshi NV, Williams MC, Jones C, Fletcher AM, Richardson H, White A, McKillop G, van Beek EJ, et al. Coronary arterial 18F‐sodium fluoride uptake: a novel marker of plaque biology. J Am Coll Cardiol. 2012;59:1539–1548. [DOI] [PubMed] [Google Scholar]
- 21. Mahabadi AA, Reinsch N, Lehmann N, Altenbernd J, Kalsch H, Seibel RM, Erbel R, Mohlenkamp S. Association of pericoronary fat volume with atherosclerotic plaque burden in the underlying coronary artery: a segment analysis. Atherosclerosis. 2010;211:195–199. [DOI] [PubMed] [Google Scholar]
- 22. Maurovich‐Horvat P, Kallianos K, Engel LC, Szymonifka J, Fox CS, Hoffmann U, Truong QA. Influence of pericoronary adipose tissue on local coronary atherosclerosis as assessed by a novel MDCT volumetric method. Atherosclerosis. 2011;219:151–157. [DOI] [PMC free article] [PubMed] [Google Scholar]
- 23. Marwan M, Hell M, Schuhback A, Gauss S, Bittner D, Pflederer T, Achenbach S. CT attenuation of pericoronary adipose tissue in normal versus atherosclerotic coronary segments as defined by intravascular ultrasound. J Comput Assist Tomogr. 2017;41:762–767. [DOI] [PubMed] [Google Scholar]
- 24. Goeller M, Achenbach S, Cadet S, Kwan AC, Commandeur F, Slomka PJ, Gransar H, Albrecht MH, Tamarappoo BK, Berman DS, et al. Pericoronary adipose tissue computed tomography attenuation and high‐risk plaque characteristics in acute coronary syndrome compared with stable coronary artery disease. JAMA Cardiol. 2018;3:858–863. [DOI] [PMC free article] [PubMed] [Google Scholar]
- 25. Konishi M, Sugiyama S, Sato Y, Oshima S, Sugamura K, Nozaki T, Ohba K, Matsubara J, Sumida H, Nagayoshi Y, et al. Pericardial fat inflammation correlates with coronary artery disease. Atherosclerosis. 2010;213:649–655. [DOI] [PubMed] [Google Scholar]
- 26. Hedgire S, Baliyan V, Zucker EJ, Bittner DO, Staziaki PV, Takx RAP, Scholtz JE, Meyersohn N, Hoffmann U, Ghoshhajra B. Perivascular epicardial fat stranding at coronary CT angiography: a marker of acute plaque rupture and spontaneous coronary artery dissection. Radiology. 2018;287:808–815. [DOI] [PMC free article] [PubMed] [Google Scholar]
- 27. de Vos AM, Prokop M, Roos CJ, Meijs MF, van der Schouw YT, Rutten A, Gorter PM, Cramer MJ, Doevendans PA, Rensing BJ, et al. Peri‐coronary epicardial adipose tissue is related to cardiovascular risk factors and coronary artery calcification in post‐menopausal women. Eur Heart J. 2008;29:777–783. [DOI] [PubMed] [Google Scholar]
- 28. Hell MM, Achenbach S, Schuhbaeck A, Klinghammer L, May MS, Marwan M. CT‐based analysis of pericoronary adipose tissue density: relation to cardiovascular risk factors and epicardial adipose tissue volume. J Cardiovasc Comput Tomogr. 2016;10:52–60. [DOI] [PubMed] [Google Scholar]
- 29. Levy D, Garrison RJ, Savage DD, Kannel WB, Castelli WP. Prognostic implications of echocardiographically determined left ventricular mass in the Framingham Heart Study. N Engl J Med. 1990;322:1561–1566. [DOI] [PubMed] [Google Scholar]
Associated Data
This section collects any data citations, data availability statements, or supplementary materials included in this article.
Supplementary Materials
Table S1