

Abstract
Background
Several small‐scale animal studies have suggested that gut microbiota and blood pressure (BP) are linked. However, results from human studies remain scarce and conflicting. We wanted to elucidate the multivariable‐adjusted association between gut metagenome and BP in a large, representative, well‐phenotyped population sample. We performed a focused analysis to examine the previously reported inverse associations between sodium intake and Lactobacillus abundance and between Lactobacillus abundance and BP.
Methods and Results
We studied a population sample of 6953 Finns aged 25 to 74 years (mean age, 49.2±12.9 years; 54.9% women). The participants underwent a health examination, which included BP measurement, stool collection, and 24‐hour urine sampling (N=829). Gut microbiota was analyzed using shallow shotgun metagenome sequencing. In age‐ and sex‐adjusted models, the α (within‐sample) and β (between‐sample) diversities of taxonomic composition were strongly related to BP indexes (P<0.001 for most). In multivariable‐adjusted models, β diversity was only associated with diastolic BP (P=0.032). However, we observed significant, mainly positive, associations between BP indexes and 45 microbial genera (P<0.05), of which 27 belong to the phylum Firmicutes. Interestingly, we found mostly negative associations between 19 distinct Lactobacillus species and BP indexes (P<0.05). Of these, greater abundance of the known probiotic Lactobacillus paracasei was associated with lower mean arterial pressure and lower dietary sodium intake (P<0.001 for both).
Conclusions
Although the associations between overall gut taxonomic composition and BP are weak, individuals with hypertension demonstrate changes in several genera. We demonstrate strong negative associations of certain Lactobacillus species with sodium intake and BP, highlighting the need for experimental studies.
Keywords: blood pressure, gastrointestinal microbiota, hypertension, Lactobacillus, salt intake
Subject Categories: Hypertension, Epidemiology
Nonstandard Abbreviations and Acronyms
- BP
blood pressure
- CARDIA
Coronary Artery Risk Development in Young Adults
- ICD‐8
International Classification of Diseases, Eighth Revision
- ICD‐9
International Classification of Diseases, Ninth Revision
- ICD‐10
International Classification of Diseases, Tenth Revision
- KO
Kyoto Encyclopedia of Genes and Genomes Orthology group
Clinical Perspective
What Is New?
We advance the prior scarce and conflicting knowledge on the associations between gastrointestinal microbes and hypertension in a large, representative population sample using standardized blood pressure measurements, adjustment for relevant confounders, and stool metagenomic sequencing.
Although the associations between overall gut taxonomic composition and blood pressure are weak, individuals with hypertension demonstrate changes in several microbiota genera, with most of these genera belonging to the Firmicutes phylum.
Interestingly, we also demonstrate strong negative associations of certain Lactobacillus species with both dietary sodium intake and blood pressure.
What Are the Clinical Implications?
The observed associations between the gut microbial composition and hypertension offer novel insights on the potential mechanisms through which diet affects the gut microbiome and blood pressure.
Dysbiosis of the gut microbiota has been recently linked to various chronic diseases, such as obesity, metabolic syndrome, diabetes mellitus, 1 and cardiovascular disease, 2 and changes in lifestyle. 3 Additional evidence, primarily from animal studies, suggests an association between microbiota and hypertension. 4 , 5 , 6 , 7 Furthermore, high salt intake, a risk factor for both hypertension and cardiovascular disease, was shown to deplete certain Lactobacillus species in mice while treating the mice with Lactobacillus prevented salt‐sensitive hypertension. 8 Findings from these studies are consistent with those from human studies, in which consumption of salted snacks has been indicated as a significant correlate of the human gut microbiota. 9 In addition, the gut microbiota has been functionally linked to complications of hypertension, such as arterial thrombosis. 10 , 11 , 12 These prior results therefore highlight the potential of the gut microbiota as a therapeutic target for hypertension.
Despite these promising results from animal studies, human data are scarce and conflicting. In the TwinsUK cohort, 13 self‐reported hypertension was not related to 68 various microbiota markers. In another publication based on a subsample of 529 CARDIA (Coronary Artery Risk Development in Young Adults) study participants, 14 an SD increase in gut microbiota α (within‐sample) diversity was related to a modest 1.29 mm Hg lower systolic blood pressure (BP; P=0.049). In a commentary, Jama and coauthors 15 proposed several improvements in the experimental design of future studies examining the relation between the microbiota and hypertension, such as the use of standardized BP measurements, adjustment for medication use, and replacing 16S rRNA profiling with metagenome sequencing.
Herein, we aim to advance the current knowledge on the association between the gut metagenome and BP in a well‐phenotyped, large random population sample of 6953 individuals while adjusting for relevant confounders, including antihypertensive medication classes. A 24‐hour urine sodium sample was available for 829 individuals. We therefore also performed a more focused analysis on the interrelations between sodium intake, gut Lactobacillus abundance, and BP to gain additional insight on the potential mechanisms through which the microbiota might affect BP. 8
Methods
Availability of Data and Materials
The data that support the findings of this study are available from Finnish Institute for Health and Welfare Biobank (https://thl.fi/en/web/thl‐biobank). The data are not publicly available because they contain information that could compromise research participant privacy/consent. The source code for the analyses is openly available at 10.5281/zenodo.3622730.
Study Sample
The Finnish Institute for Health and Welfare has performed population surveys every 5 years since 1972 to monitor the development of cardiovascular risk factors in the Finnish population. 16 A random population sample of 13 437 individuals, aged 25 to 74 years, from 6 geographic regions was invited to take part in the FINRISK 2002 study. 17 Of the 8799 individuals who took part in the FINRISK 2002 study (participation rate, 65.5%), we excluded 1568 who did not provide stool samples, 20 because of low total read count (N<50 000), and 258 because of missing relevant covariates, for a final study sample of 6953 individuals who were included in the analysis. For a subsample of 829 participants, 24‐hour urine collection for estimating dietary sodium intake was performed. 18 The study was approved by the Coordinating Ethics Committee of the Helsinki and Uusimaa University Hospital District, and all participants gave written informed consent.
Health Examination and 24‐Hour Urine Collection
After completing a questionnaire on sociodemographic information, lifestyles, medications, and medical history at home, the participants attended a physical examination at a local study site. The participants underwent measurements for height and weight. A nurse measured sitting BP 2 times from the right arm using a mercury manometer and a 14×40‐cm cuff after a 5‐minute rest. Participants in the 24‐hour urinary sodium subsample were instructed to start the collection on a Sunday morning and return the container the following day. A sample of urine was frozen at −20°C and later analyzed using an ion‐selective electrode (Optima analyzer; Thermo Electron Oy, Vantaa, Finland). 18 Urine sodium excretion was calculated as the product of urine sodium concentration and daily excreted urinary volume.
Stool Sampling and Storage
Stool samples were collected at home after the physical examination in 50‐mL Falcon tubes and were mailed to Finnish Institute for Health and Welfare using prepaid packages over 1 to 2 days. The samples were then frozen in −20°C and kept unthawed until 2017, when they underwent metagenomic sequencing.
Stool DNA Extraction and Library Preparation
Microbiota analysis was performed at the University of California, San Diego, using whole genome untargeted shallow shotgun metagenomic sequencing against mapped reference databases, following a previously published protocol. 19 In brief, Illumina‐compatible libraries were prepared from isolated DNA and normalized to 5‐ng input per sample. Samples were pooled using the iTru 20 dual‐indexing system and sequenced using Illumina Hi‐Seq 4000 for paired‐end 150‐bp reads. Sequence reads were mapped against taxonomy using SHOGUN v1.0.5 against National Center for Biotechnology Information RefSeq database (version 82; May 8, 2017). 21 , 22 Functional profiles were calculated from a combination of observed and predicted Kyoto Encyclopedia of Genes and Genomes Orthology group (KO) annotations from the RefSeq genomes following the predicted parameters of the SHOGUN tool. 21
Outcome Variables and Covariates
The mean of the 2 measurements was used to determine systolic and diastolic BP. Hypertension was defined as systolic BP ≥140 mm Hg, diastolic BP ≥90 mm Hg, or use of antihypertensive medication. Pulse pressure was defined as systolic minus diastolic BP. Mean arterial pressure was defined as follows: [(2×diastolic BP)+systolic BP]/3.
Body mass index was defined as weight (kilograms) divided by the square of the body height (meters). Participants were asked to assess their leisure‐time physical activity by a 4‐option multiple choice question. The 4 options for leisure‐time activity were (1) sedentary, (2) light activity for >4 hours per week, (3) fitness training or other strenuous exercise for >3 hours per week, and (4) competitive sports. Information on medication use was retrieved from the Finnish national Drug Purchase Register, 23 which captures all prescription drug purchases in Finland. Finnish pharmacies fill prescriptions for a maximum of 3 months, and antihypertensive medication use was defined as a drug purchase occurring within the 4 months preceding baseline. Medications with the following Anatomical Therapeutic Chemical classification 24 codes were considered antihypertensive medications: diuretics (C03*), β blockers (C07*), calcium channel blockers (C08*), and renin–angiotensin system inhibitors (C09*). Prevalent diabetes mellitus was defined as self‐reported diabetes mellitus, a previous diagnostic code indicating diabetes mellitus in the nationwide Care Register for Health Care (International Classification of Diseases, Tenth Revision [ICD‐10], codes E10‐E14 or International Classification of Diseases, Eighth Revision/International Classification of Diseases, Ninth Revision [ICD‐8/ICD‐9], code 250), a previous diabetes mellitus medication purchase (Anatomical Therapeutic Chemical classification code A10*), or special reimbursement code for diabetes mellitus medications in the Drug Reimbursement Register. Smoking was defined by self‐reported current daily smoking.
Statistical Analysis
We compared characteristics between individuals who were and were not included in the urinary sodium subsample using the 2‐sample T test and the χ2 test of equality of means. Unless otherwise noted, we adjusted the analyses for age, sex, body mass index, smoking, exercise, diabetes mellitus, diuretic use, β‐blocker use, calcium channel blocker use, and renin‐angiotensin system inhibitor. We calculated α diversity (Shannon index) using species‐level data with the R package microbiome. 25 We calculated the dissimilarity matrix (β diversity) and principal coordinates using Bray‐Curtis dissimilarity on compositional microbial species‐level abundance using R packages Phyloseq 26 and Vegan. 27 The α diversity is a measure of within‐sample diversity (eg, number of microbial species observed or number of questions needed on average to identify random microbe within sample), and the β diversity is a measure of between‐sample diversity (eg, euclidean distance, where each axis represents single species or ratio of number of species shared and number of species in total). We analyzed the associations between β diversity and BP variables using permutational multivariate ANOVA with 999 permutations. We studied common microbial genera (prevalent in at least 1% of sample population with a relative abundance >0.1%) using DESeq2 with the Benjamini‐Hochberg correction. 28 , 29 We analyzed associations of the genera with (1) BP indexes and (2) 24‐hour urinary sodium excretion. We further studied the association between Lactobacillus and BP in subgroups by sex and antihypertensive medication. We performed more focused analysis for the detected Lactobacillus species, replicating the previous 2 steps. We log(x+1) transformed the KO groups. We used fully adjusted linear regression models to estimate the associations between KO groups and systolic BP. We visualized separately the associations between KO groups and systolic BP using the FuncTree package. 30 For the module, pathway, and biological process layers, we used node sizes that corresponded to the average inverse P value of all KO groups that could be assigned to that node. The source code for the analyses is openly available at 10.5281/zenodo.3622730. 31 We used R 32 version 3.6.0 for all statistical analyses.
Results
The characteristics of the main study sample and the 24‐hour urinary sodium subsample are reported in Table 1. A small, but statistically significant, difference between the 2 samples was observed for age (P<0.001), diastolic BP (P=0.001), pulse pressure (P<0.001), heavy exercise (P=0.011), β‐blocker use (P=0.046), and renin‐angiotensin system blocker use (P=0.030). We observed 134 Lactobacillus species (Table S1) and 91 common microbial genera (4.7% of all available genera; Table S2).
Table 1.
Characteristics of the Study Sample
| Characteristics | All | Urinary Sodium Subsample | P Value |
|---|---|---|---|
| No. | 6953 | 829 | |
| Age, mean (SD), y | 49.2 (12.88) | 47.2 (10.94) | <0.001 |
| Women, N (%) | 3819 (54.9) | 460 (55.5) | 0.720 |
| BMI, mean (SD), kg/m2 | 27.0 (4.66) | 26.7 (4.54) | 0.117 |
| Systolic BP, mean (SD), mm Hg | 135.6 (20.20) | 134.6 (18.65) | 0.113 |
| Diastolic BP, mean (SD), mm Hg | 79.1 (11.23) | 80.3 (11.12) | 0.001 |
| Pulse pressure, mean (SD), mm Hg | 56.5 (16.39) | 54.4 (14.16) | <0.001 |
| Arterial pressure, mean (SD), mm Hg | 97.9 (12.67) | 98.4 (12.40) | 0.263 |
| Hypertension, N (%) | 3291 (47.3) | 378 (45.6) | 0.283 |
| Current smoker, N (%) | 1637 (23.5) | 210 (25.3) | 0.189 |
| Diabetes mellitus, N (%) | 390 (5.6) | 36 (4.3) | 0.081 |
| Exercise, N (%) | |||
| Light | 1466 (21.1) | 167 (20.1) | 0.545 |
| Moderate | 3922 (56.4) | 445 (53.7) | 0.109 |
| Heavy | 1565 (22.5) | 217 (26.2) | 0.011 |
| Antihypertensive medication, N (%) | 1253 (18.0) | 122 (14.7) | |
| Diuretics | 232 (3.3) | 20 (2.4) | 0.145 |
| β Blockers | 714 (10.3) | 68 (8.2) | 0.046 |
| Calcium channel blockers | 293 (4.2) | 32 (3.9) | 0.670 |
| RAS blockers | 569 (8.2) | 51 (6.2) | 0.030 |
Continuous variables are presented as mean (SD), and categorical values are presented as count (percentage). Characteristics between individuals who were and were not included in the urinary sodium subsample were compared using the 2‐sample T test and the χ2 test of equality of means. BP indicates blood pressure; BMI, body mass index; and RAS, renin‐angiotensin system.
In models adjusted for age and sex (Figure 1, Table S3), an SD increase in microbiota α diversity was inversely associated with systolic BP (effect size, −0.54 mm Hg; 95% CI, −0.96 to −0.12 mm Hg; P=0.012), diastolic BP (effect size, −0.31 mm Hg; 95% CI, −0.56 to −0.06 mm Hg; P=0.016), mean arterial pressure (effect size, −0.39 mm Hg; 95% CI, −0.66 to −0.12 mm Hg; P=0.005), and hypertension (odds ratio, 0.91; 95% CI, 0.86–0.96; P<0.001). However, α diversity was not related to any BP variable in the multivariable‐adjusted models (Figure 1, Table S3).
Figure 1. Associations between blood pressure (BP) variables and microbial diversity.

The blue heat maps on the left express the change in BP variables per 1‐SD increase in α diversity (Shannon index); log odds are reported for hypertension. The bar plots on the right represent the proportion of variability (R 2) in β diversity (Bray‐Curtis distance) explained by BP indexes. Multivariable‐adjusted model is adjusted for age, sex, body mass index, smoking, exercise, diuretics, β blockers, calcium channel blockers, and renin‐angiotensin system blockers. Significant results are marked with asterisk (P<0.05). α indicates effect size for α diversity; and MAP, mean arterial pressure.
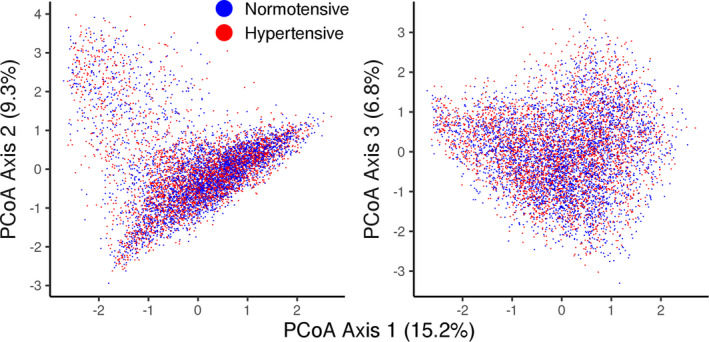
In the age‐ and sex‐adjusted models, all BP indexes were significantly associated with β diversity (P≤0.038 for all; Figure 1, Table S4). The coefficients of determination between β diversity and BP variables varied between 0.02% and 0.06%. In multivariable‐adjusted models, only diastolic BP (R 2=0.02%; P=0.032) was significantly related to β diversity (Figure 1, Table S4). The first 3 principal coordinate axes explained 31.3% of the variation in bacterial abundances, but visual inspection did not reveal clustering of hypertensive and normotensive individuals (Figure 2).
Figure 2. Principal coordinate analysis (PCoA) for species‐level bacterial abundances (Bray‐Curtis distance).
We then studied the associations between genus‐level abundances and BP indexes. We observed 122 significant associations between 45 distinct microbial genera and BP indexes with false discovery rate–corrected P<0.05 (Figure 3, Table S5). These associations are shown in subgroups by sex and antihypertensive medication use in Figures S1 and S2. The results differed by subgroup for several species. Of all covariates, inclusion of body mass index in the age‐ and sex‐adjusted model resulted in most of the reduction (from 39 to 23; 59%) in the number of significant genera‐hypertension associations. The association between the Lactobacillus genus and BP indexes was nonsignificant, but species‐level analyses revealed 41 significant associations for 19 (14.0%) distinct Lactobacillus species with false discovery rate–corrected P<0.05. Of these associations, 12 were positive and 29 were negative (Figure 3, Table S6). We observed 481 KO groups associated with systolic BP (false discovery rate–corrected P<0.05; Table S7). Internal node calculation revealed that several of the most prominent pathways were related to lipid metabolism, gluconeogenesis, and xenobiotic metabolism (Figure S3).
Figure 3. Associations for common microbial genera and Lactobacillus species with blood pressure (BP) indexes.
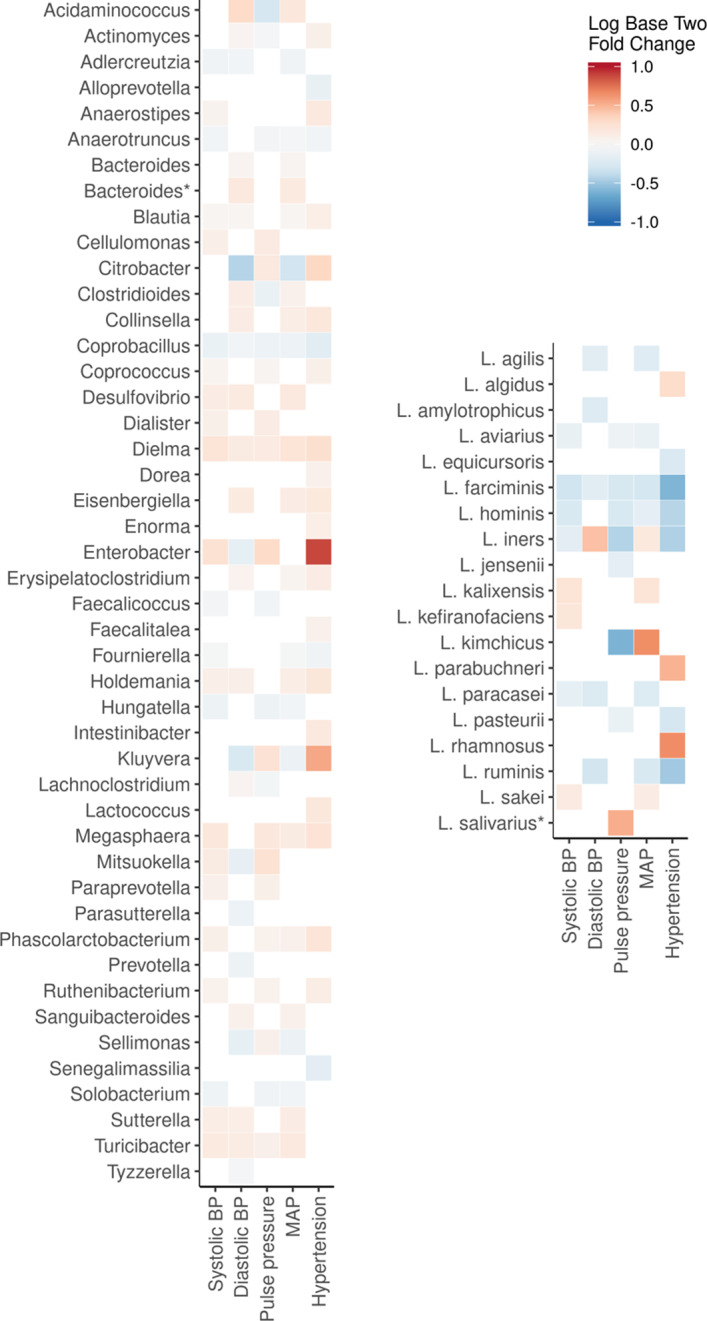
We observed 45 distinct microbial genera and 19 Lactobacillus species that were significantly associated with BP indexes using DESeq2 (P<0.05 for all). The heat map expresses the fold change associated with BP indexes in base 2 logarithm ratios of microbial abundances. For hypertension, the range signifies a change of microbial abundance from 0.5 (blue) to 2 (red) times the bacterial abundance in normotensive participants. For continuous variables, the fold change is expressed per 1‐SD change in BP variable. The models are adjusted for age, sex, body mass index, smoking, exercise, diuretics, β blockers, calcium channel blockers, and renin‐angiotensin system blockers. Association with bacterial plasmid is denoted using asterisk. MAP indicates mean arterial pressure.
Finally, we performed a more focused analysis on the association between genus‐ and species‐level Lactobacillus abundances and sodium intake in the subsample of participants with 24‐hour urinary sodium excretion (mean, 142.3±62.9 mmol) data available. Lactobacillus prevalence was 15.5% at the detection limit of 0.1% relative abundance in this subsample. Lactobacillus genus was not associated with 24‐hour urinary sodium excretion (false discovery rate–corrected P=0.984; Figure 4). At the species level (Figure 4), Lactobacillus paracasei demonstrated a strong, negative association with (log2 fold change, −0.018±0.002; P<0.001) urinary sodium excretion. Lactobacillus salivarius was positively (log2 fold change, 0.007±0.002; P=0.004) associated with urinary sodium excretion.
Figure 4. Lactobacillus abundance in groups by 24‐hour urinary sodium excretion.
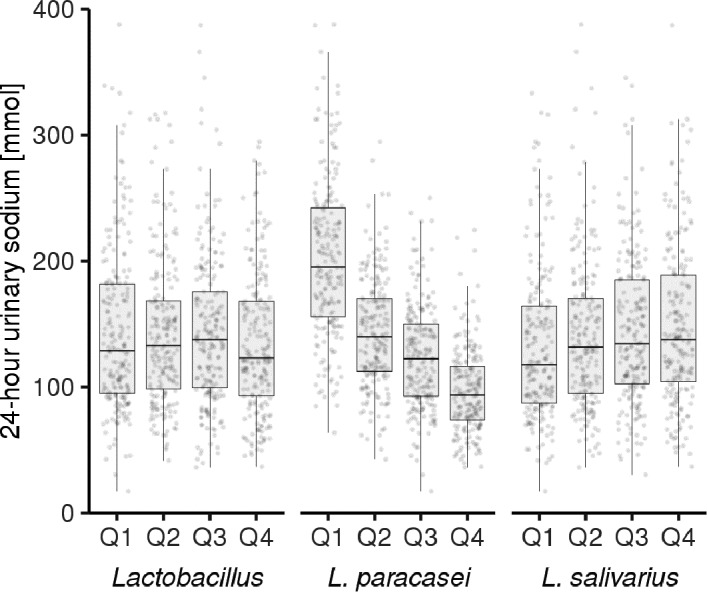
We observed significant association between 24‐hour urinary sodium excretion and two Lactobacillus species with false discovery rate–corrected P<0.05 while the genus‐level association remained insignificant. For Lactobacillus paracasei (log2 fold change, −0.018±0.002; P<0.001), the 24‐hour urinary sodium excretion levels were as follows: quartile (Q) 1, 205.4±68.5 mmol; Q2, 143.0±43.8 mmol; Q3, 123.9±41.1 mmol; and Q4, 96.6±33.7 mmol. For Lactobacillus salivarius (log2 fold change, 0.007±0.002; P=0.004), the 24‐hour urinary sodium excretion levels were as follows: Q1, 132.7±60.3 mmol; Q2, 142.3±63.3 mmol; Q3, 144.0±58.3 mmol; and Q4, 150.1±68.6 mmol. We visualize the associations using quartiles of DESeq2‐fitted abundances against 24‐hour urinary sodium.
Discussion
We investigated the relation between the gut metagenome and objectively measured BP in a large, representative population cohort while adjusting for relevant confounding factors. In age‐ and sex‐adjusted models, we observed strong associations between overall gut taxonomic composition and BP. However, these associations were weaker in multivariable‐adjusted models. We observed significant associations between 45 distinct microbial genera and BP indexes, of which 27 belong to the phylum Firmicutes. Interestingly, certain Lactobacillus species demonstrated strong associations with both BP indexes and 24‐hour urinary sodium excretion. Our functional analysis suggests that microbiome‐driven processes associated with lipid metabolism, gluconeogenesis, and xenobiotic metabolism may be associated with BP. However, experimental designs with deep microbiome sequencing are needed for more detailed information on the causal/functional mechanisms and, ultimately, the clinical significance of our findings.
Several prior animal studies have suggested an association between intestinal dysbiosis and hypertension. 4 A lower gut microbiota α diversity was reported among hypertensive cases in a small case‐control study with a study sample of 11 rats and 17 human patients. 5 In another experimental study by Adnan et al, 6 6 normotensive rats were gavaged with microbiota from hypertensive rats, which led to increases in the Firmicutes/Bacteroides ratio and systolic BP. Finally, Durgan et al 33 suggested that a causal relationship between gut microbial dysbiosis and obstructive sleep apnea–induced hypertension could exist in groups of 6 to 9 rats allocated to high‐fat and normal chow diet. These early animal studies have suggested that gut dysbiosis and hypertension could be causally related, offering a basis for large‐scale epidemiological studies in humans.
Two previous cohort studies have assessed the association between 16S rRNA‐sequenced gut microbiota and hypertension in humans. Jackson et al 13 studied the link between gut microbiota markers and self‐reported common diseases in a sample of 2737 TwinsUK study participants. However, no associations were observed between 68 various microbiota markers and self‐declared hypertension after correcting for multiple testing. As previously noted, 15 the prevalence of self‐reported hypertension (27.6%) in TwinsUK was lower than expected and, therefore, the lack of objective BP measurements could explain these nonsignificant results. In another study by Sun et al, 14 the authors examined the association between gut microbiota and objectively measured BP in 529 CARDIA study participants. This study reported a negative association between gut microbial α diversity and systolic BP. The authors also observed a single significant genus‐level association between systolic BP and Robinsoniella, which was not included in common microbial genera (prevalence, ≥1%; abundance, ≥0.1%) used in this study. Our study builds on these earlier efforts through the use of shotgun metagenomic sequencing and a large, representative study sample with detailed drug purchase data, standardized BP measurements, and adequate statistical power. Although the multivariable‐adjusted associations between overall gut taxonomic composition and BP observed in our study were small, we demonstrate mainly positive associations between 45 microbial genera and BP indexes. A total of 27 of these 45 genera belong to the phylum Firmicutes, highlighting the previously observed potentially harmful links of increased Firmicutes with hypertension, obesity, diabetes mellitus, and chronic kidney disease. 5 , 34
In a previous publication, Wilck et al 8 studied the effects of high dietary salt intake on gut‐immune axis through induction of interleukin‐17A–producing T‐helper 17 cells, which can also contribute to hypertension. The authors reported that Lactobacillus murinus was depleted by high dietary salt in mouse models, whereas L murinus treatment prevented salt‐sensitive hypertension by modulating T‐helper 17 cells. In the same study, markedly increased salt intake also led to reduced Lactobacillus species abundance, increased T‐helper 17 cell levels, and increased BP in a small sample of 12 men and women. In line with the results by Wilck et al,8 we observed mainly negative, but also positive, associations between Lactobacillus species and BP indexes. Although the Lactobacillus genus was not associated with 24‐hour urinary sodium excretion, we observed a strong association between an increased L paracasei abundance and decreased urinary sodium excretion (P<0.001; Figure 4). A positive association between L salivarius and sodium excretion was also observed (P=0.004). The directions of the effects for both Lactobacillus species were consistent in models for BP and dietary sodium. However, the Lactobacillus‐related results were somewhat different in subgroups by sex and antihypertensive medication use. In particular, the association between L paracasei and BP was stronger in women. The association between L paracasei and BP was observed in users and nonusers of antihypertensive medications. The underlying mechanisms of these associations require further study, but the probiotic supplementation with L paracasei has been previously shown to reduce interleukin‐17 levels in acutely ill patients and Lactobacillus casei group on the whole to induce potential weight loss. 35 , 36
Although our study has several advantages, our results must be interpreted in the context of their limitations. First, although fecal sampling is a noninvasive and feasible method for assessing microbiota, it is only a proxy for the gut microbiota. In particular, the stable microbial niche in mucosal layer of the gastrointestinal tract could account for major physiological effects with minor contribution to stool sampling. 37 Second, the relatively long storage time of the samples (15 years at −20°C) could lead to some deterioration of the samples. However, the taxonomic composition of our samples was similar to what has been previously observed in larger cohort studies. 19 Third, metagenomics is a novel field with reported limitations (eg, those related to sequencing and labeling DNA in stool samples). 38 Fourth, despite 24‐hour urine collection being a more accurate method for estimating sodium intake than spot urine samples, it remains a cross‐sectional snapshot of dietary habits. 39 Fifth, the hypertensive participants of our study may have received instructions to reduce their sodium intake, leading to weaker or reverse causation.
Conclusions
This study is by far the largest to examine the association between human gut microbiota and objectively measured BP. Although the associations between overall gut taxonomic composition and BP are weak, individuals with hypertension demonstrate changes in several microbiota genera, with most of these genera belonging to the Firmicutes phylum. Interestingly, we also demonstrate strong negative associations of certain Lactobacillus species with both dietary sodium intake and BP (Figures 3 and 4). This finding provides additional population‐level evidence to those from experimental studies demonstrating that distinct Lactobacillus species are depleted by high dietary salt, whereas treatment with these same species might prevent salt‐sensitive hypertension. 8 Our research needs to be expanded (1) by estimating the effect of the reported associations for public health, (2) by determining the functional role of gut microbiota by combining taxonomic profiling with simultaneous determination of the gut and plasma metabolome, and (3) by conducting additional studies that directly manipulate Lactobacillus species levels in the gut to establish the causal relation between these species and hypertension. The observed associations between the gut microbial composition and hypertension offer novel insights on the potential mechanisms through which diet affects the gut microbiome and BP. In addition, our results raise hypotheses on how the microbiome could be manipulated to improve hypertension control.
Sources of Funding
Dr Niiranen was funded by Emil Aaltonen Foundation, Paavo Nurmi Foundation, Finnish Medical Foundation, and Academy of Finland, grant 321351. Dr Lahti was funded by Academy of Finland, grants 295741 and 307127. Dr Salomaa was supported by the Finnish Foundation for Cardiovascular Research. Dr Havulinna was supported by Academy of Finland, grant 321356. Dr Jain was supported in part by grants from the National Institutes of Health (NIH), including NIH S10OD020025 and R01ES027595. Dr Cheng was supported by NIH grants R01‐HL134168, R01‐HL131532, R01‐HL143227, and R01‐HL142983. The funding bodies had no role in the design of the study, in collection, analysis, and interpretation of data, and in writing the article.
Disclosures
Dr Salomaa has received honoraria from Novo Nordisk and Sanofi for consultations. He also has ongoing research collaboration with Bayer Ltd (all unrelated to the present study). The remaining authors have no disclosures to report.
Supporting information
Tables S1–S7
Figures S1–S3
Acknowledgments
We thank the participants and staff of the FINRISK 2002 study. We thank Illumina, Inc, and Janssen Pharmaceutica for their support of the Center for Microbiome Innovation at University of California, San Diego. We thank Ville Laitinen for the assistance with functional analyses used in this article.
Author contributions: Drs Salomaa, Knight, Lahti, and Niiranen designed the work; Drs Havulinna, Jain, Salido, Sanders, Brennan, Humphrey, Vartiainen, Laatikainen, Jousilahti, and Salomaa acquired the data; Drs Palmu, Salosensaari, Sanders, Lahti, and Niiranen analyzed the data; and Drs Cheng, Inouye, Jain, Jousilahti, Salomaa, Knight, Lahti, and Niiranen supervised the work. All authors wrote the article and gave final approval of the version to be published.
(J Am Heart Assoc. 2020;9:e016641 DOI: 10.1161/JAHA.120.016641.)
For Sources of Funding and Disclosures, see page 8.
References
- 1. Qin J, Li Y, Cai Z, Li S, Zhu J, Zhang F, Liang S, Zhang W, Guan Y, Shen D, et al. A metagenome‐wide association study of gut microbiota in type 2 diabetes. Nature. 2012;490:55–60. [DOI] [PubMed] [Google Scholar]
- 2. Wang Z, Klipfell E, Bennett BJ, Koeth R, Levison BS, Dugar B, Feldstein AE, Britt EB, Fu X, Chung Y‐M, et al. Gut flora metabolism of phosphatidylcholine promotes cardiovascular disease. Nature. 2011;472:57–63. [DOI] [PMC free article] [PubMed] [Google Scholar]
- 3. O’Keefe SJD, Li JV, Lahti L, Ou J, Carbonero F, Mohammed K, Posma JM, Kinross J, Wahl E, Ruder E, et al. Fat, fibre and cancer risk in African Americans and rural Africans. Nat Commun. 2015;6:6342. [DOI] [PMC free article] [PubMed] [Google Scholar]
- 4. Richards EM, Pepine CJ, Raizada MK, Kim S. The gut, its microbiome, and hypertension. Curr Hypertens Rep. 2017;19:36. [DOI] [PMC free article] [PubMed] [Google Scholar]
- 5. Yang T, Santisteban MM, Vermali R, Li E, Ahmari N, Carvajal JM, Zadeh M, Gong M, Qi Y, Zubcevic J, et al. Gut dysbiosis is linked to hypertension. Hypertension. 2015;65:1331–1340. [DOI] [PMC free article] [PubMed] [Google Scholar]
- 6. Adnan S, Nelson JW, Ajami NJ, Venna VR, Petrosino JF, Bryan RM, Durgan DJ. Alterations in the gut microbiota can elicit hypertension in rats. Physiol Genomics. 2016;49:96–104. [DOI] [PMC free article] [PubMed] [Google Scholar]
- 7. Vijay‐Kumar M, Aitken JD, Carvalho FA, Cullender TC, Mwangi S, Srinivasan S, Sitaraman SV, Knight R, Ley RE, Gewirtz AT. Metabolic syndrome and altered gut microbiota in mice lacking toll‐like receptor 5. Science. 2010;328:228–231. [DOI] [PMC free article] [PubMed] [Google Scholar]
- 8. Wilck N, Matus MG, Kearney SM, Olesen SW, Forslund K, Bartolomaeus H, Haase S, Mähler A, Balogh A, Markó L, et al. Salt‐responsive gut commensal modulates T H 17 axis and disease. Nature. 2017;551:585–589. [DOI] [PMC free article] [PubMed] [Google Scholar]
- 9. McDonald D, Hyde E, Debelius JW, Morton JT, Gonzalez A, Ackermann G, Aksenov AA, Behsaz B, Brennan C, Chen Y, et al. American gut: an open platform for citizen science microbiome research. mSystems. 2018;3:e00031 ‐18 DOI: 10.1128/mSystems.00031‐18. [DOI] [PMC free article] [PubMed] [Google Scholar]
- 10. Jäckel S, Kiouptsi K, Lillich M, Hendrikx T, Khandagale A, Kollar B, Hörmann N, Reiss C, Subramaniam S, Wilms E, et al. Gut microbiota regulate hepatic von Willebrand factor synthesis and arterial thrombus formation via Toll‐like receptor‐2. Blood. 2017;130:542–553. [DOI] [PubMed] [Google Scholar]
- 11. Kiouptsi K, Jäckel S, Pontarollo G, Grill A, Kuijpers MJE, Wilms E, Weber C, Sommer F, Nagy M, Neideck C, et al. The microbiota promotes arterial thrombosis in low‐density lipoprotein receptor‐deficient mice. mBio. 2019;10:e02298 ‐19 DOI: 10.1128/mBio.02298‐19. [DOI] [PMC free article] [PubMed] [Google Scholar]
- 12. Zhu W, Gregory JC, Org E, Buffa JA, Gupta N, Wang Z, Li L, Fu X, Wu Y, Mehrabian M, et al. Gut microbial metabolite TMAO enhances platelet hyperreactivity and thrombosis risk. Cell. 2016;165:111–124. [DOI] [PMC free article] [PubMed] [Google Scholar]
- 13. Jackson MA, Verdi S, Maxan M‐E, Shin CM, Zierer J, Bowyer RCE, Martin T, Williams FMK, Menni C, Bell JT, et al. Gut microbiota associations with common diseases and prescription medications in a population‐based cohort. Nat Commun. 2018;9:1–8. [DOI] [PMC free article] [PubMed] [Google Scholar]
- 14. Sun S, Lulla A, Sioda M, Winglee K, Wu MC, Jacobs DR, Shikany JM, Lloyd‐Jones DM, Launer LJ, Fodor AA, et al. Gut microbiota composition and blood pressure: the CARDIA study. Hypertension. 2019;73:998–1006. [DOI] [PMC free article] [PubMed] [Google Scholar]
- 15. Jama H, Kaye DM, Marques FZ. Population‐based gut microbiome associations with hypertension. Circ Res. 2018;123:1185–1187. [DOI] [PubMed] [Google Scholar]
- 16. Borodulin K, Vartiainen E, Peltonen M, Jousilahti P, Juolevi A, Laatikainen T, Mannisto S, Salomaa V, Sundvall J, Puska P. Forty‐year trends in cardiovascular risk factors in Finland. Eur J Public Health. 2015;25:539–546. [DOI] [PubMed] [Google Scholar]
- 17. Havulinna AS, Sysi‐Aho M, Hilvo M, Kauhanen D, Hurme R, Ekroos K, Salomaa V, Laaksonen R. Circulating ceramides predict cardiovascular outcomes in the population‐based FINRISK 2002 cohort. Arterioscler Thromb Vasc Biol. 2016;36:2424–2430. [DOI] [PubMed] [Google Scholar]
- 18. Laatikainen T, Pietinen P, Valsta L, Sundvall J, Reinivuo H, Tuomilehto J. Sodium in the Finnish diet: 20‐year trends in urinary sodium excretion among the adult population. Eur J Clin Nutr. 2006;60:965–970. [DOI] [PubMed] [Google Scholar]
- 19. Salosensaari A, Laitinen V, Havulinna AS, Meric G, Cheng S, Perola M, Valsta L, Alfthan G, Inouye M, Watrous JD, et al. Taxonomic signatures of long‐term mortality risk in human gut microbiota. medRxiv. 2020. DOI: 2019.12.30.19015842 [DOI] [PMC free article] [PubMed] [Google Scholar]
- 20. Glenn TC, Nilsen RA, Kieran TJ, Sanders JG, Bayona‐Vásquez NJ, Finger JW, Pierson TW, Bentley KE, Hoffberg SL, Louha S, et al. Adapterama I: universal stubs and primers for 384 unique dual‐indexed or 147,456 combinatorially‐indexed Illumina libraries (iTru & iNext). PeerJ. 2019;7:e7755. [DOI] [PMC free article] [PubMed] [Google Scholar]
- 21. Hillmann B, Al‐Ghalith GA, Shields‐Cutler RR, Zhu Q, Gohl DM, Beckman KB, Knight R, Knights D. Evaluating the information content of shallow shotgun metagenomics. mSystems. 2018;3:e00069 ‐18. [DOI] [PMC free article] [PubMed] [Google Scholar]
- 22. O’Leary NA, Wright MW, Brister JR, Ciufo S, Haddad D, McVeigh R, Rajput B, Robbertse B, Smith‐White B, Ako‐Adjei D, et al. Reference sequence (RefSeq) database at NCBI: current status, taxonomic expansion, and functional annotation. Nucleic Acids Res. 2016;44:D733–D745. [DOI] [PMC free article] [PubMed] [Google Scholar]
- 23. Statistics on reimbursements for prescription medicines. The Social Insurance Institution of Finland (Kela). https://www.kela.fi/web/en/492. Accessed August 5, 2019.
- 24. ATC Structure and Principles . WHO Collaborating Centre for Drug Statistics Methodology. https://www.whocc.no/atc/structure_and_principles/. Accessed August 5, 2019.
- 25. Lahti L, Shetty S. Tools for microbiome analysis in R: version 1.6.0. 2017. Available at: http://microbiome.github.com/microbiome. Accessed May 2, 2019.
- 26. McMurdie PJ, Holmes S. phyloseq: an R package for reproducible interactive analysis and graphics of microbiome census data. PLoS One. 2013;8:e61217. [DOI] [PMC free article] [PubMed] [Google Scholar]
- 27. Oksanen J, Blanchet FG, Friendly M, Kindt R, Legendre P, McGlinn D, Minchin PR, O’Hara RB, Simpson GL, Solymos P, et al. The Vegan package: version 2.5.6. 2007. https://CRAN.R‐project.org/package=vegan.Accessed April 24, 2019.
- 28. Love MI, Huber W, Anders S. Moderated estimation of fold change and dispersion for RNA‐seq data with DESeq2. Genome Biol. 2014;15:550. [DOI] [PMC free article] [PubMed] [Google Scholar]
- 29. Benjamini Y, Hochberg Y. Controlling the false discovery rate: a practical and powerful approach to multiple testing. J R Stat Soc Ser B Methodol. 1995;57:289–300. [Google Scholar]
- 30. Uchiyama T, Irie M, Mori H, Kurokawa K, Yamada T. FuncTree: functional analysis and visualization for large‐scale omics data. PLoS One. 2015;10:e0126967. [DOI] [PMC free article] [PubMed] [Google Scholar]
- 31. Palmu J, Salosensaari A, Lahti L, Niiranen T. RRgutbiota: source code for the manuscript association between gut microbiota and blood pressure in a population cohort of 6953 individuals: version 1.6. Zenodo; 2020. DOI: 10.5281/zenodo.3622730. Accessed June 24, 2020. [Google Scholar]
- 32. R Core Team . R: A Language and Environment for Statistical Computing: Version 3.6.0. R Foundation for Statistical Computing; 2017. https://www.R‐project.org/. Accessed May 2, 2019. [Google Scholar]
- 33. Durgan DJ, Ganesh BP, Cope JL, Ajami NJ, Phillips SC, Petrosino JF, Hollister EB, Bryan RM. Role of the gut microbiome in obstructive sleep apnea‐induced hypertension. Hypertension. 2016;67:469–474. [DOI] [PMC free article] [PubMed] [Google Scholar]
- 34. Tang WHW, Kitai T, Hazen SL. Gut microbiota in cardiovascular health and disease. Circ Res. 2017;120:1183–1196. [DOI] [PMC free article] [PubMed] [Google Scholar]
- 35. Angurana SK, Bansal A, Singhi S, Aggarwal R, Jayashree M, Salaria M, Mangat NK. Evaluation of effect of probiotics on cytokine levels in critically ill children with severe sepsis: a double‐blind, placebo‐controlled trial. Crit Care Med. 2018;46:1656–1664. [DOI] [PubMed] [Google Scholar]
- 36. Hill D, Sugrue I, Tobin C, Hill C, Stanton C, Ross RP. The Lactobacillus casei group: history and health related applications. Front Microbiol. 2018;9:2107 DOI: 10.3389/fmicb.2018.02107. [DOI] [PMC free article] [PubMed] [Google Scholar]
- 37. Claesson MJ, Clooney AG, O’Toole PW. A clinician’s guide to microbiome analysis. Nat Rev Gastroenterol Hepatol. 2017;14:585–595. [DOI] [PubMed] [Google Scholar]
- 38. Thomas AM, Segata N. Multiple levels of the unknown in microbiome research. BMC Biol. 2019;17:48. [DOI] [PMC free article] [PubMed] [Google Scholar]
- 39. Rakova N, Kitada K, Lerchl K, Dahlmann A, Birukov A, Daub S, Kopp C, Pedchenko T, Zhang Y, Beck L, et al. Increased salt consumption induces body water conservation and decreases fluid intake. J Clin Invest. 2017;127:1932–1943. [DOI] [PMC free article] [PubMed] [Google Scholar]
Associated Data
This section collects any data citations, data availability statements, or supplementary materials included in this article.
Supplementary Materials
Tables S1–S7
Figures S1–S3
Data Availability Statement
The data that support the findings of this study are available from Finnish Institute for Health and Welfare Biobank (https://thl.fi/en/web/thl‐biobank). The data are not publicly available because they contain information that could compromise research participant privacy/consent. The source code for the analyses is openly available at 10.5281/zenodo.3622730.