

Abstract
Background
The extent to which change in cardiovascular health (CVH) in midlife reduces risk of subsequent cardiovascular disease and mortality is unclear.
Methods and Results
CVH was computed at 2 ARIC (Atherosclerosis Risk in Communities) study visits in 1987 to 1989 and 1993 to 1995, using 7 metrics (smoking, body mass index, total cholesterol, blood glucose, blood pressure, physical activity, and diet), each classified as poor, intermediate, and ideal. Overall CVH was classified as poor, intermediate, and ideal to correspond to 0 to 2, 3 to 4, and 5 to 7 metrics at ideal levels. There 10 038 participants, aged 44 to 66 years that were eligible. From the first to the second study visit, there was an improvement in overall CVH for 17% of participants and a decrease in CVH for 21% of participants. At both study visits, 28%, 27%, and 6% had poor, intermediate, and ideal overall CVH, respectively. Compared with those with poor CVH at both visits, the risk of cardiovascular disease (hazard ratio [HR], 0.26; 95% CI, 0.20–0.34) and mortality (HR, 0.35; 95% CI, 0.29–0.44) was lowest in those with ideal CVH at both measures. Improvement from poor to intermediate/ideal CVH was also associated with a lower risk of cardiovascular disease (HR, 0.67; 95% CI, 0.59–0.75) and mortality (HR, 0.80; 95% CI, 0.72–0.89).
Conclusions
Improvement in CVH or stable ideal CVH, compared with those with poor CVH over time, is associated with a lower risk of incident cardiovascular disease and all‐cause mortality. The change in smoking status and cholesterol may have accounted for a large part of the observed association.
Keywords: cardiovascular Diseases, cardiovascular Health, mortality, primordial Prevention
Subject Categories: Cardiovascular Disease, Epidemiology, Lifestyle, Risk Factors, Primary Prevention
Nonstandard Abbreviation and Acronym
- CVH
cardiovascular health
Clinical Perspective
What Is New?
Change in cardiovascular health (CVH) and how it relates to risk of cardiovascular events has been little studied.
We found a graded association between pattern of change in CVH and subsequent cardiovascular disease and mortality; stable ideal and improvement from poor to intermediate/ideal CVH was associated with a lower risk of cardiovascular disease and mortality.
The cardiovascular disease and mortality risks were more strongly driven by the baseline CVH level than the follow‐up CVH level.
What Are the Clinical Implications?
These findings highlight the importance of promotion of CVH throughout the life course and as early as possible.
Cardiovascular disease and mortality risks were more strongly driven by tobacco use and total cholesterol: This highlights the central importance of primordial prevention of tobacco use and high total cholesterol.
The American Heart Association (AHA) proposed the use of a composite marker of ideal cardiovascular health (CVH), which targets the development of risk factors for the primordial prevention of cardiovascular disease (CVD). 1 CVH is composed of 4 behavioral and 3 biological metrics: cigarette smoking, body mass index (BMI), physical activity, diet, total cholesterol, blood glucose, and blood pressure. Ideal CVH has been consistently found to be associated with a lower risk of CVD, 2 , 3 CVD mortality, 4 , 5 cancer mortality, 6 and all‐cause mortality 3 in population‐based prospective cohort studies. These associations have been observed in young, 7 , 8 , 9 middle‐aged, 4 , 10 , 11 , 12 and older adults. 13 Much of the evidence on the benefits of CVH use a single, baseline measure and the benefits of change in CVH remain to be investigated.
Recent studies report that improving or maintaining a healthy lifestyle can attenuate or even reverse the progression of atherosclerosis and lower the risk of CVD. 14 , 15 , 16 Whether improvement in CVH in midlife lowers risk of subsequent CVD or mortality in later life remains unclear as few studies have repeat data on CVH metrics at multiple time points along with sufficient follow‐up to examine subsequent health outcomes. The exception is a recent study, based on data from the United Kingdom, which found no consistent relationship between favorable or unfavorable change in CVH and risk of CVD. 17 To resolve this inconsistency, we examined patterns of change in individual metrics and CVH score and their association with incident CVD and major subtypes of CVD and all‐cause and cause‐specific mortality. In addition, we aimed to identify which components of the composite CVH metric are most strongly associated with outcomes and therefore can provide policymakers, researchers, and clinicians evidence as to what risk factors they should prioritize.
Methods
The ARIC (Atherosclerosis Risk in Communities) study was approved by institutional review boards, and participants gave informed consent. The data that supported the study findings are available from the corresponding author on reasonable request.
ARIC Study
The ARIC study is a population‐based prospective cohort study conducted in 4 US communities, further details on design and methods have been published previously. 18 Data for the present analyses are dawn from 2 clinical assessments of CVH metrics (1987–1989 and 1993–1995), which also included a questionnaire to assess behavioral measures of CVH. Participants were excluded from the investigation if they died or had prevalent CVD in 1987 to 1989 (heart failure [HF], coronary heart disease [CHD], or stroke), or missing data (CVH metrics, health CVD events, or mortality over the follow‐up).
Cardiovascular Health Metrics
We used the AHA definition of CVH. 1 Table S1 provides details on the categorization of each metric as poor, intermediate, and ideal. The 7 metrics were as follows: (1) BMI (kg/m2), calculated from weight measured wearing a scrub suit and standing height; (2) smoking status (current, former, or never), assessed at the interview; (3) diet, assessed using the modified, 66‐item Harvard Food Frequency questionnaire; 19 and (4) physical activity, assessed using the Baecke questionnaire, 20 which asked participants to report the frequency of involvement in up to 4 sports and walking in the previous year. This was converted to minutes per week of moderate or vigorous physical activity. 21 (5) Blood pressure was taken 3 times in a seated position using a random‐zero sphygmomanometer after a 5‐minute rest. The mean of the last 2 measurements was used for analysis. (6) Fasting total cholesterol was measured by enzymatic methods. (7) Fasting glucose was measured using the hexokinase/glucose‐6‐phosphate dehydrogenase method. Use of antihypertensive, cholesterol‐lowering, and glucose‐lowering medication in the 2 weeks prior to each study visit was reported by participants or determined during their interview and used in the categorization of CVH metrics as defined by the AHA guidelines (Table S1).
The number of CVH metrics at ideal levels was combined to yield the total CVH score. This score was further categorized as poor CVH in those with 0 to 2 ideal metrics, intermediate in those with 3 to 4 ideal metrics, and ideal in those with 5 to 7 ideal metrics. Change in CVH score and individual metrics was defined as a change in category (poor, intermediate, or ideal) between 1997 to 1989 and 1993 to 1995.
Outcomes: Incident Cardiovascular Disease, and Total and Cause‐Specific Mortality
The current study included 2 main outcomes: incident CVD and mortality after the second measure of CVH in 1993 to 1995 through 2014. In further analyses, we also examined major subtypes of CVD (HF, CHD, and stroke) and broad causes of death (circulatory system, cancer, and other causes). Protocols and criteria for the ascertainment and diagnosis of CVD events, as well as the ascertainment of deaths in the ARIC study, have been reported previously. 10 , 18 , 22 In brief, incident HF was defined using the International Classification of Diseases, Ninth Revision (ICD-9) code 428 or ICD-10 code I50. 23 CHD and stroke events were adjudicated by the ARIC Mortality and Morbidity Classification Committee using data obtained from contacting participants annually, identifying hospitalizations and deaths during the previous year, surveying discharge lists from local hospitals, and death certificates. Death was ascertained through linkage with the National Death Index and classified as deaths from diseases of the circulatory system, cancer, and other causes. All events were recorded to the nearest year of age. Incident CVD events were comprised of fatal (among any of the listed diagnoses or underlying causes of death) or nonfatal events. All participants were followed from the second measure of CVH (1993–1995) to the date of a CVD event, death, loss to follow‐up, or otherwise to December 31, 2014.
Covariates
Data on covariates were extracted from the interviews accompanying the clinical examinations and included age, sex, university education (yes/no), income (<$15 999, $16 000–$34 999, and $35 000 or more), race (White or Black), and birth cohort (5‐year intervals using year of birth).
Statistical Analysis
Characteristics of participants across the 2 clinical examinations were compared using ANOVA for continuous variables or chi‐square tests for categorical variables. We used 2 methods to examine the association of change in CVH with CVD and mortality. The first method consisted of using change in CVH status (categorized as poor, intermediate, or ideal) between 1987 to 1989 and 1993 to 1995 as the exposure. The second method consisted of using the number of ideal CVH metrics as a time‐varying exposure. In the time‐varying exposure analysis, participants were considered as having the same exposure between the evaluation periods. Age was used as the time scale in both of these analyses. When age is used as the time scale of the Cox model, having also birth cohort as a covariate in the model is interpreted as a birth cohort effect (see Covariates subsection). The mathematically notated equation of the model is as follows: [i=1,…,n; hi(t) = h0(t)e(β1X1i(t)+…+βpXpi(t))].
The proportional hazard assumption was tested using Schoenfeld residuals after all Cox proportional hazards models.
Change in Cardiovascular Health Category: Individual Metrics and Overall Cardiovascular Health
Change in CVH category (poor, intermediate, or ideal) over the 2 clinical examinations resulted in 9 groups: poor to poor (reference category), poor to intermediate, poor to ideal, intermediate to poor, intermediate to intermediate, intermediate to ideal, ideal to poor, ideal to intermediate, and ideal to ideal. The unadjusted association of patterns of change in CVH with CVD (and major subtypes) and all‐cause mortality was assessed using Kaplan‐Meier curves. As some of the groups were small, we combined poor to intermediate/ideal and ideal to intermediate/poor. Subsequent multivariable analyses had 7 categories for the main exposure. We first examined the association between patterns of change in individual CVH metrics with incident CVD and all‐mortality using Cox proportional hazards regression models. Second, we examined the association of change in overall CVH categories with CVD and all‐cause mortality. We repeated the change in overall CVH analysis with outcomes of subtypes of CVD (CHD, stroke, and HF) and cause‐specific mortality (circulatory system, cancer, and other causes) using competing risk analysis by calculating subdistribution hazard ratios (HRs) using the Fine and Gray method. 24 As we calculated the change between 1987 to 1989 and 1993 to 1995, the baseline for the CVD and mortality hazard analysis was 1993 to 1995 because CVD events or deaths occurring during the change period were excluded.
Cardiovascular Health as a Time‐Dependent Exposure
In an alternative approach to modeling change, we modeled the exposure as time‐varying: first each individual metric, then overall ideal CVH score composed of the number of metrics at ideal levels, and then categorized poor, intermediate, and ideal for 0 to 2, 3 to 4, and 5 to 7 metrics at the ideal level, respectively. In time‐dependent Cox proportional‐hazards models, we calculated HRs for all‐cause mortality and CVD events updating covariate data over the follow‐up with CVH as a time‐dependent exposure. Entry time was defined as age at the beginning of the follow‐up. When CVD was the outcome, exit time was defined as age at death, age at CVD event, or age at the end of follow‐up (December 31, 2014). The exit time when mortality was the outcome was defined as age at death or age at the end of follow‐up (December 31, 2014), whichever came first. Analyses were adjusted for all covariates. In sensitivity analyses, we examined the association of CVH with the outcomes of the study, stratified by race (Black, White).
All tests were 2‐tailed and a P value of <0.05 was considered statistically significant. Statistical analyses were undertaken using SAS software version 9.4 and R software, version 3.3.2.
Results
A total of 15 048 participants were included in the 1987 to 1989 wave of data collection in the ARIC study; after excluding those with missing data or CVD events or death between 1987 to 1989 and 1993 to 1995, the final analyses sample contained 10 038 participants (Figure S1). Compared with participants excluded from the analysis, those included in the analysis were more likely to be White, and have a university education and high income (Table S2).
A description of the CVH metrics according to AHA guidelines, along with their categorization into poor, intermediate, and ideal, is provided in Table S1. Of the 10 038 participants included in the analyses, 2797 (27.9%) had poor, 2787 (27.8%) intermediate, and 622 (6.2%) ideal CVH at both clinical examinations (Table 1). Change from poor to ideal status was only observed in 67 participants, and from ideal to poor in 83 participants. Favorable changes in CVH status were more common in those with an advantaged sociodemographic profile. Mean age of participants in 1987 to 1989 was 54.0 (SD, 5.7) and 59.9 (SD, 5.7) in 1993 to 1995. CVH did not globally improve over time, but rather deteriorated (Table S3, see overall CVH score). Of the 7 metrics that comprise CVH, a substantial improvement was observed only for the smoking and cholesterol metrics, whereas only small changes were observed for physical activity and diet (Table S3). Conversely, health status deteriorated for BMI, blood glucose, and blood pressure.
Table 1.
Characteristics of Participants as a Function of Change in CVH Between 1987 to 1989 and 1993 to 1995
| Patterns of Change in CVH | N (%) | Age, y | Male | White | University Education | High Income |
|---|---|---|---|---|---|---|
| Mean (SD) | N (%) | N (%) | N (%) | N (%) | ||
| Poor to poor | 2797 (27.86%) | 54.5 (5.5) | 1321 (47.2) | 1932 (69.1) | 2012 (71.9) | 518 (19.7) |
| Poor to intermediate | 1137 (11.33%) | 54.9 (5.8) | 599 (52.7) | 877 (77.1) | 896 (78.8) | 290 (26.8) |
| Poor to ideal | 67 (0.06 %) | 55.4 (5.9) | 37 (55.2) | 49 (73.1) | 57 (85.1) | 15 (23.4) |
| Intermediate to poor | 1444 (14.38%) | 53.6 (5.6) | 611 (42.3) | 1179 (81.7) | 1169 (81) | 338 (24.7) |
| Intermediate to intermediate | 2787 (27.76%) | 53.9 (5.8) | 1259 (45.2) | 2355 (84.5) | 2400 (86.1) | 817 (31.0) |
| Intermediate to ideal | 475 (4.73%) | 53.9 (5.5) | 195 (41.1) | 431 (90.7) | 418 (88.0) | 173 (39.0) |
| Ideal to poor | 83 (0.08%) | 52.2 (5.5) | 22 (26.5) | 72 (86.8) | 69 (83.1) | 31 (39.7) |
| Ideal to intermediate | 626 (6.24%) | 52.6 (5.8) | 208 (33.2) | 577 (92.2) | 576 (92.0) | 252 (41.9) |
| Ideal to ideal | 622 (6.20%) | 52.2 (5.4) | 204 (32.8) | 594 (95.5) | 592 (95.2) | 291 (47.9) |
| P value | <0.0001 | <0.0001 | <0.0001 | <.0001 | <.0001 |
CVH indicates cardiovascular health. Over a median follow‐up of 20 years (interquartile range, 16 –21), 2696 (27%) CVD events were recorded, and there were 3 431 (34%) deaths.
Change in Cardiovascular Health Category: Individual Metrics and Overall Cardiovascular Health
The Kaplan‐Meier curves, reflecting unadjusted association of the 9 exposure groups of change in CVH with CVD and mortality, are shown in Figure 1A and 1B, respectively. A dose‐response relationship in risk of overall CVD, subtypes of CVD, and all‐cause mortality was observed with participants who had more time in intermediate or ideal categories of CVH having lower risk for outcomes (Figure S2).
Figure 1. Kaplan–Meier curves denoting association of cardiovascular health (CVH) change between 1987 to 1989 and 1993 to 1995 with (A) incident cardiovascular disease (CVD) and (B) mortality.
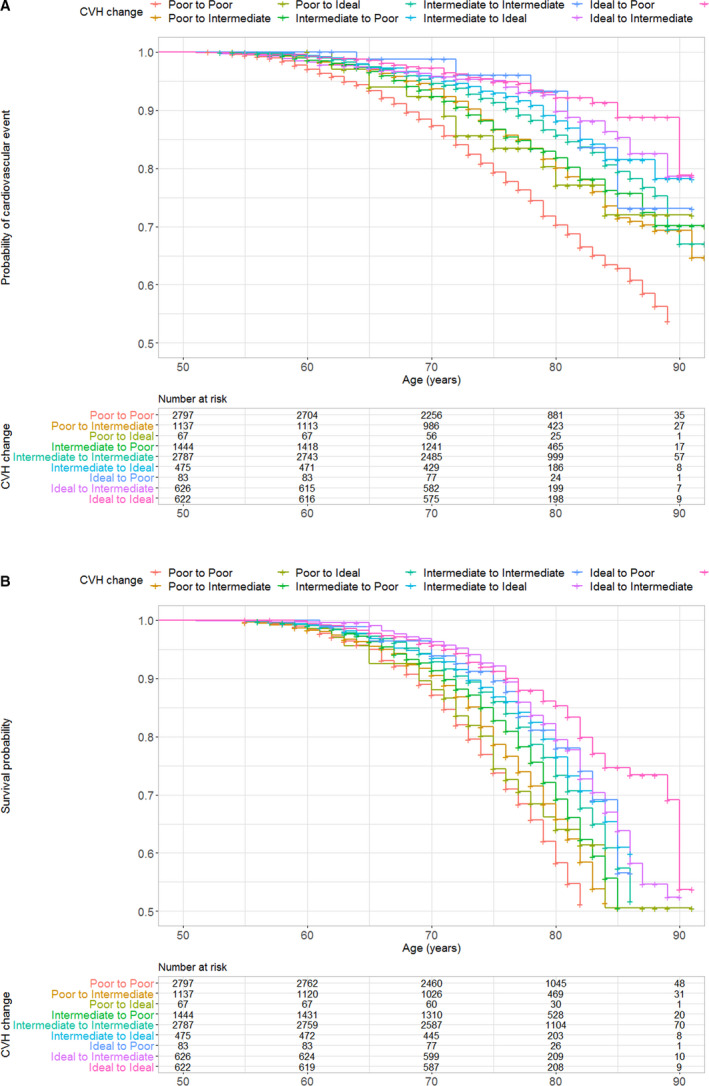
*The minimum age at 1987 to 1989 was 44 years; the minimum age at 1993 to 1995 (start of the survival follow‐up) was 50 years, which is the start of the Kaplan–Meier curve. A, Incident CVD over the follow‐up (1995 to 2014). B, Mortality over the follow‐up (1995 to 2014).
The adjusted HRs associated with change in each CVH metric are given in Table 2. Compared with participants with persistent poor levels of CVH, higher levels of baseline CVH, regardless of whether there was a decrease in CVH following baseline examination, were generally associated with lower risk of CVD or mortality for all individual CVH metrics, except for diet for which no reduced risk was observed in any change category. Furthermore, for smoking and total cholesterol, there was no significant difference in CVD risk for ideal participants who went to a lower category.
Table 2.
Association of Change in Individual CVH Metrics Between 1987 to 1989 and 1993 to 1995 With Incident CVD and Mortality
| 1987–1989 to 1993–1995 | N (%) | CVD | Mortality | ||||
|---|---|---|---|---|---|---|---|
| N Events (%) | HR* (95% CI) | P Value† | N Events (%) | HR (95% CI) | P Value† | ||
| Smoking | <0.001 | <0.001 | |||||
| Poor to poor | 1604 (16.0) | 560 (34.9) | 1.00 (ref) | 810 (50.50) | 1.00 (ref) | ||
| Poor to intermediate or Ideal | 653 (6.5) | 211 (32.3) | 0.80 (0.68–0.94) | 275 (42.11) | 0.72 (0.63–0.84) | ||
| Intermediate to poor | 45 (0.4) | 11 (24.4) | 0.64 (0.35–1.15) | 16 (35.56) | 0.64 (0.39–1.04) | ||
| Intermediate to intermediate | 7 (0.1) | 3 (42.9) | 1.39 (0.45–4.32) | 2 (28.57) | 0.59 (0.15–2.36) | ||
| Intermediate to ideal | 220 (2.2) | 67 (30.4) | 0.66 (0.51–0.86) | 86 (39.09) | 0.56 (0.44–0.69) | ||
| Ideal to poor or intermediate | 137 (1.4) | 42 (30.7) | 0.77 (0.56–1.05) | 52 (37.96) | 0.61 (0.46–0.81) | ||
| Ideal to ideal | 7372 (73.4) | 1802 (24.4) | 0.53 (0.48–0.59) | 2190 (29.71) | 0.42 (0.39–0.46) | ||
| BMI | <0.001 | <0.001 | |||||
| Poor to poor | 2271 (22.6) | 804 (35.4) | 1.00 (ref) | 914 (40.25) | 1.00 (ref) | ||
| Poor to intermediate or ideal | 215 (2.1) | 82 (38.1) | 1.12 (0.88–1.41) | 109 (52.09) | 1.21 (0.99–1.48) | ||
| Intermediate to poor | 870 (8.7) | 233 (26.8) | 0.74 (0.64–0.86) | 284 (32.64) | 0.81 (0.71–0.93) | ||
| Intermediate to intermediate | 2849 (28.4) | 766 (26.9) | 0.65 (0.59–0.72) | 923 (32.40) | 0.69 (0.63–0.76) | ||
| Intermediate to ideal | 304 (3.0) | 89 (21.4) | 0.77 (0.62–0.96) | 142 (46.71) | 1.03 (0.86–1.23) | ||
| Ideal to poor or intermediate | 954 (9.5) | 175 (18.3) | 0.51 (0.43–0.60) | 261 (27.36) | 0.71 (0.61–0.81) | ||
| Ideal to ideal | 2575 (25.6) | 547 (21.2) | 0.58 (0.52–0.65) | 795 (30.87) | 0.78 (0.71–0.86) | ||
| Diet | 0.651 | 0.166 | |||||
| Poor to poor | 1641 (16.3) | 466 (28.4) | 1.00 (ref) | 613 (37.36) | 1.00 (ref) | ||
| Poor to intermediate or ideal | 1577 (15.7) | 437 (27.7) | 1.00 (0.88–1.14) | 561 (35.57) | 0.96 (0.86–1.08) | ||
| Intermediate to poor | 1345 (13.4) | 372 (27.7) | 1.01 (0.88–1.16) | 460 (34.20) | 0.93 (0.82–1.05) | ||
| Intermediate to intermediate | 4719 (47.0) | 1230 (26.1) | 0.98 (0.88–1.09) | 1556 (32.97) | 0.92 (0.84–1.01) | ||
| Intermediate to ideal | 331 (3.3) | 94 (28.4) | 1.03 (0.82–1.29) | 113 (34.14) | 0.92 (0.75–1.12) | ||
| Ideal to poor or intermediate | 332 (3.3) | 78 (23.5) | 0.85 (0.67–1.09) | 106 (31.93) | 0.82 (0.67–1.02) | ||
| Ideal to ideal | 93 (1.0) | 19 (20.4) | 0.73 (0.46–1.16) | 22 (23.66) | 0.63 (0.41–0.96) | ||
| Physical activity | <0.001 | <0.001 | |||||
| Poor to poor | 1967 (20.0) | 640 (32.5) | 1.00 (ref) | 786 (39.96) | 1.00 (ref) | ||
| Poor to intermediate or Ideal | 1461 (14.5) | 439 (30.0) | 0.86 (0.76–0.98) | 543 (37.17) | 0.81 (0.72–0.90) | ||
| Intermediate to poor | 823 (8.2) | 245 (29.8) | 0.94 (0.81–1.09) | 280 (34.02) | 0.86 (0.75–0.99) | ||
| Intermediate to intermediate | 813 (8.1) | 190 (23.8) | 0.76 (0.64–0.89) | 243 (29.89) | 0.78 (0.67–0.90) | ||
| Intermediate to ideal | 934 (9.3) | 238 (25.5) | 0.75 (0.64–0.87) | 300 (32.12) | 0.72 (0.63–0.83) | ||
| Ideal to poor or intermediate | 1424 (14.2) | 342 (24.0) | 0.72 (0.63–0.82) | 475 (33.36) | 0.80 (0.71–0.90) | ||
| Ideal to ideal | 2616 (26.1) | 602 (23.0) | 0.66 (0.59–0.75) | 804 (30.73) | 0.68 (0.61–0.75) | ||
| Blood glucose | <0.001 | <0.001 | |||||
| Poor to poor | 608 (6.1) | 318 (52.3) | 1.00 (ref) | 356 (58.55) | 1.00 (ref) | ||
| Poor to intermediate or ideal | 154 (1.5) | 66 (42.9) | 0.74 (0.57–0.97) | 88 (57.14) | 0.90 (0.71–1.14) | ||
| Intermediate to poor | 542 (5.4) | 227 (41.9) | 0.78 (0.65–0.93) | 265 (48.89) | 0.91 (0.77–1.06) | ||
| Intermediate to intermediate | 2181 (21.7) | 607 (27.8) | 0.43 (0.37–0.49) | 753 (34.53) | 0.54 (0.48–0.62) | ||
| Intermediate to ideal | 1116 (11.1) | 266 (23.8) | 0.38 (0.32–0.45) | 383 (34.32) | 0.55 (0.48–0.64) | ||
| Ideal to poor or intermediate | 1588 (15.8) | 436 (27.5) | 0.45 (0.38–0.52) | 532 (33.50) | 0.58 (0.50–0.66) | ||
| Ideal to ideal | 3849 (38.3) | 776 (20.2) | 0.33 (0.29–0.38) | 1054 (27.38) | 0.49 (0.44–0.56) | ||
| Total cholesterol | <0.001 | 0.005 | |||||
| Poor to poor | 1173 (11.7) | 367 (31.3) | 1.00 (ref) | 433 (36.91) | 1.00 (ref) | ||
| Poor to intermediate or ideal | 1187 (11.8) | 400 (33.7) | 1.06 (0.92–1.23) | 497 (41.87) | 1.15 (1.01–1.30) | ||
| Intermediate to poor | 568 (5.7) | 160 (28.2) | 1.02 (0.85–1.24) | 180 (31.69) | 1.05 (0.88–1.25) | ||
| Intermediate to intermediate | 2183 (21.7) | 571 (26.2) | 0.83 (0.73–0.95) | 699 (32.02) | 0.90 (0.80–1.01) | ||
| Intermediate to ideal | 1084 (11.0) | 300 (27.7) | 0.85 (0.73–1.00) | 406 (37.45) | 1.05 (0.91–1.20) | ||
| Ideal to poor or intermediate | 1014 (10.1) | 239 (23.6) | 0.86 (0.73–1.02) | 290 (28.60) | 0.98 (0.84–1.13) | ||
| Ideal to ideal | 2829 (28.2) | 659 (23.3) | 0.75 (0.65–0.85) | 926 (32.73) | 1.01 (0.90–1.14) | ||
| Blood pressure | <0.001 | <0.001 | |||||
| Poor to poor | 1788 (17.8) | 735 (41.1) | 1.00 (ref) | 873 (48.83) | 1.00 (ref) | ||
| Poor to intermediate or Ideal | 534 (5.3) | 206 (38.6) | 0.98 (0.83–1.14) | 236 (44.19) | 1.02 (0.88–1.18) | ||
| Intermediate to poor | 1061 (10.6) | 378 (35.6) | 0.85 (0.75–0.96) | 441 (41.56) | 0.87 (0.77–0.97) | ||
| Intermediate to Intermediate | 1514 (15.1) | 416 (27.5) | 0.64 (0.57–0.73) | 528 (34.87) | 0.76 (0.68–0.84) | ||
| Intermediate to ideal | 545 (5.4) | 117 (21.5) | 0.51 (0.42–0.63) | 175 (32.11) | 0.75 (0.64–0.88) | ||
| Ideal to poor or intermediate | 1561 (15.5) | 369 (23.6) | 0.59 (0.52–0.67) | 457 (29.28) | 0.72 (0.65–0.81) | ||
| Ideal to ideal | 3035 (30.2) | 475 (15.6) | 0.40 (0.36–0.45) | 721 (23.76) | 0.62 (0.56–0.69) | ||
ROC values of CVD models and mortality models: smoking (0–69), BMI (0–68), total cholesterol (0–67), blood glucose (0–69), blood pressure (0–69), physical activity (0–67), and diet (0–67). The time‐dependent ROC values were computed using cumulative case/dynamic control ROC prediction models. Respective AIC values of CVD unadjusted and the adjusted model for smoking (44051 vs 43795), BMI (44036 vs 43814), total cholesterol (44204 vs 43915), blood glucose (43849 vs 43659), blood pressure (43847 vs 43674), physical activity (44137 vs 43898), and diet (44214 vs 43952). Respective AIC values of mortality unadjusted and the adjusted model for smoking (56923 vs 56657), BMI (57243 vs 56971), total cholesterol (57333 vs 57042), blood glucose (57109 vs 56884), blood pressure (57185 vs 56958), physical activity (57275 vs 57003), and diet (57321 vs 57052). AIC indicates Akaike information criterion; BMI, body mass index; CVD, cardiovascular disease; CVH, cardiovascular health; HR, hazard ratio; and ROC, receiver operating characteristic curve.
HRs were estimated using Cox proportional hazards regression with age as the time scale and adjusted for sex, year of birth, education, and race.
Overall type 3 P values.
The associations of change in overall CVH status, adjusted for all covariates, with subsequent CVD and all‐cause mortality is shown in Figure 2A and 2B. A graded association was observed across the 7 categories of change for both CVD and mortality, as risk was progressively lower with better CVH over the 2 measures. Improvement from poor to intermediate or ideal CVH was associated with lower risk of CVD (HR, 0.67; 95% CI, 0.59–0.75) and all‐cause mortality (HR, 0.80; 95% CI, 0.72–0.89) compared with those with poor CVH at both measures.
Figure 2. Forest plot of adjusted hazard ratios (HRs) of change in cardiovascular health (CVH) status between 1987 to 1989 and 1993 to 1995 and cardiovascular disease (CVD) and mortality over the follow‐up.

A, Incident CVD. B, Mortality.
Table 3 presents results of the analysis of change in overall CVH with CVD subtype and cause‐specific mortality. This competing risk analysis showed improving overall CVH over time to be associated with lower risk of CHD, stroke, and HF; risk reductions were of comparable magnitude across CVD subtypes. Furthermore, this analysis did not reveal an underlying competition between subsequent cause‐specific mortality. Improvement in those with poor overall CVH was associated with lower risk of mortality from diseases of the circulatory system (HR, 0.73; 95% CI, 0.61–0.89) and other causes (HR, 0.79; 95% CI, 0.67–0.94), but the association with cancer mortality did not reach statistical significance (HR, 0.87; 95% CI, 0.72–1.04). For CVD subtypes and all‐cause mortality, there was a graded association between overall CVH and risk; risk was lowest in those with ideal overall CVH at both measures.
Table 3.
Association of Change in CVH With CVD Subtypes and Cause‐Specific Mortality*
| Change in CVH Between 1987–1989 and 1993–1995 | N (%) | N Events (%) | HR* (95% CI) | P Value† | N Events (%) | HR* (95% CI) | P Value† | N Events (%) | HR* (95% CI) | P Value† |
|---|---|---|---|---|---|---|---|---|---|---|
| CVD | ||||||||||
| CHD | Stroke | Heart Failure | ||||||||
| Poor to poor | 2797 (27.9) | 523 (18.7) | 1.00 (ref) | <0.001 | 299 (10.7) | 1.00 (ref) | <0.001 | 748 (26.7) | 1.00 (ref) | <0.001 |
| Poor to intermediate/ideal | 1204 (12.0) | 142 (11.8) | 0.58 (0.48–0.70) | 94 (7.8) | 0.69 (0.55–0.88) | 229 (19.0) | 0.68 (0.59–0.79) | |||
| Intermediate to poor | 1444 (14.4) | 152 (10.5) | 0.56 (0.47–0.67) | 102 (7.1) | 0.68 (0.54–0.85) | 240 (16.6) | 0.64 (0.55–0.74) | |||
| Intermediate to intermediate | 2787 (27.8) | 245 (8.8) | 0.44 (0.38–0.52) | 146 (5.2) | 0.49 (0.40–0.59) | 349 (12.5) | 0.45 (0.40–0.52) | |||
| Intermediate to ideal | 475 (4.7) | 36 (7.6) | 0.37 (0.26–0.53) | 23 (4.8) | 0.44 (0.29–0.69) | 49 (10.3) | 0.38 (0.29–0.51) | |||
| Ideal to intermediate/poor | 709 (7.1) | 35 (4.9) | 0.27 (0.19–0.38) | 25 (3.5) | 0.34 (0.22–0.51) | 54 (7.6) | 0.30 (0.22–0.39) | |||
| Ideal to ideal | 622 (6.2) | 22 (3.5) | 0.20 (0.13–0.31) | 20 (3.2) | 0.32 (0.20–0.51) | 37 (5.95.2) | 0.24 (0.18–0.34) | |||
| N (%) | Mortality | |||||||||
|---|---|---|---|---|---|---|---|---|---|---|
| Circulatory System Diseases | Cancer | Other Causes | ||||||||
| Poor to poor | 2797(27.9) | 405 (14.5) | 1.00 (ref) | <0.001 | 401 (14.34) | 1.00 (ref) | <0.001 | 483 (17.3) | 1.00 (ref) | <0.001 |
| Poor to intermediate/ideal | 1204 (12.0) | 135 (15.6) | 0.73 (0.61–0.89) | 161 (13.37) | 0.87 (0.72–1.04) | 180 (14.9) | 0.79 (0.67–0.94) | |||
| intermediate to poor | 1444 (14.4) | 121 (8.4) | 0.63 (0.51–0.78) | 163 (11.29) | 0.80 (0.66–0.96) | 189 (13.1) | 0.81 (0.68–0.96) | |||
| Intermediate to intermediate | 2787 (27.8) | 194 (7.0) | 0.49 (0.41–0.59) | 310 (11.12) | 0.74 (0.64–0.86) | 326 (11.7) | 0.65 (0.56–0.75) | |||
| intermediate to ideal | 475 (4.7) | 28 (5.9) | 0.44 (0.30–0.65) | 48 (10.11) | 0.68 (0.50–0.92) | 55 (11.6) | 0.67 (0.51–0.89) | |||
| Ideal to intermediate/poor | 709 (7.1) | 31 (5.2) | 0.37 (0.25–0.54) | 54 (7.62) | 0.57 (0.43–0.76) | 557 (8.0) | 0.53 (0.40–0.70) | |||
| ideal to ideal | 622 (6.2) | 24 (3.9) | 0.33 (0.22–0.50) | 33 (5.31) | 0.38 (0.27–0.55) | 33 (5.3) | 0.35 (0.25–0.51) | |||
ROC values of the models: CVD: CHD (0,67), stroke (0.64), heart failure (0.67); mortality: diseases of the circulatory system (0.69), cancer (0.61), other causes (0.65). The time‐dependent ROC values were computed using cumulative case/dynamic control ROC prediction models. Respective AIC values of CVD unadjusted and the adjusted model for smoking (44051 vs 43795), BMI (44036 vs 43814), total cholesterol (44204 vs 43915), blood glucose (43849 vs 43659), blood pressure (43847 vs 43674), physical activity (44137 vs 43898), and diet (44214 vs 43952). AIC indicates Akaike information criterion; BMI, body mass index; CHD, coronary heart disease; CVD, cardiovascular disease; CVH, cardiovascular health; HR, hazard ratio; and ROC, receiver operating characteristic curve.
HRs were estimated using Cox proportional hazards regression with age as the time scale, adjusted for sex, year of birth, education, and race.
Overall type 3 P values.
Cardiovascular Health as a Time‐Dependent Exposure
The results for each CVH metric, treated as a time‐dependent measure for CVD and all‐cause mortality are given in Table S4. Compared with poor status, intermediate and ideal status on all metrics except diet and total cholesterol was associated with a lower risk of CVD and mortality. Diet was not associated with either outcome, and ideal cholesterol was associated only with lower risk of CVD.
The number of ideal CVH metrics score ranged from 0 (none) to all 7 metrics at ideal levels. The individuals with 6 and 7 ideal metrics were combined into 1 category in subsequent analyses because of the small number of participants with all 7 metrics at ideal levels (n=11). The adjusted Cox time‐varying CVH analysis showed a strong graded association of number of ideal metrics with CVD and mortality, Table S5 (P for trend <0.001). Compared with those with 0 ideal metrics, the risk of CVD (HR, 0.20; 95% CI, 0.15–0.27) and mortality (HR, 0.29; 95% CI, 0.22–0.37) was lowest in those with 6 of the 7 ideal metrics. Categorized into 0 to 2, 3 to 4, 5 to 7 ideal metrics yielded similar results, with a graded association and the risk for both CVD and mortality being lowest in those with more metrics at ideal levels. The general pattern of results was similar for all CVD subtypes and cause‐specific mortality, as shown in Table S6.
The large sample size of the ARIC study allowed us to examine the association of ideal CVH metrics, treated as time‐varying variables, with CVD and mortality in both Black and White participants. These results show the protective association of a greater number of ideal metrics to be similar in Black and White participants (Table S7).
Discussion
The current study showed that, regardless of the CVH pattern of change over the 2 measures, participants with an initial ideal/intermediate CVH status had a lower risk of incident CVD events and all‐cause mortality compared with participants with poor CVH at the first measure. This observation adds empirical evidence that maintaining CVH into mid‐to‐late 50 years of age has a protective effect on subsequent health outcomes. 25 Having intermediate or ideal CVH in midlife has beneficial effects even for those in their sixth and seventh decades. Only 1 prior report investigated the association between change in CVH, incident CVD, and mortality in the United States. That study used data from 3460 participants in the Framingham Offspring study cohort, and reported increasing odds of subclinical disease, CVD, and death associated with worsening CVH scores over a 20‐year look‐back period using high and poor classification of CVH. 26 Our study, which utilizes a much larger cohort, extends these results by examining individual CVH metrics and detailing patterns of change in CVH using 3 levels of CVH (poor, intermediate, and ideal) as recommended by the AHA. 1
We report 3 key findings based on analysis of data spanning 25 years in over 10 038 ARIC study participants. First, analysis of change in CVH status from 1987 to 1989 to 1993 to 1995 shows that having ideal CVH at the first period, either in individual CVH metrics or overall CVH, was associated with lower risk of incident CVD and mortality regardless of subsequent change in CVH. Second, improvement of CVH from poor to intermediate or ideal was consistently associated with lower risk of incident CVD and mortality when compared with those with persistently poor CVH. Finally, improvement in CVH (17% of the study population) was less common than worsening of CVH (21%); this highlights the importance of primordial prevention by targeting CVH metrics.
Another major finding from our analyses is that individuals who started with poor CVH and improved their CVH metrics over time lowered their risk of CVD and all‐cause mortality. As study participants were already middle‐aged at first CVH assessment, our results suggest that improvement of poor CVH later in life is also associated with health benefits. So far, very few studies have investigated CVH change and hard CVD outcomes; several studies have examined the association of CVH change with subclinical markers of vascular structure and function. In the ARIC study, improving and maintaining ideal CVH through mid‐ to late life has been associated with better cardiovascular structure and function over time, and lower CVD prevalence. 14 Furthermore, in middle‐aged and older adults in China, Gao et al. showed that improvements in CVH and maintaining a healthy lifestyle can attenuate or even reverse the progression of atherosclerosis, which may, in part, underlie the inverse relations between CVH and incident CVD. 15 Using Framingham Heart Study data, Hwang and colleagues showed that a decrease in the number of ideal CVH metrics over 6.1 years is associated with coronary artery calcium progression in low‐risk, middle‐aged men and women. 27 These results are consistent with our findings of a tracking effect, and suggest that the potential benefits associated with ideal CVH may persist over time. 25
One recent study 17 investigated patterns of CVH change over a median 11 years of follow‐up with incident CVD and all‐cause mortality using data from the UK's Whitehall II study. Although some of the findings between their study and ours are similar, unlike the current study, the authors did not find an association between improving CVH from low to moderate or low to high with a lower risk of CVD and mortality outcomes. Therefore, they reported that there was an inconsistent relationship between the direction of change in CVH and subsequent risk of CVD. In contrast to these findings, the findings of the current study support the benefits of improving CVH throughout midlife, which have important implications for lowering CVD and all‐cause mortality rates in later life. It is possible that the younger age of the Whitehall II study participants compared with the ARIC study (44 versus 54 years of age, respectively) and the long‐time window to assess change in CVH (11 years versus 6 years, respectively) led to these inconsistent results. Additional differences between the 2 samples may be responsible for the more robust results of the current study: more representative of the community, and larger sample size, as well as number of cases resulting in higher statistical power.
So far, 3 US studies have described time trends of CVH, without attempting to examine the impact of these changes on risk of CVD or mortality. A previous study using data from the ARIC study reported a low prevalence of ideal CVH at baseline and a decline of ideal CVH between 1987 to 2013. 14 Using data from the National Health and Nutrition Examination Survey, researchers found that between 1988 and 2008 there was a statistically significant decrease in the prevalence of ideal BMI (44.1%–32.5), ideal diet (33.1%–22.3%), and fasting blood glucose (67.3%–59.5%), whereas the prevalence of nonsmoking status (45.3%–53.2%) improved over time. 4 Decrease in optimal values of blood pressure, glucose, and cholesterol were also reported, while the prevalence of ideal total cholesterol and physical activity remained unchanged. In a third report, the proportion of people meeting ideal CVH criteria in the Framingham Offspring study 26 decreased from 8.5% (1991–1995) to 5.9% from 2005 to 2008. Furthermore, the investigators observed a decrease in the proportion of participants with ideal BMI (from 35.2%–29.6%), blood pressure (from 35.7%–21.6 %), glucose (from 68.2%–47.0 %), and cholesterol (from 44.6%–30.5%) over 17 years (1991–2008). The only improvement found was a decrease in smoking prevalence from 36.3% to 32.7%. The results of the previous studies are similar to the current study, wherein only the prevalence of nonsmoking and cholesterol at ideal level increased over time. Use of cholesterol‐lowering medication increased over time, suggesting that medication may play a role in changes in ideal cholesterol CVH status.
Implications
Our findings carry potentially important implications for population health prevention of CVD and for clinical decision‐making. We found that individuals with ideal CVH at baseline who worsened their CVH over time had a lower CVD event risk and all‐cause mortality compared not only to participants with consistently poor CVH, but to those with poor and intermediate CVH who improved their CVH over time. This highlights the role of CVH as early as possible. We also found that improvement in CVH score likely was strongly driven by less cigarette smoking and lower total cholesterol over time, highlighting the success of efforts to improve these factors. Clinical and public health efforts should also now be aimed at addressing the remaining CVH metrics (BMI, diet, physical activity, blood glucose, and blood pressure) to further improve primordial prevention of CVD.
Strengths and Limitations
Strengths of the current study include the use of a large dataset with both Black and White participants, a wide age range (44–66 years at baseline), a long follow‐up for CVD events (median, 19; interquartile range, 13–21 years) and all‐cause mortality (median, 20; interquartile range, 16–21 years). However, our investigation has several limitations. First, the ARIC cohort is community‐based, but not nationally representative. This may affect estimates of prevalence of CVH and CVH change patterns, but not the association between change in CVH and outcomes. Second, 3534 of the 15 048 participants at the first measure could not be included in the analysis because of missing data. This might have introduced selection bias, as shown by the comparison of included and excluded participants, as those excluded were less likely to be White, have a university degree, and high income. Third, the observational design precludes causal inferences; however, given decades of data on the causal nature of at least several of these factors, it would be reasonable to state that at least smoking, BMI, total cholesterol, blood glucose, blood pressure, physical activity, and diet are causally linked to CVD, and there is likely some casual effect to the associations observed. In addition, the age of the cohort does not change our estimates and does not affect our conclusion that improving CVH is associated with lower risk of incident CVD and all‐cause mortality. Finally, given the multiple testing in our study, and no multiplicity adjustments, the type 1 error is likely inflated.
Conclusions
Our investigation of a large community‐based sample of Black and White middle‐aged adults in the United States demonstrates that a consistently ideal CVH status and initial ideal CVH are associated with lower CVD event risk and all‐cause mortality. Improvements in CVH over time were also associated with a lower CVD event risk and lower all‐cause mortality. This suggests that promotion of ideal CVH status is relevant at every stage of adult life, suggesting that for primordial and primary prevention efforts, individual and public health interventions should start very early and continue throughout life. Understanding the factors influencing patterns of CVH change over time may inform us regarding strategies for promoting ideal CVH.
Sources of Funding
Dr Gaye was supported by a Lefoulon Delalande grant and a Fondation Bettencourt Schueller Price. Dr Tajeu was supported by the National Institute of Diabetes and Digestive and Kidney Diseases (Grant No. 3R01DK108628‐05S1) and the National Heart, Lung, and Blood Institute (Grant No. 1K01HL151974‐01). Dr Singh‐Manoux was supported by the National Institute on Aging (Grant Nos. R01AG062553, R01AG056477). The remaining authors have nothing to disclose.
Disclosures
None
Supporting information
Tables S1–S7
Figures S1–S2
Acknowledgments
We thank Professor Darwin R Labarthe, MD, PhD, MPH, and Professor Joseph M. Rey, MD, for fruitful discussion on the manuscript and English editing. We also thank Anouk Asselin and Eugenie Valentin for their help in the revision of the manuscript. Finally, we thank all staff of the National Heart, Lung, and Blood Institute for establishing the Biologic Specimen and Data Repository Information Coordinating Center (BioLINCC), which provided us the data.
Author contributions: Gaye and Jouven had full access to all the data in the study and take responsibility for the integrity of the data and the accuracy of the data analysis. Study concept and design: Gaye, Jouven; acquisition, analysis, or interpretation of data: Gaye, Vasan, Tajeu, Lassale, Allen, Singh‐Manoux, Jouven; drafting of the manuscript: Gaye; critical revision of the manuscript for important intellectual content: Gaye, Tajeu, Vasan, Lassale, Allen, Singh‐Manoux, Jouven; statistical analysis: Gaye; data set provider: BIOLINCC; and study supervision: Gaye, Jouven.
(J Am Heart Assoc. 2020;9:e017458 DOI: 10.1161/JAHA.120.017458.)
Supplementary Materials for this article are available at https://www.ahajournals.org/doi/suppl/10.1161/JAHA.120.017458
For Sources of Funding and Disclosures, see page 11.
References
- 1. Lloyd‐Jones DM, Hong Y, Labarthe D, Mozaffarian D, Appel LJ, Van Horn L, Greenlund K, Daniels S, Nichol G, Tomaselli GF, et al. American Heart Association Strategic Planning Task Force and Statistics Committee. Defining and setting national goals for cardiovascular health promotion and disease reduction: the American Heart Association’s strategic Impact Goal through 2020 and beyond. Circulation. 2010;121:586–613. [DOI] [PubMed] [Google Scholar]
- 2. Ford ES, Greenlund KJ, Hong Y. Ideal cardiovascular health and mortality from all causes and diseases of the circulatory system among adults in the United States Clinical Perspective. Circulation. 2012;125:987–995. [DOI] [PMC free article] [PubMed] [Google Scholar]
- 3. Younus A, Aneni EC, Spatz ES, Osondu CU, Roberson L, Ogunmoroti O, Malik R, Ali SS, Aziz M, Feldman T, et al. A systematic review of the prevalence and outcomes of ideal cardiovascular health in US and Non‐US populations. Mayo Clin Proc. 2016;91:649–670. [DOI] [PubMed] [Google Scholar]
- 4. Yang Q, Cogswell ME, Flanders WD, Hong Y, Zhang Z, Loustalot F, Gillespie C, Merritt R, Hu FB. Trends in cardiovascular health metrics and associations with all‐cause and CVD mortality among US adults. JAMA. 2012;307:1273–1283. [DOI] [PMC free article] [PubMed] [Google Scholar]
- 5. Gaye B, Tafflet M, Arveiler D, Montaye M, Wagner A, Ruidavets J‐B, Kee F, Evans A, Amouyel P, Ferrieres J, et al. Ideal cardiovascular health and incident cardiovascular disease: heterogeneity across event subtypes and mediating effect of blood biomarkers: The PRIME study. J Am Heart Assoc. 2017;6:e006389 10.1161/JAHA.117.006389. [DOI] [PMC free article] [PubMed] [Google Scholar]
- 6. Rasmussen‐Torvik LJ, Shay CM, Abramson JG, Friedrich CA, Nettleton JA, Prizment AE, Folsom AR. Ideal cardiovascular health is inversely associated with incident cancer: the atherosclerosis risk in communities study. Circulation. 2013;127:1270–1275. [DOI] [PMC free article] [PubMed] [Google Scholar]
- 7. Chomistek AK, Chiuve SE, Eliassen AH, Mukamal KJ, Willett WC, Rimm EB. Healthy lifestyle in the primordial prevention of cardiovascular disease among young women. J Am Coll Cardiol. 2015;65:43–51. [DOI] [PMC free article] [PubMed] [Google Scholar]
- 8. Dong C, Rundek T, Wright CB, Anwar Z, Elkind MSV, Sacco RL. Ideal Cardiovascular health predicts lower risks of myocardial infarction, stroke, and vascular death across whites, blacks and hispanics: the Northern manhattan study. Circulation. 2012;125:2975–2984. [DOI] [PMC free article] [PubMed] [Google Scholar]
- 9. Wu S, Huang Z, Yang X, Zhou Y, Wang A, Chen L, Zhao H, Ruan C, Wu Y, Xin A, et al. Prevalence of ideal cardiovascular health and its relationship with the 4‐year cardiovascular events in a northern Chinese industrial city. Circ Cardiovasc Qual Outcomes. 2012;5:487–493. [DOI] [PubMed] [Google Scholar]
- 10. Folsom AR, Yatsuya H, Nettleton JA, Lutsey PL, Cushman M, Rosamond WD. ARIC Study Investigators. Community prevalence of ideal cardiovascular health, by the American Heart Association definition, and relationship with cardiovascular disease incidence. J Am Coll Cardiol. 2011;57:1690–1696. [DOI] [PMC free article] [PubMed] [Google Scholar]
- 11. Gaye B, Mustafic H, Laurent S, Perier M‐C, Thomas F, Guibout C, Tafflet M, Pannier B, Boutouyrie P, Jouven X, et al. Ideal cardiovascular health and subclinical markers of carotid structure and function: the paris prospective study III. Arterioscler Thromb Vasc Biol. 2016;36:2115–2124. [DOI] [PubMed] [Google Scholar]
- 12. Artero EG, España‐Romero V, Lee D, Sui X, Church TS, Lavie CJ, Blair SN. Ideal cardiovascular health and mortality: aerobics center longitudinal study. Mayo Clin Proc. 2012;87:944–952. [DOI] [PMC free article] [PubMed] [Google Scholar]
- 13. Gaye B, Canonico M, Perier M‐C, Samieri C, Berr C, Dartigues J‐F, Tzourio C, Elbaz A, Empana J‐P. Ideal cardiovascular health, mortality, and vascular events in elderly subjects: the three‐city study. J Am Coll Cardiol. 2017;69:3015–3026. [DOI] [PubMed] [Google Scholar]
- 14. Shah AM, Claggett B, Folsom AR, Lutsey PL, Ballantyne CM, Heiss G, Solomon SD. Ideal cardiovascular health during adult life and cardiovascular structure and function among the elderly. Circulation. 2015;132:1979–1989. [DOI] [PMC free article] [PubMed] [Google Scholar]
- 15. Gao J, Bao M, Liu Y, Shi J, Huang Z, Xing A, Wang Y, An S, Cai J, Wu S, et al. Changes in cardiovascular health score and atherosclerosis progression in middle‐aged and older persons in China: a cohort study. BMJ Open. 2015;5:e007547. [DOI] [PMC free article] [PubMed] [Google Scholar]
- 16. Sotos‐Prieto M, Bhupathiraju SN, Mattei J, Fung TT, Li Y, Pan A, Willett WC, Rimm EB, Hu FB. Association of changes in diet quality with total and cause‐specific mortality. N Engl J Med. 2017;377:143–153. [DOI] [PMC free article] [PubMed] [Google Scholar]
- 17. van Sloten TT, Tafflet M, Périer M‐C, Dugravot A, Climie RED, Singh‐Manoux A, Empana J‐P. Association of change in cardiovascular risk factors with incident cardiovascular events. JAMA. 2018;320:1793–1804. [DOI] [PMC free article] [PubMed] [Google Scholar]
- 18. The Atherosclerosis Risk in Communities (ARIC) Study: design and objectives. The ARIC investigators. Am J Epidemiol. 1989;129:687–702. [PubMed] [Google Scholar]
- 19. Willett WC, Sampson L, Stampfer MJ, Rosner B, Bain C, Witschi J, Hennekens CH, Speizer FE. Reproducibility and validity of a semiquantitative food frequency questionnaire. Am J Epidemiol. 1985;122:51–65. [DOI] [PubMed] [Google Scholar]
- 20. Baecke JA, Burema J, Frijters JE. A short questionnaire for the measurement of habitual physical activity in epidemiological studies. Am J Clin Nutr. 1982;36:936–942. [DOI] [PubMed] [Google Scholar]
- 21. Ainsworth BE, Haskell WL, Whitt MC, Irwin ML, Swartz AM, Strath SJ, O’Brien WL, Bassett DR, Schmitz KH, et al. Compendium of physical activities: an update of activity codes and MET intensities. Med Sci Sports Exerc. 2000;32:S498–504. [DOI] [PubMed] [Google Scholar]
- 22. Rosamond WD, Folsom AR, Chambless LE, Wang CH, McGovern PG, Howard G, Copper LS, Shahar E. Stroke incidence and survival among middle‐aged adults: 9‐year follow‐up of the atherosclerosis risk in communities (ARIC) cohort. Stroke. 1999;30:736–743. [DOI] [PubMed] [Google Scholar]
- 23. Loehr LR, Rosamond WD, Chang PP, Folsom AR, Chambless LE. Heart failure incidence and survival (from the atherosclerosis risk in communities study). Am J Cardiol. 2008;101:1016–1022. [DOI] [PubMed] [Google Scholar]
- 24. Fine JP, Gray RJ. A proportional hazards model for the subdistribution of a competing risk. J Am Stat Assoc. 1999;94:496–509. [Google Scholar]
- 25. Lloyd‐Jones DM, Leip EP, Larson MG, D’Agostino RB, Beiser A, Wilson PWF, Wolf PA, Levy D. Prediction of lifetime risk for cardiovascular disease by risk factor burden at 50 years of age. Circulation. 2006;113:791–798. [DOI] [PubMed] [Google Scholar]
- 26. Enserro DM, Vasan RS, Xanthakis V. Twenty‐year trends in the american heart association cardiovascular health score and impact on subclinical and clinical cardiovascular disease: the framingham offspring study. J Am Heart Assoc. 2018;7:e008741 10.1161/JAHA.118.008741. [DOI] [PMC free article] [PubMed] [Google Scholar]
- 27. Hwang S‐J, Onuma O, Massaro JM, Zhang X, Fu Y‐P, Hoffmann U, Fox CS, O’Donnell CJ. Maintenance of ideal cardiovascular health and coronary artery calcium progression in low‐risk men and women in the framingham heart study. Circ Cardiovasc Imaging. 2018;11:e006209 10.1161/CIRCIMAGING.117.006209. [DOI] [PMC free article] [PubMed] [Google Scholar]
Associated Data
This section collects any data citations, data availability statements, or supplementary materials included in this article.
Supplementary Materials
Tables S1–S7
Figures S1–S2