

Abstract
Background
The American Heart Association 2020 Impact Goals aimed to promote population health through emphasis on cardiovascular health (CVH). We examined the association between nondietary CVH metrics and patient‐reported outcomes among a nationally representative sample of US adults without cardiovascular disease.
Methods and Results
We included adults aged ≥18 years who participated in the Medical Expenditure Panel Survey between 2006 and 2015. CVH metrics were scored 1 point for each of the following: not smoking, being physically active, normal body mass index, no hypertension, no diabetes mellitus, and no dyslipidemia, or 0 points if otherwise. Diet was not assessed in Medical Expenditure Panel Survey. Patient‐reported outcomes were obtained by telephone survey and included questions pertaining to patient experience and health‐related quality of life. Regression models were used to compare patient‐reported outcomes based on CVH, adjusting for sociodemographic factors and comorbidities. There were 177 421 Medical Expenditure Panel Survey participants (mean age, 45 [17] years) representing ~187 million US adults without cardiovascular disease. About 12% (~21 million US adults) had poor CVH. Compared with individuals with optimal CVH, those with poor CVH had higher odds of reporting poor patient‐provider communication (odds ratio, 1.14; 95% CI, 1.05–1.24), poor healthcare satisfaction (odds ratio, 1.15; 95% CI, 1.08–1.22), poor perception of health (odds ratio, 5.89; 95% CI, 5.35–6.49), at least 2 disability days off work (odds ratio, 1.39; 95% CI, 1.30–1.48), and lower health‐related quality of life scores.
Conclusions
Among US adults without cardiovascular disease, meeting a lower number of ideal CVH metrics is associated with poor patient‐reported healthcare experience, poor perception of health, and lower health‐related quality of life. Preventive measures aimed at optimizing ideal CVH metrics may improve patient‐reported outcomes among this population.
Keywords: cardiovascular health, healthcare satisfaction, health‐related quality of life, Life Simple 7, patient‐reported outcomes
Subject Categories: Primary Prevention, Risk Factors, Cardiovascular Disease, Quality and Outcomes
Nonstandard Abbreviations and Acronyms
- AHA
American Heart Association
- CVH
cardiovascular health
- LS7
Life’s Simple 7
- MCS
Mental Component Score
- MEPS
Medical Expenditure Panel Survey
- PCS
Physical Component Score
- PPC
patient‐provider communication
- PRO
patient‐reported outcomes
- SF‐12
12‐Item Short Form
Clinical Perspective
What Is New?
In a nationally representative sample of US adults without clinical cardiovascular disease, we examined the trends of nondietary measures of ideal cardiovascular health (CVH) over time and their associations with patient‐reported outcomes about their healthcare experience.
The prevalence of individuals reporting ideal CVH declined from 2006 to 2015, while the prevalence of poor CVH has increased. The prevalence of poor CVH trended up across all age groups, sexes, races/ethnicities, income level, and census regions.
Poor CVH was associated with poor patient healthcare experience, poor perception of general health, poor health‐related quality of life, and higher disability days off work.
What Are the Clinical Implications?
These findings suggest that future research should evaluate whether a focus on measuring and improving CVH by healthcare providers improves patient‐reported experience and satisfaction and thus improves consumer‐reported metrics on patient‐centered care.
The American Heart Association’s mission is to equitably increase healthy life expectancy by 2 years in the United States by 2030. Targeted preventive measures aimed at optimizing ideal CVH metrics may improve patient‐reported outcomes among US adults without cardiovascular disease.
In their 2020 Strategic Impact Goals aimed at reducing cardiovascular morbidity, mortality, and economic burden, the American Heart Association (AHA) recommended modifications in 7 established cardiovascular risk factors collectively known as the Life’s Simple 7 (LS7) to promote ideal cardiovascular health (CVH). 1 The 7 metrics include current smoking, body mass index, physical activity, healthy diet score, total cholesterol, blood pressure, and fasting plasma glucose. Since its definition by the AHA in 2010, several epidemiologic studies have found that attaining an ideal CVH is not only associated with improved cardiovascular outcomes but also with lower all‐cause mortality and lower incidence of noncardiovascular adverse health outcomes such as cancers and cancer deaths. 2 , 3 , 4 , 5 , 6 , 7 , 8 Prior analyses from the Medical Expenditure Panel Survey (MEPS) data revealed that attaining ideal CVH reduces the number of emergency department visits, outpatient visits, and hospitalizations, with a corresponding reduction in healthcare expenditures among individuals with and without cardiovascular disease (CVD). 9
In their latest mission statement, the AHA aims to equitably increase healthy life expectancy beyond current projections, from 66 years of age to at least 68 years of age across the United States and from 64 years of age to at least 67 years of age worldwide by 2030. 10 Favorable patient‐reported outcomes (PROs) including patient healthcare experience, patient perception of health, and health‐related quality of life (HRQoL) can facilitate care decisions, streamline care, and align patient and clinician goals for better outcomes and health equity. 11 However, data on the impact of PROs on CVH status have yet to be reported despite the tremendous focus on the effect of CVH on CVD and non‐CVD outcomes over the past decade. 2 , 3 , 4 , 7 , 12 , 13 , 14 , 15 , 16 , 17 , 18
The goal of this study was to demonstrate trends in CVH among US adults without CVD across a decade (2006–2015) and further examine the associations of CVH with several PROs including patient healthcare experience, patient perception of health, HRQoL, and loss of productivity from work. We hypothesized that poor CVH would be associated with worse PROs.
Methods
Transparency and Openness Policy
The MEPS are publicly available data sets available from the Agency for Healthcare Research and Quality. While we are not directly providing data sets, our study findings should be easily reproducible from the methods described in paper.
Study Population and Design
This analysis was performed using data from the MEPS, an annual cross‐sectional national survey of individuals and families, healthcare personnel, and employers that provides information on sociodemographic factors, medical conditions, healthcare resource use, and healthcare expenditures. The survey is sponsored by the Agency for Healthcare Research and Quality. Participants in each annual household component of the MEPS are randomly drawn from the previous year’s National Health Interview Survey and consist of noninstitutionalized US civilians. Following the sample draw, participants are interviewed over the telephone, and data on sociodemographic characteristics, patient experience, medical conditions, prescription medications, health resource use, associated costs, and payment sources are obtained. Additional information on healthcare use and cost are collected from physicians, hospitals, and pharmacies. The Agency for Healthcare Research and Quality then assigns a person‐weight and variance estimation stratum to each respondent to generate a nationally representative sample.
Analyses for the present study were conducted using 10 years of MEPS data collected from January 1, 2006, to December 31, 2015. We included participants aged 18 years or older, with a positive sampling weight and without a diagnosis of CVD (Figure 1). CVD was defined as self‐reported or International Classification of Diseases, Ninth Revision, Clinical Modification (ICD‐9-CM) diagnosis of coronary artery disease (ICD‐9-CM codes 410, 413, and 414), stroke (433–437), heart failure (428), cardiac dysrhythmias (427), or peripheral arterial disease (440, 443, and 447). This study was considered exempt from institutional review board approval by the US Department of Health and Human Services because the MEPS data are deidentified and publicly available.
Figure 1. Flowchart of study opulation selection process, MEPS 2006 to 2015.
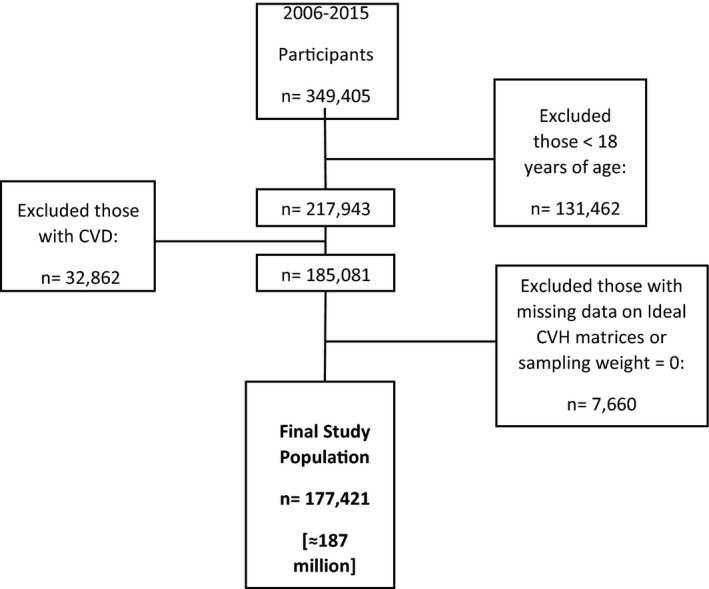
Error bars represent 95% CIs. CVD indicates cardiovascular disease; CVH, cardiovascular health; and MEPS, Medical Expenditure Panel Survey.
Patient‐Reported Outcomes
Patient‐Provider Communication and Patient Satisfaction
Each year, MEPS participants respond to questionnaires assessing patient‐provider communication (PPC) derived from the Consumer Assessment of Healthcare Providers and Systems survey. 19 The questions included (1) how often healthcare providers explained things in a way that was easy to understand; (2) how often providers showed respect for what they had to say; (3) how often providers spent enough time with them; and (4) how often providers listened carefully to them. The responses to these questions were recorded on a 4‐point Likert scale: 1, never; 2, sometimes; 3, usually; and 4, always. To conform with Consumer Assessment of Healthcare Providers and Systems definitions, we recoded responses as 1, never/sometimes; 2, usually; and 3, always. Responses were totaled into scores ranging from 4 to 12 and then weighted to generate average responses from 1 to 3, with 1 indicating poor PPC, 2 indicating average PPC, and 3 indicating optimal PPC.
Patient satisfaction was assessed via the answer to the following question: “Rate of healthcare from all doctors and other health providers,” from 0 (worst health care possible) to 10 (best health care possible). To capture unsatisfied individuals, this variable was divided into quartiles (because of the skewness of individuals’ responses), with those in the lowest quartile being designated as having “poor patient satisfaction.”
HRQoL and Self‐Perceived Health Status
HRQoL was assessed using the summary scores from the physical and mental health component (Physical Component Score [PCS] and Mental Component Score [MCS], respectively) from the 12‐Item Short Form (SF‐12) version 2 included in the MEPS. The PCS and MCS scores ranged from 0 (worst health status possible) to 100 (best health status possible) and was treated as a continuous variable. The SF‐12 has been previously validated for its use in the MEPS. 20
Self‐perceived general health was surveyed at 3 different points each year, with the following possible responses provided on a 5 point Likert scale: 1, excellent; 2, very good; 3, good; 4, fair; and 5, poor. We averaged the responses to estimate a yearly self‐perceived health estimate, which was then dichotomized into the following categories: “Poor” (average score of 5) or “Excellent/Good/Fair” (average score ≤4).
Loss of Productivity From Work
At the interview, participants were asked to report their annual disability days off work. An excess of 2 disability days off was used as markers for loss of productivity from work, as it was above the 95th percentile in our study population.
CVD Risk Factors and CVH Status
Six of the 7 components the AHA’s LS7 were assessed in MEPS. These included not smoking, physically active (defined as 30 minutes or more of moderate‐ to vigorous‐intensity exercise, 5 or more days per week), healthy weight (defined as body mass index<25 kg/m2), no hypertension, no diabetes mellitus, and no dyslipidemia. Dietary habits were not assessed in MEPS. Each ideal CVH metric was scored 0 if absent or 1 if present. Total scores were summed and categorized as optimal (5–6), average (3–4), and poor (0–2).
Other Variables
The sociodemographic factors considered in this study were sex (male or female), age category in years (18–39, 40–64, 65–74, or ≥75), self‐reported race/ethnicities were defined as non‐Hispanic White, non‐Hispanic Black, Hispanic, non‐Hispanic Asian, and non‐Hispanic other (including American Indian/Alaska Native, other race, or multi‐race), family income level (poor or very low income: <125% of the federal poverty level; low income: 125% to <200% of the federal poverty level; middle income: 200% to <400% of the federal poverty level; or high income: ≥400% of the federal poverty level), educational level (less than high school, high school or General Education Development equivalent, or college or higher), insurance status (public, private, or uninsured), and census region (Northeast, Midwest, South, or West).
Statistical Analysis
All analyses were conducted using Stata, version 15 (StataCorp LLC, College Station, TX). To describe trends in CVH status for the whole sample and by subgroups, we pooled the 10‐year MEPS data into 2‐year survey cycles (2006–2007, 2008–2009, 2010–2011, 2012–2013, and 2014–2015) for ease of analysis and reporting. To account for the complex MEPS sampling and survey design, we used Stata’s svy prefix command to apply person‐level weight to generate nationally representative estimates and their 95% CIs for the proportions of civilian noninstitutionalized adults in the United States.
Next, we pooled the 10‐year MEPS data from 2006 to 2015, and descriptive statistics were used to summarize frequency distributions with corresponding weighted proportions by CVH status. Comparisons were made using the Kruskal‐Wallis test for proportions. Finally, multivariable regression models accounting for age, sex, race/ethnicity, level of income, region, health insurance status, education level, and Charlson Comorbidity Index were used to determine the associations of CVH status with PROs. P values were 2‐sided and considered statistically significant at P<0.05.
Results
The analytic sample consisted of 177 421 MEPS participants, translating into 187 million US adults aged ≥18 years and without CVD (Figure 1). Of these, 20 403 participants (11.5%) had poor CVH, 79 662 participants (45%) had average CVH status and 77 356 participants (43.5%) had optimal CVH. These groups represent 25.5, 101.1, and 98.0 million US adults, respectively. The descriptive characteristics of the study sample by CVH status are shown in Table 1. Table 2 shows the prevalence of the PROs by CVH status.
Table 1.
Characteristics of US Adults Without Cardiovascular Disease by Cardiovascular Health Status, MEPS 2006 to 2015
| Optimal CVH (5–6) | Average CVH (3–4) | Poor CVH (0–2) | P Value | |
|---|---|---|---|---|
| Adults, n (%) | 77 356 (43.5) | 79 662 (45.0) | 20 403 (11.5) | |
| Weighted sample, million | 98.0 | 101.1 | 25.9 | |
| Age category, y | <0.001 | |||
| 18–39 | 58.4 | 38.6 | 3.1 | |
| 40–64 | 35.0 | 49.3 | 15.7 | |
| 65–74 | 22.8 | 50.5 | 26.8 | |
| ≥75 | 20.8 | 53.4 | 25.8 | |
| Family income level | <0.001 | |||
| High income | 46.3 | 43.3 | 10.4 | |
| Middle income | 43.5 | 45.1 | 11.4 | |
| Low income | 40.7 | 46.7 | 12.6 | |
| Very low income | 38.7 | 47.5 | 13.8 | |
| Sex | <0.001 | |||
| Female | 45.5 | 43.1 | 11.4 | |
| Male | 41.5 | 46.8 | 11.7 | |
| Race/Ethnicity | <0.001 | |||
| Non‐Hispanic White | 43.8 | 44.4 | 11.8 | |
| Black | 36.4 | 49.4 | 14.2 | |
| Asian | 57.5 | 35.2 | 7.3 | |
| Hispanic | 43.1 | 47.4 | 9.5 | |
| Health insurance status | <0.001 | |||
| Uninsured | 46.2 | 46.9 | 6.9 | |
| Private | 48.2 | 42.8 | 9.0 | |
| Medicaid | 37.9 | 47.0 | 15.1 | |
| Medicare | 21.0 | 51.1 | 27.9 | |
| Education level | <0.001 | |||
| Less than high school | 38.1 | 47.6 | 14.3 | |
| High school/GED | 44.7 | 44.4 | 10.9 | |
| Some college or higher | 46.4 | 43.6 | 10.0 | |
| Census region | <0.001 | |||
| Northeast | 45.2 | 43.6 | 11.2 | |
| Midwest | 42.5 | 45.7 | 11.8 | |
| South | 40.2 | 46.9 | 12.9 | |
| West | 48.3 | 42.3 | 9.4 | |
CVH indicates cardiovascular health; GED, General Education Development; and MEPS, Medical Expenditure Panel Survey.
Table 2.
Prevalence of Patient‐Reported Outcomes by Cardiovascular Health Status* Among US Adults Without Cardiovascular Disease, MEPS 2006 to 2015
| Optimal CVH (5–6) n = 77 356 | Average CVH (3–4) n = 79 662 | Poor CVH (0–2) n = 20 403 | P value | ||
|---|---|---|---|---|---|
| Patient healthcare experience, % | |||||
| PPC | |||||
| Poor PPC (summary score) | 12.6 | 12.9 | 12.6 | 0.47 | |
| Individual components of PPC | |||||
| Doctor never/sometimes listened to you | 7.9 | 8.5 | 8.3 | 0.30 | |
| Doctor never/sometimes explained so you understood | 6.3 | 7.2 | 7.4 | <0.001 | |
| Doctor never/sometimes showed respect | 6.4 | 7.0 | 7.2 | 0.05 | |
| Doctor never/sometimes spent enough time with you | 12.3 | 12.1 | 11.2 | 0.02 | |
| Patient satisfaction with health care, % | |||||
| Poor patient satisfaction | 23.8 | 24.0 | 23.7 | 0.68 | |
| Patient perception of general health, % | |||||
| Poor perceived health status | 2.7 | 8.7 | 23.5 | <0.001 | |
| Loss of productivity from work, % | |||||
| ≥2 Disability days off work | 32.5 | 35.6 | 35.9 | <0.001 | |
| Health‐related quality of life, mean (SD) | |||||
| SF‐12 physical component score | 37.5 (11.8) | 40.3 (11.9) | 44.4 (11.3) | <0.001 | |
| SF‐12 mental component score | 45.0 (12.1) | 47.4 (11.8) | 49.3 (10.9) | <0.001 | |
CVH indicates cardiovascular health; MEPS, Medical Expenditure Panel Survey; and PPC, patient‐provider communication.
The 6 CVH metrics included not currently smoking, being physically active, normal body mass index, no hypertension, no diabetes mellitus, and no dyslipidemia; each scored as 1 or otherwise 0, for total maximum score of 6.
Figure 2 displays the 10‐year trends in CVH status for the total population. Overall, the proportion of US adults without CVD who reported ideal CVH declined from 46.2% in 2006 to 2007 to 42.5% in 2014 to 2015. In contrast, the proportion reporting poor CVH increased from 9.7% to 12.4% within that same period. Poor CVH increased for all age categories but was highest among older adults aged 65 to 74 years and ≥75 years (Figure 3A). Younger adults (18–39 years) had the lowest proportion of poor CVH across this 10‐year period (Figure 3A). The proportion of participants reporting poor CVH increased for both men and women, with a lack offset differences across the 5 cycles (Figure 3B). Also, poor CVH trended up among all racial/ethnic groups but African Americans had the highest proportion of poor CVH across all 5 cycles, while Asians had the lowest proportion of poor CVH with 5.0% in 2006 to 2007 and 9.0% in 2014 to 2015 (Figure 3C). Similarly, disparities in poor CVH were found for participants with poor income, those with less than a high school education, and those from the South Census region (Figures 3D through 3F).
Figure 2. Trends in weighted proportion of US adults without CVD by cardiovascular health status, MEPS 2006 to 2015.
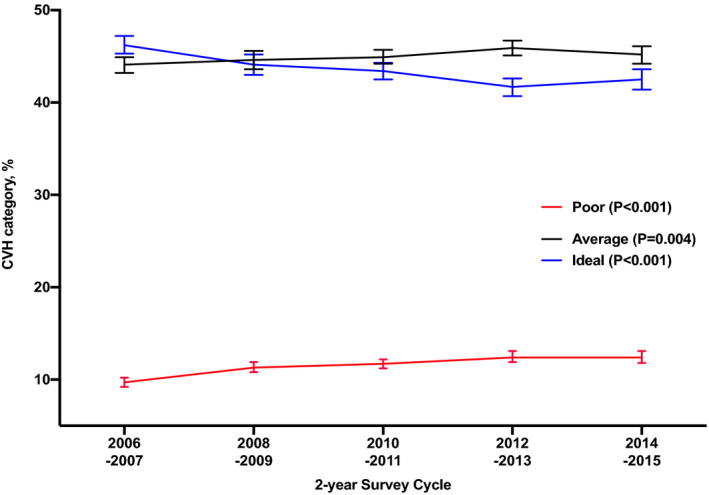
Error bars represent 95% CIs. CVD indicates cardiovascular disease; CVH, cardiovascular health; and MEPS, Medical Expenditure Panel Survey.
Figure 3. Trends in weighted proportion of US adults without CVD reporting poor cardiovascular health by subgroups, MEPS 2006 to 2015.
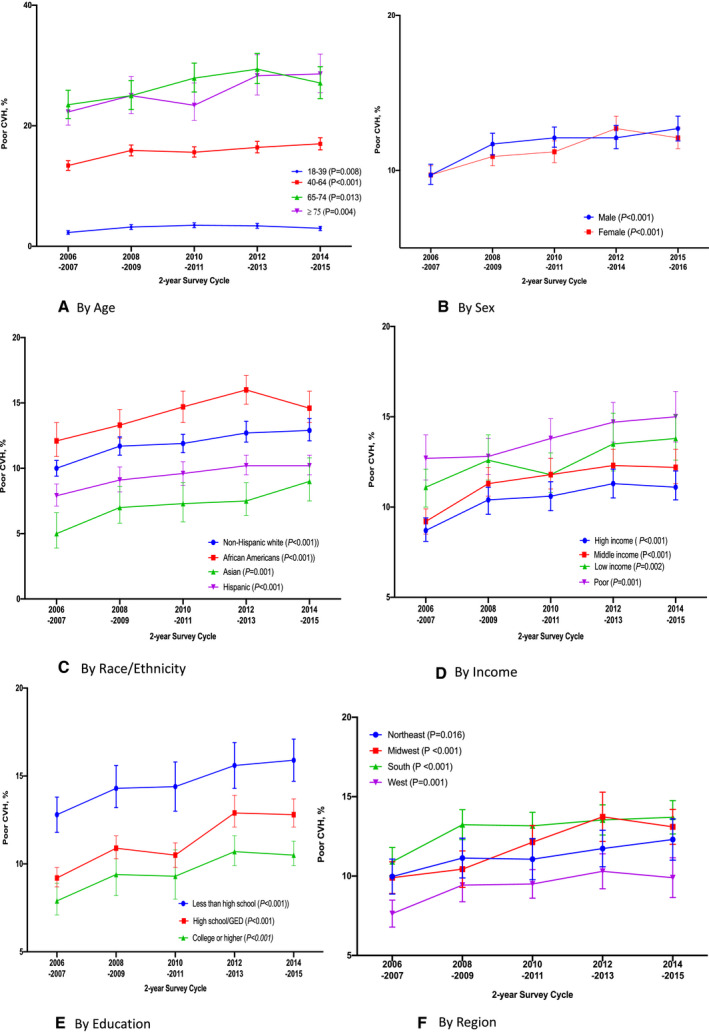
A, By age; (B) by sex; (C) by race; (D) by income; (E) by education; (F) by region. Error bars represent 95% CIs. CVD indicates cardiovascular disease; CVH, cardiovascular health; and MEPS, medical expenditure panel survey.
Patient Healthcare Experience
Table 3 shows the adjusted odds ratios (ORs) of the associations between CVH status with PROs. Overall, those with poor CVH and average CVH were more likely to report a poor healthcare experience, even after adjusting for sociodemographic factors and comorbidity. The odds of reporting poor PPC were higher for participants with poor CVH (OR, 1.14; 95% CI, 1.05–1.24) and average CVH (OR, 1.09; 95% CI, 1.03–1.16) when compared with participants with optimal CVH. Also, the odds of reporting poor patient satisfaction were higher for poor CVH (OR, 1.15; 95% CI, 1.08–1.22) and average CVH (OR, 1.08; 95% CI, 1.03–1.13) compared with ideal CVH.
Table 3.
Odds Ratios of Cardiovascular Health Status* by Patient‐Reported Outcomes Among US Adults Without Cardiovascular Disease, MEPS 2006 to 2015
| Variable | Optimal CVH (5–6) n = 77 356 | Average CVH (3–4) n = 79 662 | Poor CVH (0–2) n = 20 403 |
|---|---|---|---|
| Patient healthcare experience (results reported in odds ratios† [95% CI]) | |||
| PPC | |||
| Poor PPC (summary score) | 1 (Ref) | 1.09 (1.03 to 1.16)‡ | 1.14 (1.05 to 1.24)‡ |
| Per 1‐unit decrease in the CVH metric | 1.07 (1.03 to 1.12)‡ | ||
| Individual components of PPC | |||
| Doctor never/sometimes listened to you | 1 (Ref) | 1.15 (1.08 to 1.24)‡ | 1.21 (1.09 to 1.34)‡ |
| Doctor never/sometimes explained so you understood | 1 (Ref) | 1.14 (1.06 to 1.22)‡ | 1.18 (1.07 to 1.30)‡ |
| Doctor never/sometimes showed respect | 1 (Ref) | 1.14 (1.06 to 1.23)‡ | 1.22 (1.11 to 1.36)‡ |
| Doctor never/sometimes spent enough time with you | 1 (Ref) | 1.07 (1.01 to 1.13)‡ | 1.07 (0.98 to 1.16) |
| Patient satisfaction with health care | |||
| Poor patient satisfaction | 1 (Ref) | 1.08 (1.03 to 1.13)‡ | 1.15 (1.08 to 1.22)‡ |
| Per 1‐unit decrease in the CVH metric | 1.07 (1.04 to 1.11)‡ | ||
| Patient perception of general health (results reported in odds ratios† [95% CI]) | |||
| Poor perceived health status | 1 (Ref) | 2.48 (2.30 to 2.67)‡ | 5.89 (5.35 to 6.49)‡ |
| Per 1‐unit decrease in the CVH metric | 2.42 (2.31 to 2.54)‡ | ||
| Loss of productivity from work (results reported as odds ratios† [95% CI]) | |||
| ≥2 Disability days off work | 1 (Ref) | 1.22 (1.18 to 1.27)‡ | 1.39 (1.30 to 1.48)‡ |
| Health‐related quality of life (results reported as mean difference† [95% CI]) | |||
| SF‐12 physical component score | 0 (Ref | −2.56 (−2.70 to −2.42)‡ | −6.79 (−7.06 to −6.52)‡ |
| Per 1‐unit decrease in the CVH metric | −3.17 (−3.29 to −3.05)‡ | ||
| SF‐12 mental component score | 0 (Ref) | −1.45 (−1.59 to −1.30)‡ | −3.19 (−3.43 to −2.95)‡ |
| Per 1‐unit decrease in the CVH metric | −1.56 (−1.67 to −1.45)‡ | ||
CVH indicates cardiovascular health; MEPS, Medical Expenditure Panel Survey; PPC, patient‐provider communication; and SF‐12, 12‐Item Short Form.
The 6 CVH metrics included not currently smoking, being physically active, normal body mass index, no hypertension, no diabetes mellitus, and no dyslipidemia; each scored as 1 or otherwise 0, for total maximum score of 6.
Adjusted for age, sex, race/ethnicity, level of income, region, health insurance status, education level, and Charlson Comorbidity Index.
Patient Perception of General Health
The odds of reporting the perception of an individual’s health as being poor was higher among adults with poor CVH (OR, 5.89; 95% CI, 5.35–6.49) and average CVH (OR, 2.48; 95% CI, 2.30–2.67) compared with adults who were identified as having ideal CVH. Alternatively, each unit lower in the CVH metric was associated with >2‐fold higher odds of reporting a poor perceived health status (OR, 2.42; 95% CI, 2.31–2.54).
Loss of Productivity from Work
Poor CVH was associated with 39% higher odds of reporting at least 2 disability days off work (OR, 1.39; 95% CI, 1.30–1.48) when compared with ideal CVH. Similarly, average CVH is associated with 22% higher odds of reporting at least 2 disability days off work (OR, 1.22; 95% CI, 1.18–1.27) when compared with ideal CVH.
Health‐Related Quality of Life
When compared with adults with ideal CVH, those with poor CVH and average CVH were more likely to report lower HRQoL as measured by the SF‐12 PCS and SF‐12 MCS. Poor CVH was associated with a mean difference of −6.79 (95% CI, −7.06 to −6.52) in SF‐12 PCS and −3.19 (95% CI, −3.43 to −2.95) in SF‐12 MCS when compared with ideal CVH. Average CVH was associated with a mean difference of −2.56 (95% CI, −2.70 to −2.42) in SF‐12 PCS and a mean difference of −1.45 (95% CI, −1.59 to −1.30) in SF‐12 MCS when compared with ideal CVH. When modeled continuously, each unit lower in the CVH metric was associated with a mean difference of −3.17 (95% CI, −3.29 to −3.05) in SF‐12 PCS and a mean difference of −1.56 (95% CI, −1.67 to −1.45) in SF‐12 MCS.
Discussion
In this nationally representative sample of US adults without clinical CVD, we found that (1) the prevalence of individuals reporting ideal CVH declined from 2006 to 2015, while the prevalence of poor CVH increased; (2) the prevalence of poor CVH trended up across all age groups, sexes, races/ethnicities, income level, and census regions; (3) poor CVH was associated with poor patient healthcare experience, poor perception of general health, poor HRQoL, and higher disability days off work.
The AHA’s 2020 Strategic Goal placed emphasis on improving the CVH of all Americans by 20% while reducing deaths from CVD and stroke by 20% by the year 2020. 1 Although tremendous progress was made toward achieving this goal through a significant reduction in overall cigarette smoking prevalence and poor dietary habits, increases in blood pressure and prevalence of obesity were noted among US adults over the past decade. 10 The data from this representative sample of US adults also highlight this setback by showing that the prevalence of ideal CVH trended down, while poor CVH increased over time among US adults without CVD, with the highest prevalence among certain high‐risk groups including older adults, Black individuals, poor individuals, those with low level of education, and those from the South region of the United States. As an extension of the 2020 Impact Goal, the AHA 2030 Impact Goal strives to equitably increase healthy life expectancy in the United States by at least 2 years by 2030 and the findings herein provide insights to potential avenues to achieving this monumental goal. 10
Over the past decade, numerous studies have well documented the impact of ideal CVH on CVD 7 , 12 , 13 , 16 , 17 , 18 , 21 , 22 , 23 , 24 and non‐CVD outcomes. 2 , 4 , 6 , 8 , 25 Also, the economic impact of ideal CVH was reported by Valero‐Elizondo et al 9 using data from the MEPS. Overall, ideal CVH when compared with poor CVH was associated with less annual healthcare spending among participants with and without CVD, as well as lower odds of emergency department visits, outpatient visits, and hospitalization. 9 Since the creation of the AHA’s 2020 Strategic Goals in 2010, the association of CVH with patient experience, satisfaction, and quality of life, which are key components of this public health campaign, remains unknown. To our knowledge, this study is the first of its kind to use CVH to address this vital aspect of health care.
There are a couple of possible mechanisms that might explain why poor CVH is associated with poor PROs. First, studies have shown that a more favorable CVH status is associated with better physical health, mental health, and overall health. 4 , 15 , 25 , 26 , 27 , 28 , 29 , 30 España‐Romero et al 25 reported that achieving 5 to 7 CVH metrics was associated with a 36% reduction in depression symptoms when compared with participants achieving 0 to 2 CVH metrics. Similarly, ideal CVH was predictive of functional status in the multiethnic Northern Manhattan Study even after controlling for incident vascular events. 26 Thus, the association of poor PROs among individuals with poor CVH reported herein could just be a reflection of their overall poor health status. Individuals with ideal CVH are generally less sick, with fewer comorbid conditions. Healthier individuals are more likely to be satisfied with their health care compared with those with multiple comorbid conditions who have a higher health resource use and healthcare expenditures and may also have higher expectations from their clinicians.
Second, another explanation of the association of poor PROs with poor CVH found in the present study is that a more patient‐centered care approach can favorably impact overall health, whereas a suboptimal partnership between the patient and the clinician can impair delivering effective preventive interventions. 31 Some data suggest that good patient‐provider relationships lead to adherence to medication and uptake of prevention services. 32 , 33 , 34 , 35 In a prior publication using data from MEPS, Okunrintemi et al 33 found that US adults with atherosclerotic CVD who reported poor patient‐provider communication were 52% and 26% more likely to report lack of statin and aspirin use, respectively. Heisler et al also found that effective patient‐provider communication improved self‐management of diabetes mellitus and better glycemic control. 35
Disability days off work is a surrogate marker for an individual’s level of productivity. It is likely a function of an individual’s overall physical and mental health. In general, an individual with ideal CVH is likely healthier, with fewer comorbid conditions, and hence less likely to take sick days/disability days off work, which could greatly impact an individual’s productivity. Although this metric could be affected by various socioeconomic factors, the association between poor CVH and increased likelihood of disability days off work persisted even after adjustments for some of these socioeconomic and demographic factors.
This is a cross‐sectional study, so the direction of association between CVH and PROs cannot be determined. However, irrespective of the direction, the associations found in our study offer insights on the impact of ideal CVH on quality of life while suggesting a potential avenue for improving patient‐centered care, a key metric closely monitored across the country by Consumer Assessment of Healthcare Providers and Systems and used in various pay‐for‐performance programs. Results from our analyses support the focus on LS7 metrics, especially among those yet to develop overt CVD, to improve quality of life. Alternatively, improving LS7 metrics could be a target for healthcare providers as a means of improving the overall health of their patients as well as improving their consumer‐reported metrics on patient‐centered care.
These findings must be interpreted in the context of this study’s limitations. First, because the MEPS data included only the noninstitutionalized US adult population, these findings cannot be generalizable to institutionalized populations such as nursing home residents or incarcerated individuals. Second, the components of LS7 used in this study were self‐reported and did not include information on dietary habits. Therefore, a modified scoring for CVH was used in lieu of the AHA’s defined CVH classification system. Third, we assigned an equal weight of 1 to LS7 variables and therefore assumed linearity and additivity of these variables. Although it is unlikely that these variables are linear and additive, our modeling is consistent with prior data modeling on this subject. 3 , 28 , 29 , 36 , 37 , 38 , 39 Fourth, despite comprehensively controlling for important confounders, the associations found in this study may be attributed to residual confounding or other factors not considered in our analysis. Fifth, it was unclear how nonresponse rate in MEPS may affect these findings.
In conclusion, our analyses of a nationally representative cross‐sectional survey of US adults without CVD from 2006 to 2015 found that poor CVH status was associated with poor PROs including patient experience, quality of life, and loss of productivity. These findings suggest that a focus on measuring and improving CVH by healthcare providers may improve patient care experience and satisfaction and thus improve consumer‐reported metrics on patient‐centered care. Most importantly, the AHA’s mission is to equitably increase healthy life expectancy by 2 years in the United States by 2030. 10 Our findings suggest that this goal may be achieved by targeted preventive measures aimed at optimizing ideal CVH metrics to improve PROs among US adults without CVD and ultimately health equity.
Sources of Funding
Dr Virani has research support from Department of Veterans Affairs, World Heart Federation, Tahir, and Jooma Family. Dr Michos has research supported by the Blumenthal Scholars Fund for Preventive Cardiology at Johns Hopkins University.
Disclosures
Dr Virani has received an honorarium: American College of Cardiology (Associate Editor for Innovations, acc.org) and is a Steering Committee member for the Patient and Provider Assessment of Lipid Management (PALM) registry at the Duke Clinical Research Institute (no financial remuneration). The remaining authors have no disclosures to report.
(J Am Heart Assoc. 2020;9:e016744 DOI: 10.1161/JAHA.120.016744.)
For Sources of Funding and Disclosures, see page 9.
References
- 1. Lloyd‐Jones DM, Hong Y, Labarthe D, Mozaffarian D, Appel LJ, Van Horn L, Greenlund K, Daniels S, Nichol G, Tomaselli GF, et al. Defining and setting national goals for cardiovascular health promotion and disease reduction. Circulation. 2010;586–613. [DOI] [PubMed] [Google Scholar]
- 2. Aneni EC, Crippa A, Osondu CU, Valero‐Elizondo J, Younus A, Nasir K, Veledar E. Estimates of mortality benefit from ideal cardiovascular health metrics: a dose response meta‐analysis. J Am Heart Assoc. 2017;9:e006904 DOI: 10.1161/JAHA.117.006904. [DOI] [PMC free article] [PubMed] [Google Scholar]
- 3. Ogunmoroti O, Allen NB, Cushman M, Michos ED, Rundek T, Rana JS, Blankstein R, Blumenthal RS, Blaha MJ, Veledar E, et al. Association between Life's Simple 7 and noncardiovascular disease: the Multi‐Ethnic Study of Atherosclerosis. J Am Heart Assoc. 2016;9:e003954 DOI: 10.1161/JAHA.116.003954. [DOI] [PMC free article] [PubMed] [Google Scholar]
- 4. Kulshreshtha A, Goetz M, Alonso A, Shah AJ, Bremner JD, Goldberg J, Vaccarino V. Association between cardiovascular health and cognitive performance: a twins study. J Alzheimers Dis. 2019;957–968. [DOI] [PMC free article] [PubMed] [Google Scholar]
- 5. Effoe VS, Carnethon MR, Echouffo‐Tcheugui JB, Chen H, Joseph JJ, Norwood AF, Bertoni AG. The American Heart Association Ideal cardiovascular health and incident type 2 diabetes mellitus among blacks: the Jackson Heart Study. J Am Heart Assoc. 2017;e005008 10.1161/JAHA.116.005008. [DOI] [PMC free article] [PubMed] [Google Scholar]
- 6. Foraker RE, Abdel‐Rasoul M, Kuller LH, Jackson RD, Van Horn L, Seguin RA, Safford MM, Wallace RB, Kucharska‐Newton AM, Robinson JG, et al. Cardiovascular health and incident cardiovascular disease and cancer: the Women’s Health Initiative. Am J Prev Med. 2016;236–240. [DOI] [PMC free article] [PubMed] [Google Scholar]
- 7. Younus A, Aneni EC, Spatz ES, Osondu CU, Roberson L, Ogunmoroti O, Malik R, Ali SS, Aziz M, Feldman T, et al. A systematic review of the prevalence and outcomes of ideal cardiovascular health in US and non‐US populations. Mayo Clin Proc. 2016;649–670. [DOI] [PubMed] [Google Scholar]
- 8. Rasmussen‐Torvik LJ, Shay CM, Abramson JG, Friedrich CA, Nettleton JA, Prizment AE, Folsom AR. Ideal cardiovascular health is inversely associated with incident cancer: the Atherosclerosis Risk in Communities study. Circulation. 2013;1270–1275. [DOI] [PMC free article] [PubMed] [Google Scholar]
- 9. Valero‐Elizondo J, Salami JA, Ogunmoroti O, Osondu CU, Aneni EC, Malik R, Spatz ES, Rana JS, Virani SS, Blankstein R, et al. Favorable cardiovascular risk profile is associated with lower healthcare costs and resource utilization: the 2012 Medical Expenditure Panel Survey. Circ Cardiovasc Qual Outcomes. 2016;143–153. [DOI] [PubMed] [Google Scholar]
- 10. Angell SY, McConnell MV, Anderson CAM, Bibbins‐Domingo K, Boyle DS, Capewell S, Ezzati M, de Ferranti S, Gaskin DJ, Goetzel RZ, et al. The American Heart Association 2030 impact goal: a presidential advisory from the American Heart Association. Circulation. 2020;e120–e138. [DOI] [PMC free article] [PubMed] [Google Scholar]
- 11. Brundage MD, Wu AW, Rivera YM, Snyder C. Promoting effective use of patient‐reported outcomes in clinical practice: themes from a "Methods Toolkit" paper series. J Clin Epidemiol. 2020;153–159. [DOI] [PubMed] [Google Scholar]
- 12. Enserro DM, Vasan RS, Xanthakis V. Twenty‐year trends in the American Heart Association cardiovascular health score and impact on subclinical and clinical cardiovascular disease: the Framingham Offspring Study. J Am Heart Assoc. 2018;9:e008741 DOI: 10.1161/JAHA.118.008741. [DOI] [PMC free article] [PubMed] [Google Scholar]
- 13. Gaye B, Canonico M, Perier MC, Samieri C, Berr C, Dartigues JF, Tzourio C, Elbaz A, Empana JP. Ideal cardiovascular health, mortality, and vascular events in elderly subjects: the Three‐City Study. J Am Coll Cardiol. 2017;3015–3026. [DOI] [PubMed] [Google Scholar]
- 14. Ommerborn MJ, Blackshear CT, Hickson DA, Griswold ME, Kwatra J, Djousse L, Clark CR. Ideal cardiovascular health and incident cardiovascular events: the Jackson Heart Study. Am J Prev Med. 2016;502–506. [DOI] [PMC free article] [PubMed] [Google Scholar]
- 15. Gardener H, Wright CB, Dong C, Cheung K, DeRosa J, Nannery M, Stern Y, Elkind MS, Sacco RL. Ideal cardiovascular health and cognitive aging in the Northern Manhattan Study. J Am Heart Assoc. 2016;9:e002731 DOI: 10.1161/JAHA.115.002731 [DOI] [PMC free article] [PubMed] [Google Scholar]
- 16. Dong C, Rundek T, Wright CB, Anwar Z, Elkind MS, Sacco RL. Ideal cardiovascular health predicts lower risks of myocardial infarction, stroke, and vascular death across Whites, Blacks, and Hispanics: the northern Manhattan study. Circulation. 2012;2975–2984. [DOI] [PMC free article] [PubMed] [Google Scholar]
- 17. Yang Q, Cogswell ME, Flanders WD, Hong Y, Zhang Z, Loustalot F, Gillespie C, Merritt R, Hu FB. Trends in cardiovascular health metrics and associations with all‐cause and CVD mortality among US adults. JAMA. 2012;1273–1283. [DOI] [PMC free article] [PubMed] [Google Scholar]
- 18. Rana JS, Liu JY, Moffet HH, Karter AJ, Nasir K, Solomon MD, Jaffe MG, Ambrosy AP, Go AS, et al. Risk of atherosclerotic cardiovascular disease by cardiovascular health metric categories in approximately 1 million patients. Eur J Prev Cardiol. 2020;204748732090502. [DOI] [PubMed] [Google Scholar]
- 19. DeVoe JE, Wallace LS, Fryer GE Jr. Measuring patients’ perceptions of communication with healthcare providers: do differences in demographic and socioeconomic characteristics matter? Health Expect. 2009;70–80. [DOI] [PMC free article] [PubMed] [Google Scholar]
- 20. Cheak‐Zamora NC, Wyrwich KW, McBride TD. Reliability and validity of the SF‐12v2 in the medical expenditure panel survey. Qual Life Res. 2009;727–735. [DOI] [PubMed] [Google Scholar]
- 21. Ford ES, Greenlund KJ, Hong Y. Ideal cardiovascular health and mortality from all causes and diseases of the circulatory system among adults in the United States. Circulation. 2012;987–995. [DOI] [PMC free article] [PubMed] [Google Scholar]
- 22. Kulshreshtha A, Goyal A, Veledar E, McClellan W, Judd S, Eufinger SC, Bremner JD, Goldberg J, Vaccarino V. Association between ideal cardiovascular health and carotid intima‐media thickness: a twin study. J Am Heart Assoc. 2014;9:e000282 DOI: 10.1161/JAHA.113.000282. [DOI] [PMC free article] [PubMed] [Google Scholar]
- 23. Robbins JM, Petrone AB, Carr JJ, Pankow JS, Hunt SC, Heiss G, Arnett DK, Ellison RC, Gaziano JM, Djousse L. Association of ideal cardiovascular health and calcified atherosclerotic plaque in the coronary arteries: the National Heart, Lung, and Blood Institute Family Heart Study. Am Heart J. 2015;371–378.e1. [DOI] [PMC free article] [PubMed] [Google Scholar]
- 24. Folsom AR, Yatsuya H, Nettleton JA, Lutsey PL, Cushman M, Rosamond WD. Community prevalence of ideal cardiovascular health, by the American Heart Association definition, and relationship with cardiovascular disease incidence. J Am Coll Cardiol. 2011;1690–1696. [DOI] [PMC free article] [PubMed] [Google Scholar]
- 25. Espana‐Romero V, Artero EG, Lee DC, Sui X, Baruth M, Ruiz JR, Pate RR, Blair SN. A prospective study of ideal cardiovascular health and depressive symptoms. Psychosomatics. 2013;525–535. [DOI] [PubMed] [Google Scholar]
- 26. Dhamoon MS, Dong C, Elkind MS, Sacco RL. Ideal cardiovascular health predicts functional status independently of vascular events: the Northern Manhattan Study. J Am Heart Assoc. 2015;9:e001322 DOI: 10.1161/JAHA.114.001322. [DOI] [PMC free article] [PubMed] [Google Scholar]
- 27. Kronish IM, Carson AP, Davidson KW, Muntner P, Safford MM. Depressive symptoms and cardiovascular health by the American Heart Association’s definition in the Reasons for Geographic and Racial Differences in Stroke (REGARDS) study. PLoS One. 2012;9:e52771. [DOI] [PMC free article] [PubMed] [Google Scholar]
- 28. Mathews L, Ogunmoroti O, Nasir K, Blumenthal RS, Utuama OA, Rouseff M, Das S, Veledar E, Feldman T, Agatston A, et al. Psychological factors and their association with ideal cardiovascular health among women and men. J Womens Health. 2018;709–715. [DOI] [PMC free article] [PubMed] [Google Scholar]
- 29. Osibogun O, Ogunmoroti O, Spatz ES, Burke GL, Michos ED. Is self‐rated health associated with ideal cardiovascular health? The Multi‐Ethnic Study of Atherosclerosis. Clin Cardiol. 2018;1154–1163. [DOI] [PMC free article] [PubMed] [Google Scholar]
- 30. Osibogun O, Ogunmoroti O, Tibuakuu M, Benson EM, Michos ED. Sex differences in the association between ideal cardiovascular health and biomarkers of cardiovascular disease among adults in the United States: a cross‐sectional analysis from the multiethnic study of atherosclerosis. BMJ Open. 2019;9:e031414. [DOI] [PMC free article] [PubMed] [Google Scholar]
- 31. Stewart M, Brown JB, Donner A, McWhinney IR, Oates J, Weston WW, Jordan J. The impact of patient‐centered care on outcomes. J Fam Pract. 2000;796–804. [PubMed] [Google Scholar]
- 32. Zullig LL, Shaw RJ, Shah BR, Peterson ED, Lindquist JH, Crowley MJ, Grambow SC, Bosworth HB. Patient‐provider communication, self‐reported medication adherence, and race in a postmyocardial infarction population. Patient Prefer Adherence. 2015;311–318. [DOI] [PMC free article] [PubMed] [Google Scholar]
- 33. Okunrintemi V, Spatz ES, Di Capua P, Salami JA, Valero‐Elizondo J, Warraich H, Virani SS, Blaha MJ, Blankstein R, Butt AA, et al. Patient‐provider communication and health outcomes among individuals with atherosclerotic cardiovascular disease in the United States: Medical Expenditure Panel Survey 2010 to 2013. Circ Cardiovasc Qual Outcomes. 2017;9:e003635 DOI: 10.1161/CIRCOUTCOMES.117.003635. [DOI] [PubMed] [Google Scholar]
- 34. Beach MC, Keruly J, Moore RD. Is the quality of the patient‐provider relationship associated with better adherence and health outcomes for patients with HIV? J Gen Intern Med. 2006;661–665. [DOI] [PMC free article] [PubMed] [Google Scholar]
- 35. Heisler M, Cole I, Weir D, Kerr EA, Hayward RA. Does physician communication influence older patients’ diabetes self‐management and glycemic control? Results from the Health and Retirement Study (HRS). J Gerontol A Biol Sci Med Sci. 2007;1435–1442. [DOI] [PubMed] [Google Scholar]
- 36. Ogunmoroti O, Osibogun O, Kolade OB, Ying W, Sharma G, Vaidya D, Michos ED. Multiparity is associated with poorer cardiovascular health among women from the Multi‐Ethnic Study of Atherosclerosis. Am J Obstet Gynecol. 2019;631.e1–631.e16. [DOI] [PMC free article] [PubMed] [Google Scholar]
- 37. Ogunmoroti O, Osibogun O, McClelland RL, Burke GL, Nasir K, Michos ED. Alcohol and ideal cardiovascular health: the Multi‐Ethnic Study of Atherosclerosis. Clin Cardiol. 2019;151–158. [DOI] [PMC free article] [PubMed] [Google Scholar]
- 38. Ogunmoroti O, Michos ED, Aronis KN, Salami JA, Blankstein R, Virani SS, Spatz ES, Allen NB, Rana JS, Blumenthal RS, et al. Life’s Simple 7 and the risk of atrial fibrillation: the Multi‐Ethnic Study of Atherosclerosis. Atherosclerosis. 2018;174–181. [DOI] [PubMed] [Google Scholar]
- 39. Ogunmoroti O, Oni E, Michos ED, Spatz ES, Allen NB, Rana JS, Virani SS, Blankstein R, Aronis KN, Blumenthal RS, et al. Life’s Simple 7 and incident heart failure: the Multi‐Ethnic Study of Atherosclerosis. J Am Heart Assoc. 2017;9:e005180 DOI: 10.1161/JAHA.116.005180. [DOI] [PMC free article] [PubMed] [Google Scholar]