Abstract
Background
Detection of the fiber orientation pattern of the myocardium using diffusion tensor magnetic resonance imaging lags ≈12 weeks of gestational age (WGA) behind fetal myocardial remodeling with invasion by the developing coronary vasculature (8 WGA). We aimed to use diffusion tensor magnetic resonance imaging tractography to characterize the evolution of fiber architecture in the developing human heart from the later embryonic period.
Methods and Results
Twenty human specimens (8–24 WGA) from the Kyoto Collection of Human Embryos and Fetuses, including specimens from the embryonic period (Carnegie stages 20–23), were used. Diffusion tensor magnetic resonance imaging data were acquired with a 7T magnetic resonance system. Fractional anisotropy and helix angle were calculated using standard definitions. In all samples, the fibers ran helically in an organized pattern in both the left and right ventricles. A smooth transmural change in helix angle values (from positive to negative) was detected in all 16 directions of the ventricles. This feature was observed in almost all small (Carnegie stage 23) and large samples. A higher fractional anisotropy value was detected at the outer side of the anterior wall and septum at Carnegie stage 20 to 22, which spread around the ventricular wall at Carnegie stage 23 and in the early fetal samples (11–12 WGA). The fractional anisotropy value of the left ventricular walls decreased in samples with ≥13 WGA, which remained low (≈0.09) in larger samples.
Conclusions
From the human late embryonic period (from 8 WGA), the helix angle arrangement of the myocardium is comparable to that of the adult, indicating that the myocardial structure blueprint, organization, and integrity are already formed.
Keywords: diffusion tensor magnetic resonance imaging, fetal development, fetal heart, human late embryonic period, myocardial fiber orientation
Subject Categories: Basic Science Research, Developmental biology
Nonstandard Abbreviations and Acronyms
- CRL
crown‐rump length
- CS
Carnegie stage
- DT‐MRI
diffusion tensor magnetic resonance imaging
- FA
fractional anisotropy
- HA
helix angle
- MR
magnetic resonance
- PA
propagation angle
- WGA
weeks of gestation
Clinical Perspective
What Is New?
We determined myocardial (ventricular) fiber orientation using diffusion tensor magnetic resonance imaging tractography in the late embryonic human stages, corresponding to the compaction (remodeling) phase with invasion by the developing coronary vasculature, which was even earlier than that reported in previous studies.
The helix angle arrangement of the myocardium is comparable to that of the adult from the human late embryonic period (from 8 weeks of gestation), indicating that the myocardial structure blueprint, organization, and integrity are already formed.
What Are the Clinical Implications?
These data may contribute to the emerging field of fetal cardiology and give quantitative insight into the normal development and activity of the human fetal heart.
The heart is the first functional organ to develop in the human embryo. Pulsation of the cardiac tube begins at Carnegie stage (CS) 10 (4 weeks of gestation [WGA]), 1 , 2 which drives the placental circulation. A concomitant change in the level of myocardial organization proceeds after pulsation. 3 At first, trabeculations emerge in the luminal layers of the ventricles at CS 12 (4–5 WGA). During secondary trabeculations, this trabecular layer becomes solidified in its deeper part, while the remaining layer adjacent to the ventricular lumen retains its trabeculations. Four chambers and valves are established around CS 18 to 19 (7 WGA). Remodeling of the fetal myocardial pattern to the adult arrangement begins at CS 22 (8 WGA) with invasion by the developing coronary vasculature, which enables perfusion of a large volume of the myocardium, leading to thickening of the heart wall. 4 The myocardium develops and differentiates from the fetal to the neonatal period. 5
The fibers of the myocardium are arranged in a laminar structure 6 and crossing helical pattern in adults. 7 Concerning the architecture of the heart, 2 models were proposed from gross dissection to histological presentation. In the cardiac mesh model, 8 the myocytes are arranged longitudinally and change their angulation radially along the myocardial depth. In contrast, in the helical ventricular myocardial model (myocardial band), the ventricular myocardium is a continuous anatomical helical layout of myocardial fibers. 9 , 10
Diffusion tensor magnetic resonance (MR) imaging (DT‐MRI) tractography provides unique information about the structure, organization, and integrity of the myocardium. Evaluation of the microstructure of the human heart with DT‐MRI allows 3‐dimensional imaging of the heart in an intact state. Many studies of myocardial fiber architecture have used DT‐MRI for imaging normal adult hearts in murine, human, sheep, rat, and rabbit models, 11 , 12 , 13 , 14 including abnormal hearts such as those with hypertrophy 11 and infarction. 12 , 13 DT‐MRI enables 3‐dimensional visualization of the myofiber architecture and measurement of diffusion anisotropy, showing a gradual transmural change in helix angle (HA), with a circumferential zone formed in the middle of an adult human left ventricular (LV) wall. There is no abrupt change in the HA, as could be expected if the wall was constructed according to the helical ventricular myocardial model (myocardial band). 15 , 16
A recent DT‐MRI study of normal human fetal hearts showed that the myocardium remains highly isotropic at the end of the first trimester. 17 , 18 The characteristic anisotropy and fiber orientation pattern seen in postnatal hearts are developed in the second trimester and these evolve gradually. Pervolaraki et al 18 used a 9.4T MR imaging (MRI) system and showed that the architecture of the human ventricular wall was still irregular and isotropic at 100 days of gestation (15 WGA). By 140 days of gestation (20 WGA), the anisotropic and orthotropic architecture with a transmural change in the myocyte orientation by ≈120° was observed. Detection of the fiber orientation pattern using DT‐MRI lags ≈16 and 12 WGA behind the onset of cardiac pulsation (4 WGA) and the remodeling of the fetal myocardium on invasion by the developing coronary vasculature (8 WGA), respectively, which may be a prerequisite for cardiomyocyte maturation and alignment.
Adequate conditions for DT‐MRI acquisition, especially, the diffusion gradient sampling scheme, can improve the robustness of measurements for quantities such as HA and fractional anisotropy (FA) as well as propagation angles (PAs). 19 , 20 Therefore, in this study, we aimed to use DT‐MRI tractography to characterize the evolution of fiber architecture in the developing human heart from the late embryonic stage, corresponding to the stage in which the fetal myocardial pattern was remodeled with discrete coronary circulation. The degree of the HA, FA, and PA was calculated, using similar indices, as in previous studies. 13 , 17 , 18 , 21 We determined myocardial (ventricular) fiber orientation in the late embryonic human stages (8–24 WGA), which was even earlier than that reported in previous studies.
Methods
Human Fetal Specimens
The data that support the findings of this study are available from the corresponding author upon reasonable request. The ethics committee of Kyoto University Faculty and Graduate School of Medicine approved this study's use of human embryo and fetal specimens (E986, R0316).
The Kyoto Collection of Human Embryos and Fetuses comprised ≈45 000 human fetuses stored at the Congenital Anomaly Research Center of Kyoto University. 22 , 23 , 24 Most specimens were acquired when pregnancy was terminated for socioeconomic reasons under the Maternity Protection Law of Japan. The samples were collected from 1963 to 1995 according to the regulations relevant at each time. For instance, written informed consent was not required from parents at that time. Instead, parents provided verbal informed consent to have these specimens deposited, and each participant's consent was documented in the medical record. Some of these specimens were undamaged within well‐preserved fetuses. Aborted fetal specimens were brought to the laboratory, measured, examined, and staged using the criteria proposed by O'Rahilly and Müller. 25 Fourteen human specimens (crown‐rump length [CRL]: 18–74 mm; 8–15 WGA) and 6 dissected human fetal hearts (CRL, 71–160 mm; 13–24 WGA) from the Kyoto Collection were used for this study (Table 1). Five specimens were in the late embryonic period between CS 20 and CS 23 (8–9 WGA), while the remaining specimens were obtained in the fetal period.
Table 1.
Samples Used in the Present Study
| Sample ID (CS) | CRL, mm | DGA, d | WGA, wk | In Vivo/Ex Vivo | Coil Size, mm | LV | |
|---|---|---|---|---|---|---|---|
| Wall Thickness, mm | Volume, mm3 | ||||||
| 21334 (20) | 18 | 54 | 8 | In vivo | 19 | ND | 4.2 |
| 31275 (21) | 18 | nd | nd | In vivo | 19 | ND | 4.2 |
| 32783 (22) | 20 | nd | nd | In vivo | 19 | ND | 5.0 |
| 20018 (23) | 23 | nd | nd | In vivo | 19 | ND | 6.0 |
| 30363 (23) | 26 | 63 | 9 | In vivo | 19 | ND | 4.9 |
| F1730 | 30 | 82 | 12 | In vivo | 19 | 0.44 | 10.8 |
| 51397 | 32 | 72 | 11 | In vivo | 19 | 0.60 | 9.0 |
| F2307 | 43 | 75 | 11 | In vivo | 72 | 0.69 | 31.0 |
| 51262 | 51 | nd | nd | In vivo | 72 | 0.54 | 19.9 |
| F2148 | 65 | 95 | 14 | In vivo | 72 | 0.78 | ND |
| F1934 | 68 | 97 | 14 | In vivo | 72 | 1.17 | 78.6 |
| F2214 | 69 | 95 | 14 | In vivo | 72 | 1.12 | 70.0 |
| 37334 | 70 | 105 | 15 | In vivo | 72 | 0.87 | 46.4 |
| F2482 | 71 | 88 | 13 | Ex vivo | 19 | ND | 209 |
| 52770 | 74 | 92 | 14 | In vivo | 72 | 1.42 | ND |
| F2949 | 85 | nd | nd | Ex vivo | 19 | 1.21 | 183 |
| F1599 | 94 | nd | nd | Ex vivo | 19 | ND | 102 |
| F48 | 98 | 98 | 14 | Ex vivo | 19 | 1.55 | 118 |
| F215 | 158 | 166 | 24 | Ex vivo | 19 | 1.99 | 536 |
| F377 | 160 | 136 | 20 | Ex vivo | 19 | 1.80 | 650 |
CRL indicates crown‐rump length; CS, Carnegie stage; DGA, day of gestation; LV, left ventricular; nd, not described; ND, not determined; and WGA, weeks of gestation. The gray shade indicates the samples in embryonic period.
Image Acquisition
MRI Acquisition System
A 7T preclinical MR system (BioSpec 70/20 USR, Bruker BioSpin MRI GmbH) installed with ParaVision 5.1 software (Bruker BioSpin) was used for MRI. 26 According to the size of the specimens, 2 different conditions were selected for data acquisition (Table S1). A transmit‐receive solenoid coil (inner diameter, 19 mm; Takashima Seisakusho Co., Ltd.) was used for the dissected hearts an embryonic and small fetal samples (CRL, 18–32 mm; 8–12 WGA), and a circular polarized transmit‐receive volume coil (inner diameter, 72 mm, T9562; Bruker BioSpin) was used for large fetal samples (CRL, 43–160 mm; 11–24 WGA). During MR measurements, sample temperature was regulated at 21°C by controlling the temperature of the air supplied in the magnet bore via a heater system (MR‐compatible small animal heating system; SA Instruments Inc.). The temperature of samples was monitored using a thermistor temperature probe and monitoring system (Model 1025, MR‐compatible small animal monitoring and gating system; SA Instruments Inc.).
T1‐Weighted MR Images
To obtain morphological information of the heart, T1‐weighted (T1W) MR images were acquired using a spoiled gradient echo sequence with the following acquisition parameters for the dissected heart samples as well as the embryonic and small fetal samples. Repetition time was 30 ms; echo time, 4.152 ms; flip angle, 25°, field of view, 15.36×15.36×15.36 mm3; matrix size, 384×384×384; isotropic spatial resolution, 40 μm; receiver bandwidth, 100 kHz; number of averages, 10; and acquisition time, 12 hours 18 minutes. For the large fetal samples, they were as follows: echo time, 2.842 or 3.192 ms; field of view, 15×22.5×15 mm3; matrix size, 192×288×192; isotropic spatial resolution, 78 μm; number of averages, and 30; acquisition time, 13 hours 50 minutes. Other parameters were the same as those for dissected heart samples.
Diffusion Tensor MRI
DT‐MRI data set was acquired using a standard 3‐dimensional diffusion‐weighted spin echo pulse sequence. For the dissected hearts and embryonic and small fetal samples with a CRL of 16 to 32 mm, imaging parameters were as follows: repetition time, 300 ms; echo time, 19.337 ms; field of view, 15×15×15 mm3; matrix size, 150×150×150; isotropic spatial resolution of 100 μm; and receiver bandwidth, 50 kHz. For large fetal samples with a CRL between 43 and 74 mm, the following imaging parameters were used: echo time, 19.037 ms; field of view, 15×22.5×15 mm3; matrix size, 100×150×100; and isotropic spatial resolution of 150 μm. Other parameters were the same as those for dissected heart samples. Diffusion was encoded along a set of 30 gradient directions, using a pair of trapezoidal gradient pulses of 0.239 ms rise time, 4.2 ms duration, and 9.3 ms separation, accompanied by a nominal b value of 1000 s/mm2 for dissected heart samples as well as embryos and small fetuses with a CRL of 16 to 32 mm and 600 s/mm2 for large fetuses with a CRL between 43 and 74 mm. Five nondiffusion‐weighted images were acquired. The total acquisition time was 65 hours 38 minutes for dissected heart samples and 43 hours 45 minutes for large fetal samples. For fetal samples, 2 sets of DT‐MRI data were acquired and then averaged to improve the signal‐to‐noise ratio of the images.
Three‐Dimensional Reconstruction and Visualization of Fiber Tracts
The hearts were computationally reconstructed from the T1‐weighted images, and the LV thickness and volume were measured using Amira (version 5.5.0, Visage Imaging). Heart volume was defined as that from the apex to the short‐axis plane where the aortic valve was observed. The global coordinate system for the left ventricle was defined for the measurement of the HA and FA. The z axis passing through the center of the LV lumen from the apex was determined using the reconstructed image. The cross‐sectional plane orthogonal to the z axis was used for analysis in the measurements of HA and FA. From the DT‐MRI data, fiber tracts were visualized using DSI Studio (http://dsi-studio.labsolver.org).
HA, FA, and Tractographic PA
FA and HA were calculated using standard definitions, as previously described, 13 , 17 using custom‐written scripts in MATLAB (R2016a; The MathWorks, Inc.). HA is defined as the angle between the local radial plane and the projection of the primary eigenvector to the plane tangent to the radial plane. HA was measured as the indicator showing the inclination of the myofiber out of the local short‐axis plane. Transmural HA changes from the endocardium to the epicardium of the left ventricle were analyzed in the following 12 areas, namely 3 regions (anterior, posterior, and septum) on 4 cross‐sections (basal, upper‐middle, lower‐middle, and apical). 27 Transmural HA changes of the lateral wall of the right ventricle were analyzed when the analysis of the septum included the right lateral wall in smaller specimens. The angles were calculated from the DT‐MRI data sets using a 10° “cake” slice.
FA index was measured by the average of the indices of the 4 cross‐sections (basal, upper‐middle, lower‐middle, and apical). FA measures diffusion anisotropy and ranges between 0 and 1, where 0 means isotropic diffusion and 1 indicates infinite values. The PA was defined as the angle between 2 adjacent principal eigenvectors relative to a given tract. 13 Thus, PA measured curvature as a differential by unit length, with physical units of degrees per voxel.
Results
Gross View
In this study, MR images acquired from the fetal samples were analyzed (Figure 1). Three‐dimensional reconstruction showed the gross anatomy of the heart including, 4 chambers and valves, aorta, and pulmonary arteries in all samples. The fibers run in a helical pattern in both the left and right ventricles; thus, the fibers in the subendocardium form a right‐handed or positive helix around the left ventricle, while those in the subepicardium form a negative or left‐handed helix. The midmyocardial fibers are aligned circumferentially. Fiber architecture in the septum was identical to the pattern in the LV wall and was conserved from the base to the apex. The apical vortex was notable even in smaller samples (Figure 1B).
Figure 1. Three‐dimensional reconstruction and fiber tracts of the fetal hearts.
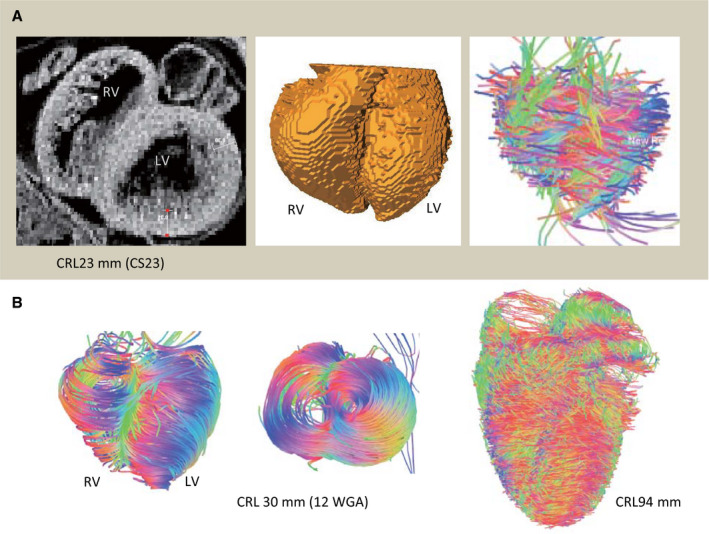
A, Embryonic heart at Carnegie stage (CS) 23: T1‐weighted magnetic resonance imaging on the upper‐middle section (left), 3‐dimensional reconstruction (middle), and fiber tracts are visualized using DSI Studio (right). B, Fetal hearts from the fetus with a crown‐rump length (CRL) of 30 mm (12 WGA) and CRL of 94 mm: fiber tracts are visualized at the ventral and apical views (CRL, 30 mm) and ventral view (CRL, 94 mm). LV indicates left ventricular; and RV, right ventricular.
The LV wall thickness of the fetus with a CRL of 30 mm (12 WGA) was 0.44 mm and that of the fetus with a CRL of 158 mm (24 WGA) was 1.99 mm (Table). LV wall thickness increased linearly according to the fetal size (CRL) (R 2=0.85). LV wall thickness was not measured in the embryonic period because it may be inaccurate owing to the thin wall and irregular cavity surface of the trabecular layer. The LV volumes of the heart from the fetus were 4.2, 9.0, and 650 mm3 for a CRL of 18 mm (CS 20; 8 WGA), 32 mm (11 WGA), and 160 mm (20 WGA), respectively (Table 1). The LV volume increased by the third power according to the increase in fetal size (CRL).
Helix Angle
In fetal heart specimens, the cross‐sectional view of the myofiber tracts coded by HA showed organized patterns in both the right and left ventricles (Figure 2). The concentric gradual changes in colors indicate a smooth transmural change in HA values (from positive to negative) in all directions of the ventricles. Any‐level and regional differences were not noted in samples of the fetus with a CRL of 23 mm (CS 23) and larger samples at the fetal period. Although the ventricular wall became thin between CS 20 and CS 22 (8 WGA), the cross‐sectional view of the myofiber tracts coded by HA also showed concentric gradual changes in colors. The transmural HA value linearly decreased for all 16 regions in the ventricles. This feature was observed in almost all small (CRL, 23 mm [CS 23] to large [CRL, 160 mm]) samples (Figure 3). Such a linear decrease in HA value of the wall was most clearly detected at the upper‐middle region, while it was occasionally ambiguous in the lower‐middle and apical regions.
Figure 2. Upper‐middle cross‐sectional view showing the myofiber tracts coded by the helix angle (HA).
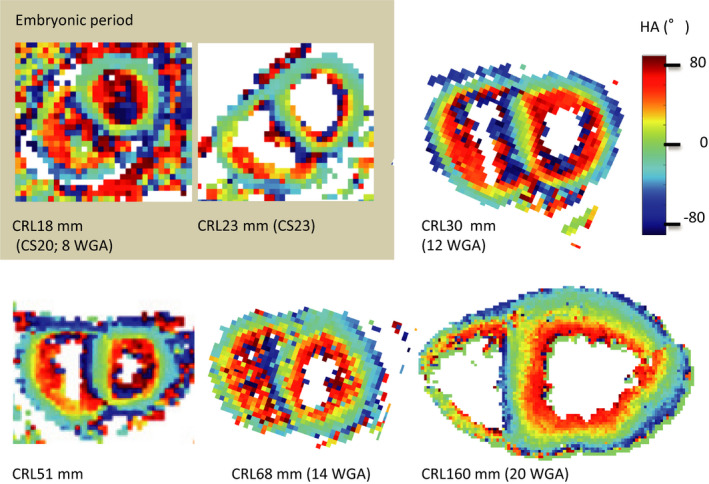
The concentric gradual changes in the colors indicate a smooth transmural change in HA values (from positive to negative) in all directions in the ventricles. Any prelevel or regional differences are not seen in the samples of the fetus with a CRL (CRL) of 23 mm and in the larger samples in the fetal period. CS indicates Carnegie stage; and WGA, weeks of gestation.
Figure 3. Transmural change in the helix angle (HA) on left and right ventricles.
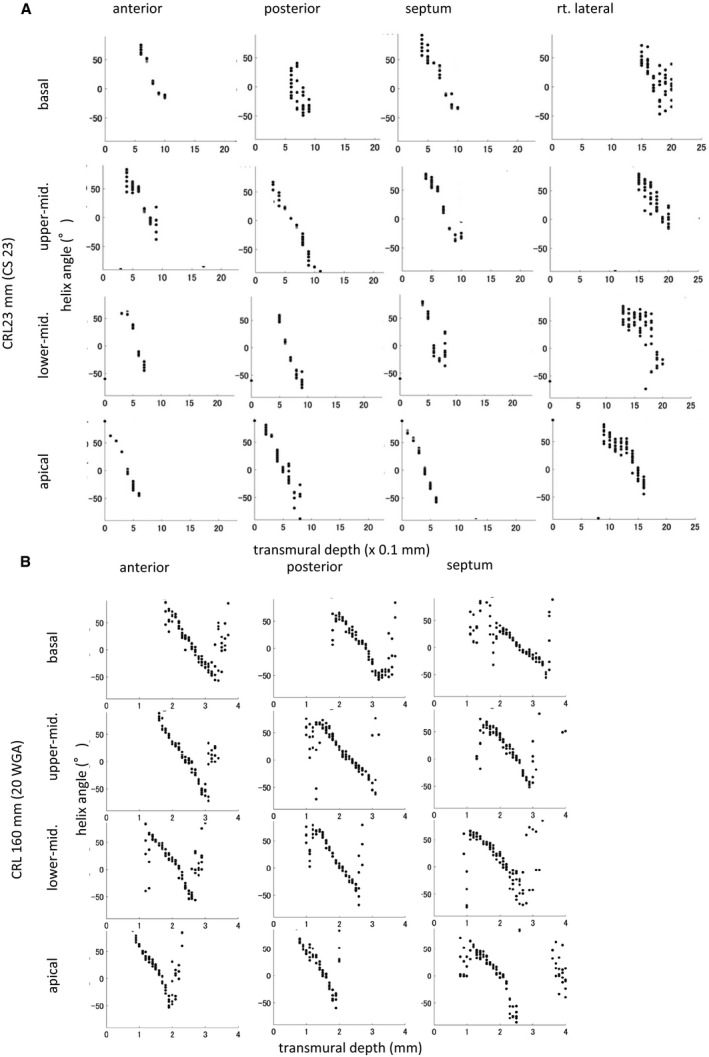
HA value against transmural depth in left ventricular wall segments of human fetal hearts from fetuses with a crown‐rump length (CRL) of 23 mm (Carnegie stage [CS] 23) (A) and CRL of 160 mm (20 weeks of gestation) (B).
Change in transmural HA in the 4 areas on the upper‐middle region of the left and right ventricles according to growth demonstrated that such linear decrease could be detected in all hearts except in smaller samples in the embryonic period (Figure 4). In that sample, the linear change in transmural HA value was interrupted at the posterior wall (Figure 4, arrow). Transmural difference in the HA value of the ventricular wall was almost constant (between 80° and 120°) in all samples but did not correlate with growth (Figure 5).
Figure 4. Change in helix angle (HA) value in the 4 areas on the upper‐middle region of the left and right ventricles according to growth.
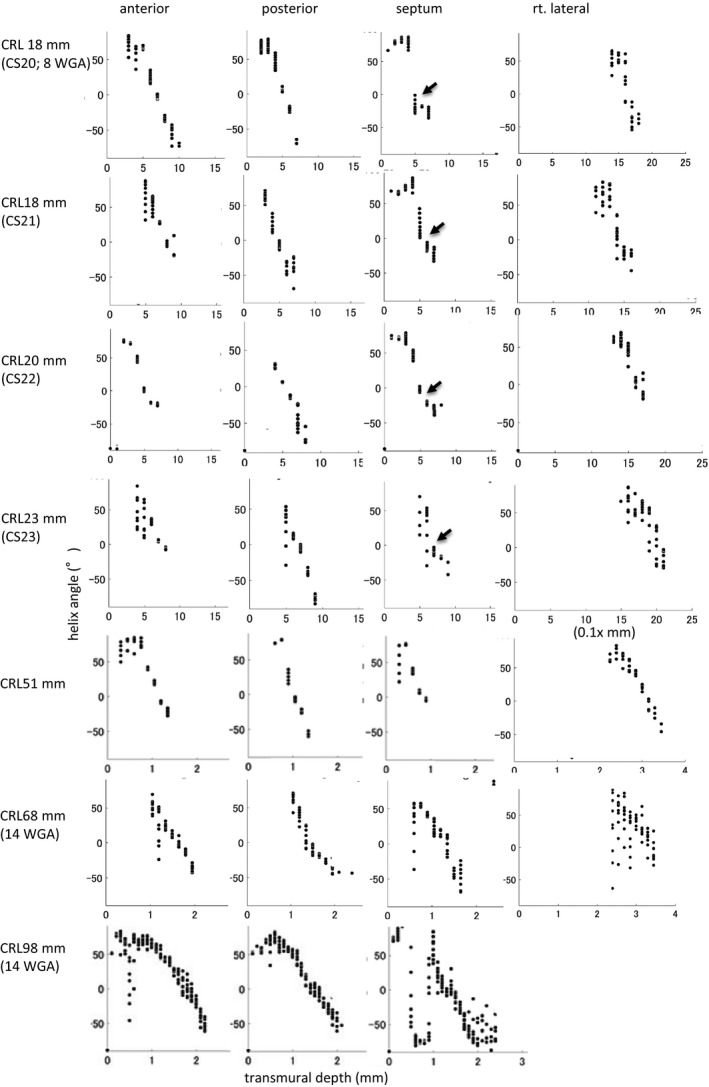
The linear change was detected in the transmural HA value in all hearts except the smaller samples in the embryonic period. Such linear change is interrupted at the posterior wall in the embryonic heart (arrow). CS indicates Carnegie stage; and CRL, crown‐rump length.
Figure 5. Transmural difference in helix angle (HA) value between the inside and outside of the ventricular wall according to growth.
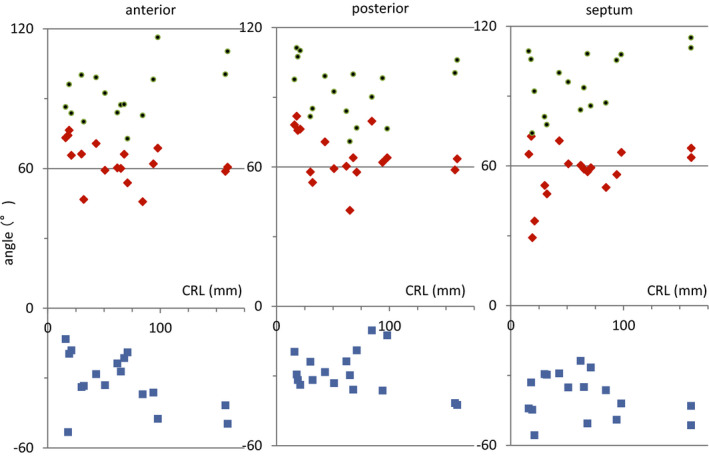
The transmural difference in HA value (green dots) is calculated as the difference between the maximum positive value inside (red rectangle) and the maximum negative value outside (blue rectangle) the ventricular wall. CRL indicates crown‐rump length.
Fractional Anisotropy
The average FA value of LV walls was ≈0.2 in the embryonic period. A higher FA value was detected at the outer side of the left anterior wall and septum at CS 20 to 22, which spread around the ventricular walls at CS 23 and early fetal samples (CRL, 30–51 mm; 11–12 WGA). The FA value of LV walls decreased in samples from fetuses with CRL 65 mm (15 WGA) and 160 mm (20 WGA), which remained low (≈0.09) (Figure 6).
Figure 6. Fractional anisotropy (FA) on ventricular walls according to crown‐rump length (CRL).
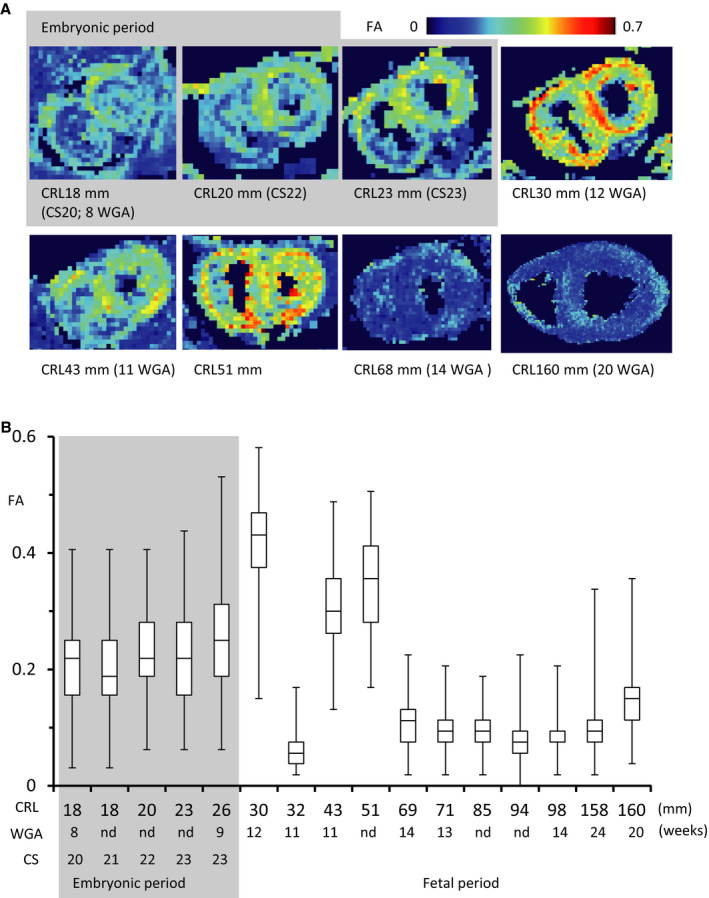
A, Upper‐middle cross‐sectional view showing the myofiber tracts coded by FA value. B, Box plots of FA values in each voxel of the entire left ventricle. In the box plots, the bars represent the sample range, the boxes represent the second and third quartiles, and the middle line represents the median. The acute change between CRL of 30 and 32 mm (12 and 11 weeks of gestation [WGA]) might be a secondary artifact. It will be worth analyzing more samples to better understand the progression.
Propagation Angle
Segments with low PA were coherent and have a low radius of curvature. The majority of tract segments had a PA of ≤20° in all of the samples examined (Figure 7). The PA in the heart is essentially uniform, except for the PA in the right ventricle and its insertion points to the septum and inside the ventricular wall (trabecular) where it is slightly increased.
Figure 7. Propagation angle (PA) on ventricular walls according to crown‐rump length (CRL).
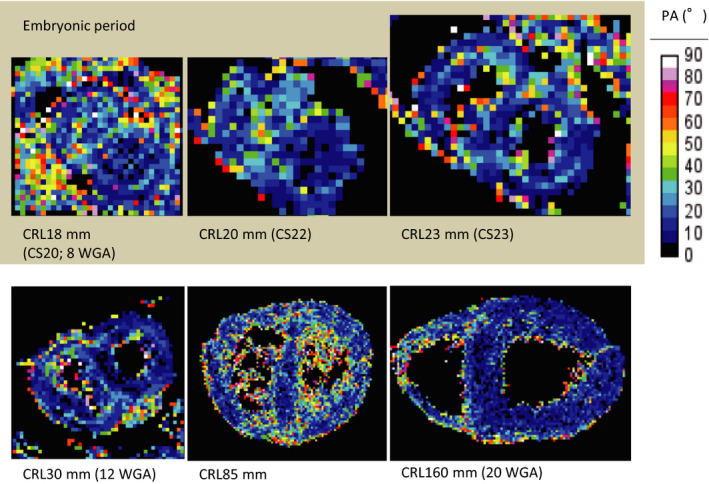
Upper‐middle cross‐sectional view showing the myofiber tracts coded by the PA value. WGA indicates weeks of gestation.
Discussion
In the present study, myocardial (ventricular) fiber orientation was determined in the late embryonic human stages (8 through 24 WGA), which was earlier than that reported in previous studies. The development of coherent myofiber tracts was detected by HA in all samples, including younger hearts, such as those at the embryonic period (CS 20–23; 8–9 WGA). The linear change in HA value was observed in all areas, except at the posterior wall in the embryonic period. The middle to outer layers at the embryonic stage may correspond to the compacted (remodeled) myocardial layer, which became thick and formed matured myocardium in the future. The border between the trabecular and remodeled myocardium may cause interruption of the linear change at the posterior wall. Moreover, the HA value showed a pattern similar to that reported in adult hearts, 11 , 12 , 13 , 14 although the difference in transmural HA value was smaller (80–120°) than that in the adult (≈120°). The present data indicated that the blueprint of the myocardial structure, organization, and integrity at the compaction (remodeling) phase of the late embryonic period are essentially similar to that of adults.
Previous studies in human hearts showed that coherent fiber tracts can be detected with HA before the detection of anisotropy of the ventricular wall by FA. 17 , 18 That is, the fetal ventricular wall at 10 to 14 weeks was highly isotropic with FA, and few tracts could be resolved with HA. The anisotropy in the heart was first detected between 14 and 19 WGA. At 19 weeks, the fetal ventricular wall was still weakly anisotropic with a low FA, while coherent fiber tracts were well resolved with HA. The FA value reflects the relative structural maturity and plasticity of the heart. Therefore, they concluded that myofiber organization and the differentiation of myocardium begins to develop between 15 and 19 WGA (second trimester) and continues to evolve after birth. That seems to be the consensus at present. However, this process lags ≈16 WGA behind the onset of cardiac pulsation and contraction (4 WGA), 1 , 2 which may be a prerequisite for cardiomyocyte maturation and alignment.
In this study, the FA value of the myocardium was high, even in samples from the embryonic period (CS 20–23; 8–9 WGA) and early fetal period (CRL, 30–51 mm; 11–12 WGA), than the FA value in larger samples from the fetal period. The FA value in such small human samples has not been previously reported. 17 , 18 A high FA value was detected mainly at the outer side of the wall, which corresponded to the layer of the compacted (remodeled) myocardium. In this study, the FA value in larger samples (CRL, 158; and 160 mm, 24, and 20 WGA, respectively) seems to be compatible with that in a previous study. 17 The relationship between histological maturation and increasing anisotropy was reported during the fetal period, 17 , 18 which was not always demonstrated in other animal models. 21 , 28 , 29 Zhang et al 28 speculated that the higher water content in fetal tissue and physiological hypertrophy of cardiomyocytes contribute to a lower FA. The acute change between a CRL of 30 and 32 mm (12 and 11 WGA, respectively) was observed in the present study. We cannot provide any data regarding whether there is an important transition in fiber alignment during this period or whether it might be a secondary artifact. It will be worth analyzing more samples to better understand the progression.
The condition for DT‐MRI acquisition may contribute to our improved results. 17 , 18 One significant difference from the previous study is the diffusion gradient sampling scheme. Namely, 30 unique sampling orientations with optimal arrangement 19 were employed in the present study while 12 18 or 24 17 orientations were used in the previous study (Table S1). Jones has shown that at least 30 unique and evenly distributed sampling orientations are required for a robust estimation of mean diffusivity, FA, and tensor‐orientation (main diffusion direction), whereas at least 20 unique sampling orientations are necessary for a robust estimation of anisotropy. 20 Therefore, the robustness of measurements for quantities such as HA and FA as well as PA estimated in the present study should be better than the previous one. Another difference is the MRI sequence. A fast imaging sequence such as echo planar imaging was generally used for DT‐MRI 17 to accelerate image acquisition. However, the acquired images often include sequence‐related artifacts such as distortions, which are problematic in diffusion tensor image analysis. Therefore, we employed standard spin echo sequence in the present study for acquiring artifact‐free images and improving reliability of estimated quantities.
Limitations
This study has some limitations. First, the present DT‐MRI resolution limits the transmural HA value in younger samples. DT‐MRI was performed with a resolution of ≈100 μm, which is sufficient to resolve transmural patterns in the myofiber architecture in fetal samples. In younger hearts, the spatial resolution of DT‐MRI was limited in the later embryonic period (CS 20–23; 8–9 WGA), where the thickness of the myocardium was <0.5 mm. The ventricle wall was resolved only by 4 to 5 points in the youngest heart (CS 20; 8 WGA). A DT‐MRI system with a much higher resolution or use of other systems to detect the fiber tract should be necessary in the analysis of a much younger heart. Garcia‐Canadilla et al 30 showed using same sample slices that the gradual change in the local HA from the endocardium to the epicardium was clearly demonstrated in the phase‐contrast x‐ray computed tomography images but not in the DT‐MRI because of limited voxels across the lateral wall. Second, samples with prolonged fixation were used. Postmortem changes in structures visualized by DT‐MRI have been shown in rats, 31 which indicate ≈3° of change in myofiber HA. The heart fibers change their direction between diastole and systole, although the present fixed samples were not examined in such phases. An inadequate signal‐to‐noise ratio associated with dehydration may result from the prolonged fixation of fetal hearts. Prolonged fixation may affect ventricular volumes and wall thickness. Third, for the measurement of HA and FA, the left ventricle was recognized as having a cylinder shape. Therefore, the results become inaccurate at the apical to the apex region and the right ventricle. A different coordinate system is required for the analysis around the apex and right ventricle.
Conclusions
The present DT‐MRI data have demonstrated coherent tracts of the myocardium since the later embryonic period, corresponding to the compaction (remodeling) phase with invasion by the developing coronary vasculature. In this study, the HA value showed a pattern quite similar to that reported in adult hearts, indicating that the blue print of the myocardial structure, organization, and integrity are already formed at the late embryonic period. These data may contribute to the emerging field of fetal cardiology and will give a quantitative insight into the normal development and activity of the human fetal heart.
Sources of Funding
This study was supported by grants 26220004, 16K15535, 17H05294, and 18K07876 from the Japan Society for the Promotion of Science.
Disclosures
None.
Supporting information
Table S1
Acknowledgments
The authors thank Chigako Uwabe and Dr Haruyuki Makishima at the Congenital Anomaly Research Center for their technical assistance in handling the human embryos. The MRI experiments of this work were performed in the Division for Small Animal MRI, Medical Research Support Center, Graduate School of Medicine, Kyoto University, Japan.
(J Am Heart Assoc. 2020;9:e05575 DOI: 10.1161/JAHA.120.016422.)
Supplementary Material for this article is available at https://www.ahajournals.org/doi/suppl/10.1161/JAHA.120.016422
For Sources of Funding and Disclosures, see page 11.
References
- 1. O'Rahilly R, Müller F. The cardiovascular and lymphatic systems In: O'Rahilly R, Müller F, eds. Human Embryology & Teratology. 3rd ed New York, NY: Wiley‐Liss; 2001:175–227. [Google Scholar]
- 2. Henderson DJ, Anderson RH. The development and structure of the ventricles in the human heart. Pediatr Cardiol. 2009;588–596. [DOI] [PubMed] [Google Scholar]
- 3. Sedmera D, Pexieder T, Vuillemin M, Thompson RP, Anderson RH. Developmental patterning of the myocardium. Anat Rec. 2000;319–337. [DOI] [PubMed] [Google Scholar]
- 4. Tomanek RJ. Developmental progression of the coronary vasculature in human embryos and fetuses. Anat Rec (Hoboken). 2016;25–41. [DOI] [PMC free article] [PubMed] [Google Scholar]
- 5. Hirschy A, Schatzmann F, Ehler E, Perriard JC. Establishment of cardiac cytoarchitecture in the developing mouse heart. Dev Biol. 2006;430–441. [DOI] [PubMed] [Google Scholar]
- 6. LeGrice IJ, Smaill BH, Chai LZ, Edgar SG, Gavin JB, Hunter PJ. Laminar structure of the heart: ventricular myocyte arrangement and connective tissue architecture in the dog. Am J Physiol. 1995;H571–H582. [DOI] [PubMed] [Google Scholar]
- 7. Streeter DD, Spotnitz HM, Patel DP, Ross J Jr, Sonnenblick EH. Fiber orientation in the canine left ventricle during diastole and systole. Circ Res. 1969;339–347. [DOI] [PubMed] [Google Scholar]
- 8. Anderson R, Ho SY, Redmann K, Sanchez‐Quintana D, Lunkenheimer PP. The anatomical arrangement of the myocardial cells making up the ventricular mass. Eur J Cardiothorac Surg. 2005;517–525. [DOI] [PubMed] [Google Scholar]
- 9. Torrent‐Guasp F, Ballester M, Buckberg GD, Carreras F, Flotats A, Carrió I, Ferreira A, Samuels LE, Narula J. Spatial orientation of the ventricular muscle band: physiologic contribution and surgical implications. J Thorac Cardiovasc Surg. 2001;389–392. [DOI] [PubMed] [Google Scholar]
- 10. Kocica MJ, Corno AF, Lackovic V, Kanjuh VI. The helical ventricular myocardial band of Torrent‐Guasp. Semin Thorac Cardiovasc Surg Pediatr Card Surg Annu. 2007;52–60. [DOI] [PubMed] [Google Scholar]
- 11. Schmitt B, Fedarava K, Falkenberg J, Rothaus K, Bodhey NK, Reischauer C, Kozerke S, Schnackenburg B, Westermann D, Lunkenheimer PP, et al. Three‐dimensional alignment of the aggregated myocytes in the normal and hypertrophic murine heart. J Appl Physiol (1985). 2009;921–927. [DOI] [PubMed] [Google Scholar]
- 12. Mekkaoui C, Huang S, Chen HH, Dai G, Reese TG, Kostis WJ, Thiagalingam A, Maurovich‐Horvat P, Ruskin JN, Hoffmann U, et al. Fiber architecture in remodeled myocardium revealed with a quantitative diffusion CMR tractography framework and histological validation. J Cardiovasc Magn Reson. 2012;70. [DOI] [PMC free article] [PubMed] [Google Scholar]
- 13. Mekkaoui C, Jackowski MP, Kostis WJ, Stoeck CT, Thiagalingam A, Reese TG, Reddy VY, Ruskin JN, Kozerke S, Sosnovik DE. Myocardial scar delineation using diffusion tensor magnetic resonance tractography. J Am Heart Assoc. 2018;9:e007834 DOI: 10.1161/JAHA.117.007834 [DOI] [PMC free article] [PubMed] [Google Scholar]
- 14. Helm P, Beg MF, Miller MI, Winslow RL. Measuring and mapping cardiac fiber and laminar architecture using diffusion tensor MR imaging. Ann N Y Acad Sci. 2005;296–307. [DOI] [PubMed] [Google Scholar]
- 15. MacIver DH, Stephenson RS, Jensen B, Agger P, Sánchez‐Quintana D, Jarvis JC, Partridge JB, Anderson RH. The end of the unique myocardial band: part I. anatomical considerations. Eur J Cardiothorac Surg. 2018;112–119. [DOI] [PubMed] [Google Scholar]
- 16. Anderson RH, Niederer PF, Sanchez‐Quintana D, Stephenson RS, Agger P. How are the cardiomyocytes aggregated together within the walls of the left ventricular cone? J Anat. 2019;697–705. [DOI] [PMC free article] [PubMed] [Google Scholar]
- 17. Mekkaoui C, Porayette P, Jackowski MP, Kostis WJ, Dai G, Sanders S, Sosnovik DE. Diffusion MRI tractography of the developing human fetal heart. PLoS One. 2013;9:e72795. [DOI] [PMC free article] [PubMed] [Google Scholar]
- 18. Pervolaraki E, Anderson RA, Benson AP, Hayes‐Gill B, Holden AV, Moore BJ, Paley MN, Zhang H. Antenatal architecture and activity of the human heart. Interface Focus. 2013;20120065. [DOI] [PMC free article] [PubMed] [Google Scholar]
- 19. Skare S, Hedehus M, Moseley ME, Li TQ. Condition number as a measure of noise performance of diffusion tensor data acquisition schemes with MRI. J Magn Reson. 2000;340–352. [DOI] [PubMed] [Google Scholar]
- 20. Jones DK. The effect of gradient sampling schemes on measures derived from diffusion tensor MRI: a Monte Carlo study. Magn Reson Med. 2004;807–815. [DOI] [PubMed] [Google Scholar]
- 21. Abdullah OM, Seidel T, Dahl M, Gomez AD, Yiep G, Cortino J, Sachse FB, Albertine KH, Hsu EW. Diffusion tensor imaging and histology of developing hearts. NMR Biomed. 2016;1338–1349. [DOI] [PMC free article] [PubMed] [Google Scholar]
- 22. Nishimura H, Takano K, Tanimura T, Yasuda M. Normal and abnormal development of human embryos: first report of the analysis of 1,213 intact embryos. Teratology. 1968;281–290. [DOI] [PubMed] [Google Scholar]
- 23. Shiota K, Yamada S, Nakatsu‐Komatsu T, Uwabe C, Kose K, Matsuda Y, Haishi T, Mizuta S, Matsuda T. Visualization of human prenatal development by magnetic resonance imaging (MRI). Am J Med Genet A. 2007;3121–3126. DOI: 10.1002/ajmg.a.31994 [DOI] [PubMed] [Google Scholar]
- 24. Yamaguchi Y, Yamada S. The Kyoto collection of human embryos and fetuses: history and recent advancements in modern methods. Cells Tissues Organs. 2018;314–319. [DOI] [PubMed] [Google Scholar]
- 25. O’Rahilly R, Müller F. Developmental Stages in Human Embryos: Including a Revision of Streeter’s Horizons and a Survey of the Carnegie Collection. Washington, DC: Carnegie Institution of Washington, 1984. [Google Scholar]
- 26. Toyoda S, Shiraki N, Yamada S, Uwabe C, Imai H, Matsuda T, Yoneyama A, Takeda T, Takakuwa T. Morphogenesis of the inner ear at different stages of normal human development. Anat Rec (Hoboken). 2015;2081–2090. [DOI] [PubMed] [Google Scholar]
- 27. Cerqueira MD, Weissman NJ, Dilsizian V, Jacobs AK, Kaul S, Laskey WK, Pennell DJ, Rumberger JA, Ryan T, Verani MS, et al. Imaging. Standardized myocardial segmentation and nomenclature for tomographic imaging of the heart. A statement for healthcare professionals from the Cardiac Imaging Committee of the Council on Clinical Cardiology of the American Heart Association. Circulation. 2002;539–542. [DOI] [PubMed] [Google Scholar]
- 28. Zhang L, Allen J, Hu L, Caruthers SD, Wickline SA, Chen J. Cardiomyocyte architectural plasticity in fetal, neonatal, and adult pig hearts delineated with diffusion tensor MRI. Am J Physiol Heart Circ Physiol. 2013;H246–H252. [DOI] [PMC free article] [PubMed] [Google Scholar]
- 29. Wu Y, Wu EX. MR study of postnatal development of myocardial structure and left ventricular function. J Magn Reson Imaging. 2009;47–53. [DOI] [PubMed] [Google Scholar]
- 30. Garcia‐Canadilla P, Dejea H, Bonnin A, Balicevic V, Loncaric S, Zhang C, Butakoff C, Aguado‐Sierra J, Vázquez M, Jackson LH, et al. Complex congenital heart disease associated with disordered myocardial architecture in a midtrimester human fetus. Circ Cardiovasc Imaging. 2018;9:e007753 10.1161/CIRCIMAGING.118.007753 [DOI] [PubMed] [Google Scholar]
- 31. Hales PW, Burton RAB, Bollensdorff C, Mason F, Bishop M, Gavaghan D, Kohl P, Schneider JE. Progressive changes in T1, T2 and left ventricular histo‐architecture in the fixed and embedded rat heart. NMR Biomed. 2011;836–843. [DOI] [PMC free article] [PubMed] [Google Scholar]
Associated Data
This section collects any data citations, data availability statements, or supplementary materials included in this article.
Supplementary Materials
Table S1


