

Abstract
Background
Evidence regarding the relationships among high plasma triglycerides (TG), all‐cause mortality, and atherosclerotic cardiovascular disease (ASCVD) events in low‐to‐moderate risk individuals is limited. The aim of this study was to determine whether the presence of high TG levels influences the risk of all‐cause mortality and ASCVD events in a population cohort followed in the real‐world clinical setting.
Methods and Results
A retrospective longitudinal cohort analysis using administrative databases of 3 Italian Local Health Units was performed. All individuals with at least one TG measurement between January 1, 2010 and December 31, 2015 were followed through December 2016. Outcome measures included incident ASCVD events and all‐cause mortality. Individuals with normal TG levels (<150 mg/dL) were compared with those with high (150–500 mg/dL) and very high TG (>500 mg/dL). 158 042 individuals (142 289 with normal, 15 558 with high, and 195 with very high TG) were considered. In the whole cohort, the overall incidence rates of ASCVD and all‐cause mortality were 7.2 and 17.1 per 1000 person‐years, respectively. After multivariate adjustment for potential confounders, individuals with high and very high TG showed a significantly increased risk of all‐cause mortality (hazard ratio [HR]=1.49 [95% confidence interval (CI) 1.36–1.63], P<0.001, and HR=3.08 [95% CI 1.46–6.50], P<0.01, respectively) and incident ASCVD events (HR=1.61 [95% CI 1.43–1.82], P<0.001, and HR=2.30 [95% CI 1.02–5.18], P<0.05, respectively) as compared to those with normal TG.
Conclusions
Moderate‐to‐severe elevation of TG is associated with a significantly increased risk of all‐cause mortality and ASCVD events in a large cohort of low‐to‐moderate cardiovascular risk individuals in a real‐world clinical setting.
Keywords: all‐cause mortality, atherosclerotic cardiovascular disease, hypertriglyceridemia, real‐world, triglycerides
Subject Categories: Metabolic Syndrome, Mortality/Survival, Quality and Outcomes
Nonstandard Abbreviations and Acronyms
- ASCVD
atherosclerotic cardiovascular disease
- ATC
Anatomical Therapeutic Chemical classification system
- CKD
chronic kidney disease
- COPD
chronic obstructive pulmonary disease
- HDL‐C
high‐density lipoprotein cholesterol
- HR
hazard ratio
- HTG
hypertriglyceridemia
- ICD‐9‐CM
International Classification of Diseases, Ninth Revision, Clinical Modification
- LDL‐C
low‐density lipoprotein cholesterol
- LHU
Local Health Unit
- TG
total plasma trilgycerides
Clinical Perspective
What Is New?
Evidence indicates that triglyceride levels are related to cardiovascular events and mortality; however, this relationship has not been well explored in individuals at low-to‐moderate baseline risk followed in a real‐world clinical setting.
This study reports that hypertriglyceridemia, even in the moderate range of values (150–500 mg/dL), is a significant predictor of atherosclerotic cardiovascular disease risk in a large cohort of individuals at low-to‐moderate risk.
What Are the Clinical Implications?
The main clinical implication of our findings is that they further support the concept that triglyceride measurement must be considered an important part of the routine evaluation for all patients (including those estimated to be at low risk) to manage cardiovascular risk.
Several lines of evidence indicate a strong association between hypertriglyceridemia (HTG) and cardiovascular disease. 1 , 2 In particular, data from Mendelian randomization studies, circumventing potential confounders, have supported a direct causal relationship between increased levels of triglyceride (total plasma trilgycerides [TG])‐rich lipoproteins and the risk of atherosclerotic cardiovascular disease (ASCVD) events. 3 , 4 In addition, there are reports indicating that HTG may also have a significant impact on total mortality. 5
The role of HTG in favoring adverse cardiovascular events has been convincingly demonstrated in high‐risk individuals requiring statin therapy. 6 , 7 , 8 As a consequence, guidelines recommend addressing HTG as part of the strategy to control the residual cardiovascular risk in these individuals. 9 Conversely, the role of HTG in influencing cardiovascular outcomes in individuals at low‐to‐moderate risk not requiring statin therapy is less well established.
Different cut‐off values have been suggested by task forces and national societies for elevated TG. However, there is a consensus of using TG >150 mg/dL (>1.7 mmol/L) as the definition of HTG. 10 This condition, which represents a common clinical finding, could be used to identify individuals at increased cardiovascular risk especially among those not requiring statin therapy followed in a real‐world clinical setting. However, real‐world evidence of the relationship between HTG and all‐cause mortality and incidence of ASCVD events in this context is limited. In addition, further clarification of outcomes associated with HTG is of importance in light of the population increase in the prevalence of metabolic factors favoring HTG development, such as obesity, sedentary lifestyle, and insulin resistance and features of metabolic syndrome. 11 Moreover, addressing this issue may further raise awareness among general practitioners and other clinicians about therapeutic targeting of elevated TG levels.
Therefore, we conducted a retrospective, observational, longitudinal cohort study using the electronic health records of patients in integrated administrative databases to determine whether the presence of high TG levels influences the risk of all‐cause mortality and ASCVD events in a real‐world low‐risk population.
Materials and Methods
Due the nature of the agreement between the research team and the Local Health Units (LHUs), the original individual data used to conduct the present analysis cannot be made available to any researcher for purposes of reproducing the results or replicating the procedure.
Data Sources
In the present retrospective study, data were extracted from the administrative databases of 5 Italian LHUs, geographically distributed in the national territory (Lombardia, Liguria, Piemonte, Abruzzo, and Puglia). The following databases were assessed: (1) beneficiaries database, which includes data on patients’ characteristics; (2) pharmaceuticals database, which includes the Anatomical Therapeutic Chemical (ATC) code of the drug dispensed, the number of packs dispensed, the number of units per pack, the dose, the unit cost per pack, and the prescription date; (3) hospitalization database, which includes all hospitalization data with the primary and secondary discharge diagnosis codes classified according to the International Classification of Diseases, Ninth Revision, Clinical Modification (ICD‐9‐CM); (4) laboratory tests and specialist visits database; and (5) laboratory test value database. Herein, we focused on 3 LHUs for whom laboratory test values database were available.
In full compliance with the Italian Code of Protection of Personal Data, databases were anonymized and each patient was identified by an anonymous code, which permitted the electronic linkage between these databases. Data were extracted by administrative staff and no identifiers related to patients were provided to researchers. Results of analyses were produced as aggregated summaries to prevent, either directly or indirectly, any link to individual patients. Informed consent was not required for using encrypted retrospective information. According to Italian law, 12 this study has been submitted to the local Ethical Committees of the LHU involved in the study and approved by each. The Ethical Committees are: Regional Ethics Committee Liguria at San Martino Hospital of Genoa, Ethics Committee of Avezzano‐Sulmona‐L’Aquila responsible for Teramo and L’Aquila, Ethics Committee of Bergamo at Papa Giovanni XXIII Hospital of Bergamo, Ethics Committee of Lecce, and Ethics Committee Interaziendale at AO Nazionale SS Antonio e Biagio e Cesare Arrigo of Alessandria responsible for the ASL of Vercelli and Alessandria.
Cohort Definition and Data Collection
All individuals with at least one TG measurement between January 1, 2010 and December 31, 2015 (inclusion period) were considered. Patients were excluded if they had: (1) substantial variation in TG measurements during follow‐up period, ie, TG measurements not included in the categorization criteria defined for this study (see details on group categorization in the following paragraphs); (2) at least one prescription of omega 3 fatty acids or fibrates during both the characterization and the follow‐up period; (3) at least one prescription of antiplatelet drugs during the characterization period because it may be considered as a proxy of vascular disease; (4) before inclusion at least one hospitalization for myocardial infarction or any other of the following: angina pectoris, chronic cardiac ischemia, occlusion and stenosis of carotid arteries, and transient cerebral ischemia.
The index date was defined for all included patients as the date of the first TG measurement during the inclusion period; starting from this date, patients were retrospectively characterized up to 12 months, and events occurring until December 31, 2016 were considered (characterization and follow‐up periods, respectively).
Results of fasting lipid profiles measured in district laboratories following standard procedure were extracted from laboratory test databases. According to previously reported criteria for classification of TG levels, 13 individuals were categorized into 3 groups based on TG measurements available in the follow‐up period: (1) “normal TG” group, those with normal TG (all measurements <150 mg/dL), (2) “high TG” group, those with high TG (all measurements between 150–500 mg/dL), and (3) “very high TG” group, those with very high TG (all measurements >500 mg/dL).
During the characterization period, data on baseline characteristics were collected including demographics (age and sex) and medical history (hospital admission, procedures, prescribed drugs, and comorbidities). Comorbidities were identified from diagnoses at hospital discharge (both primary and secondary diagnosis, ICD‐9‐CM codes) derived from hospitalization databases, and drug prescriptions (ATC codes) derived from pharmaceutical databases, considering specific medication prescriptions as proxy of diseases. No data on obesity or alcohol use were available. The following diagnoses during the characterization period were also considered: acute pancreatitis (ICD‐9‐CM code: 577), kidney disease (ICD‐9‐CM code: 585), and chronic obstructive pulmonary disease (ATC code: R03). The prescription of the following drugs was analyzed during the 12‐month characterization period (at least one prescription): antidiabetic medications (ATC code A10), statins (ATC codes C10AA, C10BA02), antihypertensive medications (ATC codes C03, C07, C08, C09), and anticoagulant medications (ATC codes B10AA, B10AB). Moreover, the last available measurements of total cholesterol (mg/dL) and high‐density lipoprotein cholesterol (HDL‐C) (mg/dL) before index date were considered.
Outcome measures during the follow‐up period included diagnosis of ASCVD events and all‐cause mortality. ASCVD was defined as admissions for myocardial infarction (ICD‐9‐CM code: 410), angina pectoris (ICD‐9‐CM code: 413), chronic cardiac ischemia (ICD‐9‐CM code: 414), occlusion and stenosis of the pre‐cerebral arteries (ICD‐9‐CM code: 433), occlusion of cerebral arteries (ICD‐9‐CM code: 434), transient cerebral ischemia (ICD‐9‐CM code: 435), cerebral circulatory disorders (ICD‐9‐CM code: 436), other and poorly defined cerebral vasculopathies (ICD‐9‐CM code: 437), atherosclerosis (ICD‐9‐CM code: 440), aneurysm of the aorta (ICD‐9‐CM code: 441), other aneurysms (ICD‐9‐CM code: 442), and vascular diseases (ICD‐9‐CM code: 443).
Statistical Analysis
Continuous data are presented as means ± standard deviation or median and interquartile range and categorical variables as numbers and percentages. Pearson’s chi‐square and one‐way analysis of variance tests were used to compare categorical variables and continuous variables, respectively. Non‐parametric Mann–Whitney U test was used for nonnormally distributed variables. ASCVD and all‐cause mortality occurring over the follow‐up period were expressed through the crude incidence rates, which represented the number of ASCVD events or deaths during the specified time interval divided by total time (years) in which each individual was exposed to the risk of the event in the follow‐up period. The result is expressed as an annual rate per 1000 persons at risk. Multivariate analysis of the association of severity grade of HTG with long‐term adverse outcomes (ASCVD or all‐cause death) was performed using the Cox proportional hazards model, giving hazard ratios (HRs) and 95% confidence intervals (95% CI). Covariates for HR adjustment were identified after a forward stepwise selection as follows: age, sex, hypertension, diabetes mellitus, chronic kidney disease (CKD), previous cardiovascular hospitalizations, antidiabetic medication, statin medication, antihypertensive medication, anticoagulant medication, total cholesterol, and HDL‐C. CKD was defined as at least one hospitalization for CKD ICD‐9‐CM code 585 during the period before the index date. As a definite diagnosis of diabetes mellitus and hypertension was not available in the database, we considered the use of antihypertensive and antidiabetic medications as proxy of the presence of clinically overt diabetes mellitus and hypertension.
The results were considered statistically significant when the P‐value was <0.05. STATA SE software version 12.1 was used for statistical analyses.
Results
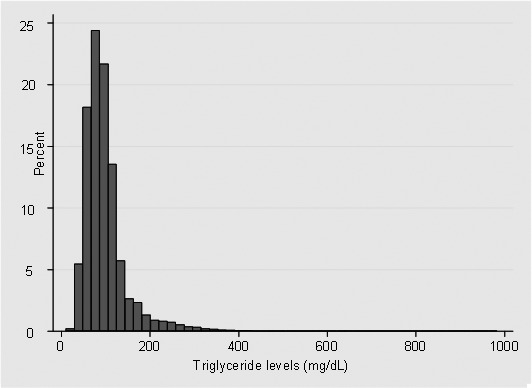
Of the 709 043 health‐assisted population, 158 042 patients were included in the study. A flowchart of the study population selection is presented in Figure 1. Among included patients, 90% (142 289) were categorized in the “normal TG” group, 9.9% (15 588) in the “high TG” group, and 0.1% (195) in the “very high TG” group. The distribution of TG plasma concentration (last measurement before index date) in the study population is shown in Figure 2. During follow‐up, included patients had, on average, two TG measurements recorded.
Figure 1. Study population flowchart.
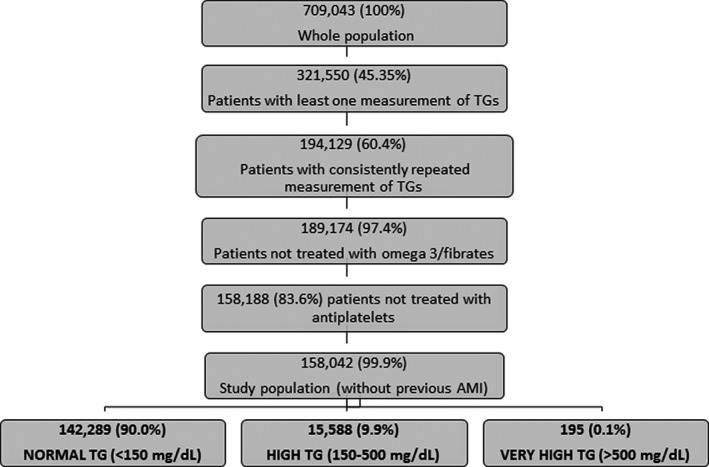
AMI indicates acute myocardial infarction; and TG, total plasma triglycerides.
Figure 2. Distribution of triglyceride levels among the study population (last measurement before index date, mg/dL).
Baseline characteristics of the whole study population as well as according to TG levels are described in Table 1. Overall, enrolled individuals had a mean age of 53.4±19.3 years and 42% were men. In comparison with other groups, very high TG subjects were significantly younger and showed higher prevalence in men. Individuals with normal TG showed mean TG levels of 85.3±25.2 mg/dL, while those with high and very high showed mean TG levels of 214±62.1 and 772.2±320.6 mg/dL, respectively, a difference that was highly statistically significant (P<0.001). Mean levels of non–HDL‐C, which reflects the total burden of atherogenic apo B–containing lipoproteins in the plasma, were significantly higher in individuals with high and very high TG in comparison with those with normal TG. Similarly, plasma levels of total cholesterol were significantly raised in high and very high TG individuals in comparison with normal TG subjects. Given the inverse correlation between TG and HDL‐C levels, the latter showed a clear progressive reduction from individuals with normal toward those with very high TG. As low‐density lipoprotein cholesterol (LDL‐C) concentrations were calculated by Friedwald’s formula, they could not be estimated among individuals with very high TG levels. However, LDL‐C levels were significantly elevated in high versus normal TG individuals.
Table 1.
Baseline Characteristics of Study Population According to Triglyceride Levels
| Total Study Population | Normal TG | High TG | Very High TG | P for Trend | |
|---|---|---|---|---|---|
| Population, n (%) | 158 042 (100) | 142 289 (90.0) | 15 558 (9.8) | 195 (0.1) | … |
| No. of TG measurements, n (SD) | 2.5±2.2 (2.0) | 2.6±2.2 (2.0) | 1.5±1.0 (1.0) | 1.2±0.5 (1.0) | <0.001 |
| Demographic characteristics | |||||
| Age, y (mean±SD; [IQR]) | 53.4±19.3; (28.0) | 53.4±19.5; (29.0) | 54.3±17.0; (23.0) | 47.3±12.5; (14.0) | <0.001 |
| Men, n (%) | 66 570 (42.1) | 57 537 (40.4) | 8870 (57.0) | 163 (83.6) | <0.001 |
| Plasma lipids | |||||
|
Total TG, mg/dL mean (average during the observational period)±SD |
98.8±55.8 | 85.3±25.2 | 214.3±62.1 | 772.2±320.6 | <0.001 |
|
Total TG, mg/dL mean (last measurement prior to ID)±SD |
99.1±57.2 | 85.5±27.9 | 214.6±65.3 | 761.3±320.9 | <0.001 |
|
Total cholesterol, mg/dL mean (last measurement prior to ID)±SD |
199.1±41.3 | 196.5±40.2 | 221.7±43.7 | 273.5±69.4 | <0.001 |
|
Non‐HDL cholesterol, mg/dL mean (last measurement prior to ID)±SD |
140.3±39.2 | 136.2±36.8 | 175.6±40.3 | 241.0±70.1 | <0.001 |
|
HDL cholesterol, mg/dL mean (last measurement prior to ID)±SD |
60.4±17.1 | 62.0±16.7 | 46.0±13.3 | 34.0±9.9 | <0.001 |
|
LDL cholesterol, mg/dL mean (last measurement prior to ID)±SD |
120.3±35.4 | 118.9±34.8 | 133.9±38.6 | … | <0.001 |
| Medications | |||||
| Statins, n (%) | 9243 (5.8) | 8079 (5.7) | 1156 (7.4) | 8 (4.1) | <0.001 |
| Anticoagulants, n (%) | 9227 (5.8) | 8358 (5.9) | 857 (5.5) | 12 (6.2) | n.s. |
| Antihypertensives, n (%) | 43 660 (27.6) | 38 421 (27.0) | 5191 (33.4) | 48 (24.6) | <0.001 |
| Antidiabetics, n (%) | 7089 (4.5) | 6122 (4.3) | 955 (6.1) | 12 (6.2) | <0.001 |
| Comorbidities | |||||
| Acute pancreatitis, n (%) | 246 (0.2) | 215 (0.2) | 31 (0.2) | 0 (0.0) | n.s. |
| COPD, n (%) | 18 650 (11.8) | 16 983 (11.9) | 1654 (10.6) | 13 (6.7) | <0.001 |
| CKD, n (%) | 428 (0.3) | 382 (0.3) | 46 (0.3) | 0 (0.0) | n.s. |
ASCVD indicates atherosclerotic cardiovascular disease; CKD, chronic kidney disease; COPD, chronic obstructive pulmonary disease; HDL, high‐density lipoprotein; ID, index date; IQR, interquartile range; LDL, low‐density lipoprotein; n.s., not significant; SD, standard deviation; and TG, triglycerides.
Overall, the prevalence of history of acute pancreatitis or CKD was very small and did not differ between groups.
In the whole study group, only a small percentage of individuals (<6%) was prescribed statins and antidiabetic treatments and about one fourth was using antihypertensive medications. When the different therapies were examined according to the TG categories, individuals with high but not those with very high TG tended to show higher use of statins and hypertensive medications in comparison with normal TG individuals. On the contrary, both individuals in the high and very high TG categories showed a significantly higher use of antidiabetic medications in comparison with those in the normal TG group, thus suggesting an increased prevalence of diabetes mellitus among the high TG group. Anticoagulant medications also showed a limited use in the whole study cohort and we did not find differences between groups.
Table 2 presents event rates and adjusted HRs for ASCVD events and overall mortality in the study population during follow‐up. During a median follow‐up period of 37.8 months (interquartile range 23.4–54.2 months), ASCVD events were registered for 1.6% of subjects and 3.9% died of any cause. This determined a crude incidence of ASCVD events of 7.2 for 1000 person‐years and a crude incidence of all‐cause mortality of 17.1 for 1000 person‐years. Moreover, a tendency toward an increased risk of adverse outcomes according to different HTG categories was observed. Indeed, age‐ and sex‐adjusted HRs for ASCVD were 2.21 (95% CI 1.99–2.44; 14.8 events per 1000 person‐years) in the high TG group and 3.85 (95% CI 1.72–8.58; 16.2 events per 1000 person‐years) in the very high TG group. After adjustment for multiple potential confounders, the risk estimates for ASCVD attenuated but remained highly statistically significant for both high and very high TG groups (HR 1.61 [95% CI 1.43–1.82], P<0.001 and HR 2.30 [95% CI 1.02–5.18], P<0.05, respectively). Similarly, a significant association was observed for total mortality for both high and very high TG groups (HR 1.49 [95% CI 1.36–1.63], P<0.001 and HR 3.08 [95% CI 1.46–6.50], P<0.01, respectively).
Table 2.
Event Rates and Adjusted Hazard Ratios for All‐Cause Mortality and ASCVD Events in the Study Population, According to Triglyceride Levels
| Triglyceride Levels (mg/dL) | Events (Number) | Crude Incidence per 1000 person/y | Age and Sex Adjusted HR [CI, P Value] |
Multivariate Adjusted* HR [CI, P Value] |
|---|---|---|---|---|
| ASCVD events | ||||
| Normal TG | 2076 | 6.4 | 1 | 1 |
| High TG | 459 | 14.8 | 2.21 [1.99–2.44, P<0.001] | 1.61 [1.43–1.82, P<0.001] |
| Very high TG | 6 | 16.2 | 3.85 [1.72–8.58, P=0.001] | 2.30 [1.02–5.18, P<0.05] |
| Total | 2541 | 7.2 | ||
| Overall mortality | ||||
| Normal TG | 5346 | 16.4 | 1 | 1 |
| High TG | 747 | 24.2 | 1.61 [1.49–1.74, P<0.001] | 1.49 [1.36–1.63, P<0.001] |
| Very high TG | 7 | 18.9 | 3.15 [1.50–6.61, P<0.01] | 3.08 [1.46–6.50, P<0.01] |
| Total | 6100 | 17.1 | ||
ASCVD indicates atherosclerotic cardiovascular disease; CI, confidence interval; HR, hazard ratio; and TG, triglycerides.
Discussion
In this retrospective, observational longitudinal cohort study involving 158 042 individuals in the setting of local health services, we found that individuals with TG levels >150 mg/dL were at significantly increased risk of all‐cause mortality and incident ASCVD over a mean follow‐up of 3.2 years, when compared to individuals with TG levels <150 mg/dL. This finding persisted even after controlling for a number of demographic and clinical risk factors. In addition, when we subcategorized HTG, individuals with TG in the 150 to 500 mg/dL range showed a 1.6‐fold higher risk of ASCVD as compared to individuals with normal TG. It is noteworthy that these figures were obtained in a cohort showing a projected 10‐year incidence of ASCVD events of 7%. Therefore, our findings expand the role of HTG in predicting cardiovascular risk also in individuals presenting a low‐to‐moderate cardiovascular risk. The lack of increased ASCVD risk after multiple adjustments in the very high TG category may be partially explained by the small number of individuals exposed to high TG concentration (mean 772.2±320.6 mg/dL). Moreover, it might be not surprising as it has been indicated that plasma TG levels within this range are more associated with pancreatic than cardiovascular complications. 14
Our observations are consistent with several, but not all, studies investigating the relationship between elevated TG and the risk of ASCVD in the general population.15, 16, 17, 18, 19 The Emerging Risk Factors Collaboration (n>300 000) demonstrated that the HR for coronary heart disease as a result of elevated TG was 1.37 (95% CI 1.31–1.42) when adjusted for non–lipid factors and became nonsignificant (0.99, 95% CI 0.94–1.05) when adjusted for HDL‐C and non–HDL‐C. 15 On the contrary, three other large meta‐analyses of studies found that TG levels showed a significant and independent association with cardiovascular events, providing adjusted odds ratio values ranging from 1.57 (95% CI 1.10–2.24) to 1.8 (95% CI 1.49–2.19) when individuals with TG in the top tertile were compared to those with TG in the bottom tertile.16, 17, 18, 19
Epidemiologic data and meta‐analyses have also demonstrated that mild‐to‐moderate HTG is associated with an increased risk of all‐cause mortality. 18 , 19 , 20 , 21 In particular, an analysis, combining data from the Copenhagen City Heart Study and the Copenhagen General Population Study and including 98 515 individuals with 14 547 events during a median follow‐up of 6 years, has shown that non–fasting TG levels of 6.6 mmol/L (commensurable to fasting levels of ≈440 mg/dL) versus 0.8 mmol/L (commensurable to fasting levels of 60 mg/dL) was associated with an age‐ and sex‐adjusted HR of 2.2 for all‐cause mortality. 2 Figures in our cohort were similar, as in the category of TG 150 to 500 mg/dL the adjusted HR of all‐cause mortality was 1.5 times higher than that in normotriglyceridemic individuals. We must note that in our cohort the all‐cause mortality rate was higher than that of incident fatal and nonfatal ASCVD events. These data are difficult to interpret because, due to the nature of an administrative database, we were not able to evaluate the components of all‐cause mortality. However, one could postulate that our decision of excluding individuals with previous cardiovascular events and/or taking antiplatelet medications (a proxy of pre‐existing vascular disease), might have inflated the occurrence of noncardiovascular cause of death. To this regard, it is worth mentioning that about 12% of individuals in our cohort reported previous history of chronic obstructive pulmonary disease. Our cohort may reasonably be taken as representative of HTG individuals usually seen in real‐life clinical practice. Even though we were not able to determine the prevalence of obesity, study individuals showed the diabetic/hypertensive phenotype typically associated with HTG. This is indirectly suggested by the increased frequency among HTG individuals of use of antidiabetic and antihypertensive medications, which were particularly elevated in the very high TG category. In addition, the severity of HTG was associated with male sex. These relationships were consistently observed in previous cohorts 22 , 23 , 24 and confirm the clustering of elevated TG with the features of metabolic syndrome. Furthermore, TG level distribution in the whole cohort showed the expected skewed distribution with a mean of 99 mg/dL, which is very close to the 50th percentile of the Italian general population (111 mg/dL for men and 98 mg/dL for women). 25 In addition, the prevalence of HTG (as defined by TG >150 mg/dL) was 10%. Indeed, few data are available in the literature describing the prevalence of HTG in Italy. In a recent survey of a large database from general Italian practitioners it was shown that HTG, defined as TG >200 mg/dL, was 4.4%. 26 Additional estimates can be derived considering the prevalence in Italy of metabolic syndrome, which has been reported to be approximately 25% to 30%. Assuming that about 1 in 3 patients with metabolic syndrome show the HTG phenotype, 27 this may generate a prevalence of HTG ranging from 8% to 10%, a figure very similar to that observed in our cohort.
It is worth pointing out that the frequency of statin use was very limited in the overall study population. This was particularly evident among individuals with very high TG levels despite this group having a high non–HDL‐C concentration. This appears in contrast to recommendations of current guidelines, which suggest targeting non–HDL‐C in individuals with moderate‐to‐severe HTG by using statins as the first‐choice drug. 9 However, it may reflect, in general, a lack of treating individuals with a predominant HTG phenotype in current clinical practice. This appears to be true not only for statins, but also for other TG‐lowering medications. In fact, only 2.6% of individuals in the source population were excluded from analysis due to current use of fibrates or omega‐3 therapy (see Figure 1). In agreement with this finding, a survey carried out among general practitioners indicated that among 1653 patients who had at least 3 measurements of TG ≥200 mg/dL, only 21.6% received at least 1 prescription of TG‐lowering drugs in the year following the last measurement. 26 On the other hand, the limited use of statins in our HTG cohort might have emphasized the impact of HTG on the risk of incident ASCVD and all‐cause mortality. Although this could raise questions of generalizability, our findings may allow an estimate of the clinical impact of inertia in the HTG management in a real‐world setting.
The demonstration that HTG increases the risk of ASCVD may have relevant clinical significance due to the recent demonstration that lowering TG significantly reduces the risk of ischemic events. 28 In REDUCE‐IT (Reduction of Cardiovascular Events with Icosapent Ethyl–Intervention Trial), the risk of the primary composite end point of cardiovascular death, nonfatal myocardial infarction, nonfatal stroke, coronary revascularization, or unstable angina, was significantly lower, by 25%, in HTG patients (median TG level of 216 mg/dL) who received 2 g of the omega‐3 icosapent ethyl twice daily than in patients who received placebo. It is interesting to note that this beneficial effect also extended to patients in primary prevention in which the relative risk of ischemic events was reduced by 18%. It is noteworthy that in REDUCE‐IT total mortality was also beneficially affected by the TG‐lowering action of omega‐3 fatty acids.
Strengths of our study include large sample size and follow‐up of up to 6 years, which allowed us to capture a sufficient number of events to find significant differences between groups. It is well known that the definition of HTG is complicated by considerable intra‐individual variability in TG over time. 29 To limit this potential source of bias, we have based our classification of high TG categories on at least two concordant TG measurements taken some time apart. Furthermore, the inclusion of several covariates allowed us to isolate the effect of the TG grouping on adverse outcomes. Previous studies enrolled patients with a broad range of TG levels and evaluated their effect either continuously, after log transformation, or by comparing dichotomized cut‐off points or upper and lower tertiles or quintiles of TG.15, 16, 17, 18, 19 While these characterizations of TG levels deliver significant evidence of an association with risk, they are of restricted clinical value because they do not match guideline‐recognized elevated ranges of TG levels. 9 In contrast, our study focused on a definition of HTG that can be easily implemented in clinical practice to characterize individual risk.
Our study also has notable limitations to be acknowledged. We used observational laboratory data that do not contain a reliable determination of fasting status at the time of the TG tests. Because fasting blood test is the preferred recommendation for diagnosing HTG, 30 it is likely that the majority of the tests were fasting. However, it has been suggested that nonfasting TG are better predictors of increased risk of ASCVD as they are more efficient in capturing abnormalities in remnant metabolism. 13 As nonfasting TG levels are substantially higher than fasting TG levels, 31 the resulting misclassification of patients with normal fasting but high postprandial TG levels would have biased our results toward the null. Therefore, our estimates of excess outcomes risk in the high TG groups may therefore be conservative. By design, we assessed risk factors (including TG levels) only at baseline. Whether changes in lipid parameters as well as in pharmacological treatments during follow‐up affected our results is not known. Data on important confounders such as body mass index, alcohol consumption, fasting glycemia, and uric acid levels were not available and therefore this is also a limitation. It is well known that real‐world studies may comprise erroneous recording of health events, missing data, and ambiguity about internal validity. Despite these limitations, analysis of real‐world data can deliver vital information about patient risk as seen in clinical practice. 32
Conclusions
We found that, compared with normal TG, moderate‐to‐severe elevation of TG is associated with a significant, stepwise increased risk of all‐cause mortality and ASCVD events in a large cohort of individuals followed in a real‐world clinical setting.
Appendix
Local Health Units Group
Caterina Montinari—Local Health Unit Lecce, 73100, Lecce, Italy. Alessia Pisterna—Local Hospital Pharmacy, University Policlinic of Novara, 28100, Novara, Italy. Stefania Demontis—Clinical and Home Artificial Nutrition Unit, ASL1 Imperiese, 18038 Sanremo, Italy. Ilenia Senesi—U.O.C. Local Pharmaceutical Service, Local Health Unit Teramo, 64100, Teramo, Italy.
Sources of Funding
Alfasigma (Italy) purchased the study report that is the basis for this article. The views expressed here are those of the authors and not necessarily those of the supporters. Alfasigma did not influence the conduction of the project, the discussion of results, and the decision to submit the manuscript to this journal.
Disclosures
Arca has received research grant support from Aegerion, Amgen, IONIS, Akcea Therapeutics, Pfizer, Regeneron, and Sanofi; has served as a consultant for Amgen, Aegerion, Akcea Therapeutics, Regeneron, Sanofi, and Alfasigma; and received lecturing fees from Amgen, Aegerion, Merck, Pfizer, Sanofi, and Alfasigma. Borghi has received research grant support from Menarini Corporate and Novartis Pharma; has served as a consultant for Novartis Pharma, Alfasigma, Grunenthal, Menarini Corporate, and Laboratoires Servier; and received lecturing fees from Laboratoires Servier, Takeda, Astellas, Teijin, Novartis Pharma, Berlin Chemie, and Sanofi. Pontremoli has served as a consultant for and has received lecturing fees from Novartis, MSD, AstraZeneca, Boehringer‐Ingelheim, Lilly, Teijin, Astellas, and Alfasigma. De Ferrari has received research grant support from Amgen, Merck, and Novartis; has served as a consultant for Amgen, Boston Scientific, Livanova, Merck, and Sigma‐Tau; and received lecturing fees from Amgen, Merck, and Sigma‐Tau. Colivicchi has been consultant per Sigma‐Tau, MSD, AstraZeneca, and Boehringer‐Ingelheim. Desideri has received research grant support from AstraZeneca and Menarini; has served as a consultant for Servier, Menarini, FIRMA, and Sigma‐Tau; and received lecturing fees from Servier, Bayer, Guidotti, Bristol Myers Squibb, DOC, and Sigma‐Tau. Temporelli has received lecturing and consulting fees from Alfasigma; consulting fees from Bayer; lecturing fees from Menarini, MSD, and Servier. D'Erasmo has received research grant support from Aegerion, Amryt, Akcea Therapeutics. The agreement signed by CliCon Srl and Alfasigma does not create any entityship, joint venture, or any similar relationship between parties. CliCon Srl is an independent company. Neither CliCon Srl nor any of their representatives are employees of Alfasigma for any purpose. The remaining authors have no disclosures to report.
Acknowledgments
Editorial assistance was provided by Carmen Innes, an independent medical writer, on behalf of Springer Healthcare Communications, with the support of Alfasigma.
(J Am Heart Assoc. 2020;9:e015801 DOI: 10.1161/JAHA.119.015801.)
For Sources of Funding and Disclosures, see page 8.
Contributor Information
Marcello Arca, Email: marcello.arca@uniroma1.it.
Local Health Units Group:
Caterina Montinari, Alessia Pisterna, Stefania Demontis, and Ilenia Senesi
References
- 1. Nordestgaard BG. Triglyceride‐rich lipoproteins and atherosclerotic cardiovascular disease: new insights from epidemiology, genetics, and biology. Circ Res. 2016;547–563. [DOI] [PubMed] [Google Scholar]
- 2. Nordestgaard BG, Varbo A. Triglycerides and cardiovascular disease. Lancet. 2014;626–635. [DOI] [PubMed] [Google Scholar]
- 3. Jørgensen AB, Frikke‐Schmidt R, West AS, Grande P, Nordestgaard BG, Tybjærg‐Hansen A. Genetically elevated non‐fasting triglycerides and calculated remnant cholesterol as causal risk factors for myocardial infarction. Eur Heart J. 2013;1826–1833. [DOI] [PubMed] [Google Scholar]
- 4. Triglyceride Coronary Disease Genetics Consortium and Emerging Risk Factors Collaboration , Sarwar N, Sandhu MS, Ricketts SL, Butterworth AS, Di Angelantonio E , Boekholdt SM, Ouwehand W, Watkins H, Samani NJ, et al. Triglyceride‐mediated pathways and coronary disease: collaborative analysis of 101 studies. Lancet. 2010;1634–1639. [DOI] [PMC free article] [PubMed] [Google Scholar]
- 5. Thomsen M, Varbo A, Tybjærg‐Hansen A, Nordestgaard BG. Low nonfasting triglycerides and reduced all‐cause mortality: a Mendelian randomization study. Clin Chem. 2014;737–746. [DOI] [PubMed] [Google Scholar]
- 6. Cannon CP, Braunwald E, McCabe CH, Rader DJ, Rouleau JL, Belder R, Pfeffer MA, Skene AM; Pravastatin or Atorvastatin Evaluation and Infection Therapy‐Thrombolysis in Myocardial Infarction 22 Investigators . Intensive versus moderate lipid lowering with statins after acute coronary syndromes. N Engl J Med. 2004;1495–1504. [DOI] [PubMed] [Google Scholar]
- 7. Pedersen TR, Faergeman O, Kastelein JJ, Olsson AG, Tikkanen MJ, Holme I, Larsen ML, Bendiksen FS, Lindahl C, Szarek M, et al. High‐dose atorvastatin vs usual‐dose simvastatin for secondary prevention after myocardial infarction: the IDEAL study: a randomized controlled trial. JAMA. 2005;2437–2445. [DOI] [PubMed] [Google Scholar]
- 8. LaRosa JC, Grundy SM, Waters DD, Shear C, Barter P, Fruchart JC, Gotto AM, Greten H, Kastelein JJ, Shepherd J, et al. Intensive lipid lowering with atorvastatin in patients with stable coronary disease. N Engl J Med. 2005;1425–1435. [DOI] [PubMed] [Google Scholar]
- 9. Catapano AL, Graham I, De Backer G, Wiklund O, Chapman MJ, Drexel H, Hoes AW, Jennings CS, Landmesser U, Pedersen TR, et al. 2016 ESC/EAS guidelines for the management of dyslipidaemias: the Task Force for the management of dyslipidaemias of the European Society of Cardiology (ESC) and European Atherosclerosis Society (EAS) developed with the special contribution of the European Association for Cardiovascular Prevention & Rehabilitation (EACPR). Atherosclerosis. 2016;281–344. [DOI] [PubMed] [Google Scholar]
- 10. Berglund L, Brunzell JD, Goldberg AC, Goldberg IJ, Sacks F, Murad MH, Stalenhoef AF; Endocrine Society . Evaluation and treatment of hypertriglyceridemia: an Endocrine Society clinical practice guideline. J Clin Endocrinol Metab. 2012;2969–2989. [DOI] [PMC free article] [PubMed] [Google Scholar]
- 11. Kaur J. A comprehensive review on metabolic syndrome. Cardiol Res Pract. 2014;943162. [DOI] [PMC free article] [PubMed] [Google Scholar] [Retracted]
- 12. Agenzia Italiana del Farmaco (AIFA) . Guideline for the classification and conduction of the observational studies on medicines. 2010. Available at: http://www.agenziafarmaco.gov.it/it/content/lineeguida-studi-osservazionali. Accessed February 20, 2020.
- 13. Miller M, Stone NJ, Ballantyne C, Bittner V, Criqui MH, Ginsberg HN, Goldberg AC, Howard WJ, Jacobson MS, Kris‐Etherton PM, et al. Triglycerides and cardiovascular disease: a scientific statement from the American Heart Association. Circulation. 2011;2292–2333. [DOI] [PubMed] [Google Scholar]
- 14. Hegele RA, Ginsberg HN, Chapman MJ, Nordestgaard BG, Kuivenhoven JA, Averna M, Borén J, Bruckert E, Catapano AL, Descamps OS, et al. The polygenic nature of hypertriglyceridaemia: implications for definition, diagnosis, and management. Lancet Diabetes Endocrinol. 2014;655–666. [DOI] [PMC free article] [PubMed] [Google Scholar]
- 15. Emerging Risk Factors Collaboration ,Di Angelantonio E, Sarwar N, Perry P, Kaptoge S, Ray KK, Thompson A, Wood AM, Lewington S, Sattar N, et al. Major lipids, apolipoproteins, and risk of vascular disease. JAMA. 2009;1993–2000. [DOI] [PMC free article] [PubMed] [Google Scholar]
- 16. Hokanson JE, Austin MA. Plasma triglyceride level is a risk factor for cardiovascular disease independent of high‐density lipoprotein cholesterol level: a meta‐analysis of population‐based prospective studies. J Cardiovasc Risk. 1996;213–219. [PubMed] [Google Scholar]
- 17. Sarwar N, Danesh J, Eiriksdottir G, Sigurdsson G, Wareham N, Bingham S, Boekholdt SM, Khaw KT, Gudnason V. Triglycerides and the risk of coronary heart disease: 10,158 incident cases among 262,525 participants in 29 Western prospective studies. Circulation. 2007;450–458. [DOI] [PubMed] [Google Scholar]
- 18. Patel A, Barzi F, Jamrozik K, Lam TH, Ueshima H, Whitlock G, Woodward M; Asia Pacific Cohort Studies Collaboration . Serum triglycerides as a risk factor for cardiovascular diseases in the Asia‐Pacific region. Circulation. 2004;2678–2686. [DOI] [PubMed] [Google Scholar]
- 19. Nordestgaard BG, Benn M, Schnohr P, Tybjaerg‐Hansen A. Nonfasting triglycerides and risk of myocardial infarction, ischemic heart disease, and death in men and women. JAMA. 2007;299–308. [DOI] [PubMed] [Google Scholar]
- 20. Freiberg JJ, Tybjaerg‐Hansen A, Jensen JS, Nordestgaard BG. Nonfasting triglycerides and risk of ischemic stroke in the general population. JAMA. 2008;2142–2152. [DOI] [PubMed] [Google Scholar]
- 21. Bansal S, Buring JE, Rifai N, Mora S, Sacks FM, Ridker PM. Fasting compared with nonfasting triglycerides and risk of cardiovascular events in women. JAMA. 2007;309–316. [DOI] [PubMed] [Google Scholar]
- 22. Christian JB, Bourgeois N, Snipes R, Lowe KA. Prevalence of severe (500 to 2,000 mg/dl) hypertriglyceridemia in United States adults. Am J Cardiol. 2011;891–897. [DOI] [PubMed] [Google Scholar]
- 23. Carroll MD, Lacher DA, Sorlie PD, Cleeman JI, Gordon DJ, Wolz M, Grundy SM, Johnson CL. Trends in serum lipids and lipoproteins of adults, 1960–2002. JAMA. 2005;1773–1781. [DOI] [PubMed] [Google Scholar]
- 24. Zafrir B, Jubran A, Hijazi R, Shapira C. Clinical features and outcomes of severe, very severe, and extreme hypertriglyceridemia in a regional health service. J Clin Lipidol. 2018;928–936. [DOI] [PubMed] [Google Scholar]
- 25. Il Progetto Cuore . Epidemiology and prevention of cerebral and cardiovascular diseases. Available at: ttp://www.cuore.iss.it. Accessed October 10, 2018.
- 26. Volpe R, Nati G, Chiriatti A, Sabatini M, Valente F; Gruppo Progetto DATAMeg . Hypertriglyceridemia, an underestimated cardiovascular risk factor: an epidemiological study of the Rome area. High Blood Press Cardiovasc Prev. 2017;401–404. [DOI] [PubMed] [Google Scholar]
- 27. Tocci G, Ferrucci A, Bruno G, Mannarino E, Nati G, Trimarco B, Volpe M. Prevalence of metabolic syndrome in the clinical practice of general medicine in Italy. Cardiovasc Diagn Ther. 2015;271–279. [DOI] [PMC free article] [PubMed] [Google Scholar]
- 28. Bhatt DL, Steg PG, Miller M, Brinton EA, Jacobson TA, Ketchum SB, Doyle RT Jr, Juliano RA, Jiao L, Granowitz C, et al. Cardiovascular risk reduction with icosapent ethyl for hypertriglyceridemia. N Engl J Med. 2019;11–22. [DOI] [PubMed] [Google Scholar]
- 29. Smith SJ, Cooper GR, Myers GL, Sampson EJ. Biological variability in concentrations of serum lipids: sources of variation among results from published studies and composite predicted values. Clin Chem. 1993;1012–1022. [PubMed] [Google Scholar]
- 30. Driver SL, Martin SS, Gluckman TJ, Clary JM, Blumenthal RS, Stone NJ. Fasting or nonfasting lipid measurements: it depends on the question. J Am Coll Cardiol. 2016;1227–1234. [DOI] [PubMed] [Google Scholar]
- 31. Rahman F, Blumenthal RS, Jones SR, Martin SS, Gluckman TJ, Whelton SP. Fasting or non‐fasting lipids for atherosclerotic cardiovascular disease risk assessment and treatment? Curr Atheroscler Rep. 2018;14. [DOI] [PubMed] [Google Scholar]
- 32. Sherman RE, Anderson SA, Dal Pan GJ, Gray GW, Gross T, Hunter NL, LaVange L, Marinac‐Dabic D, Marks PW, Robb MA, et al. Real‐world evidence—what is it and what can it tell us? N Engl J Med. 2016;2293–2297. [DOI] [PubMed] [Google Scholar]