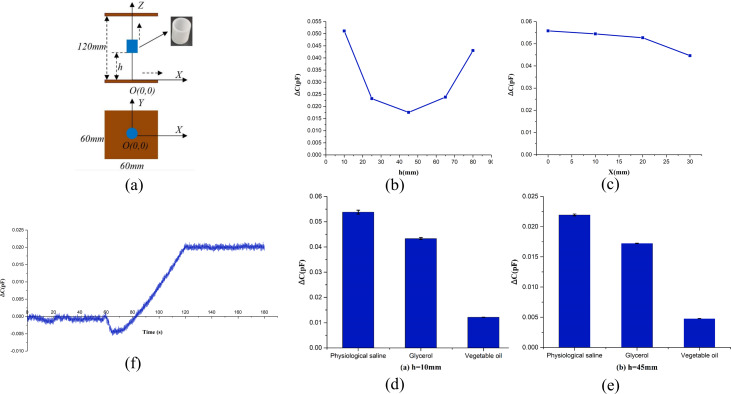
Figure 3. Schematic diagram of physical experiment and the result of physical experiment.
(A) Schematic diagram of physical experiment. (B) Capacitance difference of physiological saline and vegetable oil at different heights on Z-axis. (C) Capacitance difference of physiological saline and vegetable oil at different positions along X-axis. (D) Capacitance change caused by the same volume of three different solutions at Position 1 (h = 10 mm). (E) Capacitance change caused by the same volume of three different solutions at Position 2 (h = 45 mm). (F) Relationship between capacitance change and injection volume of saline.

