

Abstract
Background:
Despite the previous long-term decline and a recent increase in maternal mortality, detailed social inequalities in maternal mortality in the United States (US) have not been analyzed. This study examines trends and inequalities in US maternal mortality by maternal race/ethnicity, socioeconomic status, nativity/immigrant status, marital status, area deprivation, urbanization level, and cause of death.
Methods:
National vital statistics data from 1969 to 2018 were used to compute maternal mortality rates by sociodemographic factors. Mortality trends by deprivation level were analyzed by using census-based deprivation indices. Rate ratios and log-linear regression were used to model mortality trends and differentials.
Results:
Maternal mortality declined by 68% between 1969 and 1998. However, there was a recent upturn in maternal mortality, with the rate increasing from 9.9 deaths/100,000 live births in 1999 to 17.4 in 2018. The large racial disparity persisted over time; Black women in 2018 had a 2.4 times higher risk of maternal mortality than White women. During 2013-2017, the rate varied from 7.0 for Chinese women to 42.0 for non-Hispanic Black women. Unmarried status, US-born status, lower education, and rural residence were associated with 50-114% higher maternal mortality risks. Mothers in the most-deprived areas had a 120% higher risk of mortality than those in the most-affluent areas; both absolute and relative disparities in mortality by deprivation level widened between 2002 and 2018. Hemorrhage, pregnancy-related hypertension, embolism, infection, and chronic conditions were the leading causes of maternal death, with 31% of the deaths attributable to indirect obstetric causes.
Conclusions and Global Health Implications:
Despite the steep long-term decline in US maternal mortality, substantial racial/ethnic, socioeconomic, and rural-urban disparities remain. Monitoring disparities according to underlying social determinants is key to reducing maternal mortality as they give rise to inequalities in social conditions and health-risk factors that lead to maternal morbidity and mortality.
Keywords: Maternal mortality, Socioeconomic status, Deprivation, Race/ethnicity, Rural-urban, Disparities, Cause of death, Trend
1. Introduction
Maternal mortality in the United States (US) has declined dramatically over the past century.1-5 The rate declined from 607.9 maternal deaths per 100,000 live births in 1915 to 21.5 in 2014.1-3,6 However, comparison of the recent rates with those prevailing in the late 1960s shows little change in maternal mortality in the US over the past 50 years.1-4,6 In fact, recent data show an upward trend and a marked increase in maternal mortality over the past 20 years.3-6 Reversing current trends and achieving reductions in the maternal mortality rate are an important public health priority for the nation as the rates for certain racial/ethnic minority and socioeconomic groups remain relatively high.3-5 American Indian/Alaska Native (AIAN) and Black women have about 2-3 times higher maternal mortality rates than non-Hispanic White women.3,4 Women who live in high-poverty areas of the US have more than double the maternal mortality rate of those living in more affluent areas.4 A cross-national comparison of the 2013 statistics by the World Health Organization (WHO) reveals that the US rate of 22 maternal deaths per 100,000 live births exceeded the rates for at least 52 other countries, including Canada, Australia, Japan, and all the Western and Northern European countries.7 The most recent 2018 data from the Organisation for Economic Co-operation and Development (OECD) put the US with the second highest maternal mortality rate after Mexico among the select industrialized countries.8
Although previous studies have examined racial disparities in maternal mortality over time1-5,9, little or no research exists that analyzes the full extent of racial/ethnic, nativity, socioeconomic, and rural-urban disparities over time in overall maternal mortality and by cause of death in the US. For example, it is not known whether maternal education and area-based socioeconomic patterns in maternal mortality differ by race/ethnicity or over time. Although Asian/Pacific Islanders (APIs) and Hispanics have lower maternal mortality rates than Whites, Blacks, and AIANs3,4, it is not known if there is heterogeneity in mortality risks among the subgroups such as Chinese, Asian Indians, Filipinos, Mexicans, Puerto Ricans, and Central and South Americans. Important social factors such as marital status and nativity status may be related to maternal mortality given that women who are married or foreign-born might differ from their unmarried or US-born counterparts in levels of social support, access to care, preconception health, and behavioral risk factors (e.g., pre-pregnancy obesity and smoking during and before pregnancy) that are known to be associated with pregnancy complications and maternal morbidity and mortality. Furthermore, it is not known whether and to what extent women in rural areas differ from those in urban areas in their maternal mortality risk.
To address these gaps in research, I analyze long-term trends in maternal mortality according to maternal race/ethnicity, area deprivation, maternal education, nativity/immigrant status, marital status, and rural-urban residence by using temporal national vital statistics data.1-4,6 Analyzing such patterns over time is important in that it allows one to quantify maternal mortality disparities between various social groups and geographic areas. Additionally, such analyses can provide important insights into the effectiveness of social and public health policies and interventions in reducing maternal mortality and inform future policy actions that could bring about further improvements in maternal health.
2. Methods
Data for the present study came from the 1969-2018 National Vital Statistics System, the national mortality database.1-3,6,10,11 Maternal deaths in this study, in accordance with the WHO, are defined as those related to or aggravated by pregnancy or pregnancy management and which occur during or within 42 days after the end of pregnancy.1,3,4,6 This official definition of maternal mortality differs from the definition of pregnancy-related mortality, which includes deaths during or within 1 year of pregnancy.1,5,9
While the overall US maternal mortality rates and rates for Whites and Blacks were computed annually between 1969 and 2018, maternal deaths and rates for detailed racial/ethnic groups (including API and Hispanic subgroups), maternal education, marital status, nativity/immigrant status, and maternal age were computed using the pooled 5-year mortality and natality data for the period 2013-2017 in order to produce statistically robust estimates and because of the small numbers of maternal deaths annually. The numbers of births by these sociodemographic characteristics, obtained from the national natality files, served as the denominators for computing maternal mortality rates.11,12 Maternal deaths and rates by urbanization level were computed for the 2013-2017 period by using the 6-category 2013 county-based urban-rural scheme or urban influence codes developed by the National Center for Health Statistics (NCHS).11,13 These 6 categories include: (1) large central metro (inner-city counties of MSAs (metropolitan statistical areas) of ≥1 million population), (2) large fringe metro (suburban counties of MSAs of ≥1 million population), (3) medium metro (counties of MSAs of 250,000-999,999 population), (4) small metro (counties of MSAs with <250,000 population), (5) micropolitan (large rural) counties in micropolitan statistical areas (population 10,000 to 49,999), and (6) non-core (small rural) non-metro counties that are not in a micropolitan statistical area. Categories 1 through 4 comprise the metropolitan (urban) county-group, whereas categories 5 and 6 make up the nonmetropolitan (rural) county-group.
Area-based socioeconomic patterns in maternal mortality were derived by linking the 1990, 2000, and 2008-2012 census-based county-level deprivation indices to the race- and county-specific mortality statistics from 1969 through 2018.14-20 I used previously developed factor-based deprivation indices from the 1990 and 2000 decennial US censuses and the 2008-2012 American Community Survey.14-20 These deprivation indices consisted of 20-22 census-based socioeconomic indicators, which may be viewed as broadly representing educational opportunities, labor force skills, economic, and housing conditions in a given county.17-20 Selected indicators of education, occupation, wealth, income distribution, unemployment rate, poverty rate, and housing quality were used to construct these indices by factor and principal components analyses.17-20 The factor loadings (correlations of indicators with the index) for the 2008-2012 county index varied from 0.91 for 150% of the poverty rate to 0.23 for home ownership rate. Most common indicators in the 1990, 2000, and 2008-2012 deprivation indices generally had similar factor loadings or relative weights.17-20 The correlations among the 1990, 2000, 2008-2012 deprivation indices were >0.95, indicating a fairly stable geographical distribution of deprivation in the US over time. Substantive and methodological details of the US deprivation indices are provided elsewhere.17-20
To compute maternal mortality rates by deprivation level, I used the weighted population quintile distribution of the deprivation index that classified all 3,141 US counties into 5 groups of approximately equal population size.17-20 The groups thus created ranged from being the most-deprived (first quintile) to the least-disadvantaged (fifth quintile) population groups.17-20 To simplify analysis and for statistical robustness, we combined 2nd, 3rd, and 4th quintiles as the middle deprivation category. Each of the 3,141 counties in the mortality database was assigned one of these 3 deprivation quintiles. The 1990 index was used to compute deprivation-specific mortality rates from 1969 to 1998, the 2000 index was used to compute mortality rates by deprivation level from 1999 to 2007, and the 2008-2012 index was used to compute mortality rates by deprivation level from 2008-2018. Details of the linkage methodology are provided elsewhere.17-19
Maternal mortality rates according to county deprivation levels were computed for 3-year time periods between 1969 and 2013, and one 5-year period: 2014-2018. These time periods were selected because of data availability. The trend analysis included all maternal deaths that occurred between 1969 and 2018.
Log-linear regression models were used to estimate annual rates of change in maternal mortality for race and deprivation groups.18-20 Specifically, the logarithm of mortality rates were modeled as a linear function of time (calendar year), which yielded annual exponential rates of change in mortality rates.18-20 Disparities in mortality by social factors and deprivation level were described by rate ratios (relative risks) and rate differences (absolute inequalities), which were tested for statistical significance at the 0.05 level.
3. Results
3.1. Racial Trends in Maternal Mortality
The maternal mortality rates in the US showed a consistently downward trend between 1969 and 1982, decreasing at a rapid rate of 8.0% per year (Figure 1). During 1969-1982, the annual rate of decline in maternal mortality was 7.8% (95% CI=7.4%-8.6%) for White women and 8.6% (95% CI=7.9%-9.3%) for Black women. The trend in maternal mortality from 1982 through 1998 was fairly stable, with the rates not changing significantly between 1983 and 1998. Maternal mortality rates increased between 1999 and 2017, with the annual rate of increase between 1999 and 2017 being 5.4% (95% CI=4.6%-6.2%) for the overall population, 6.4% (95% CI=5.5%-7.3%) for White women, and 3.8% (95% CI=2.9%-4.8%) for Black women. The maternal mortality rate between 2017 and 2018 declined by 19.6% for the overall population, 21.9% for White women, and 19.0% for Black women.
Figure 1.
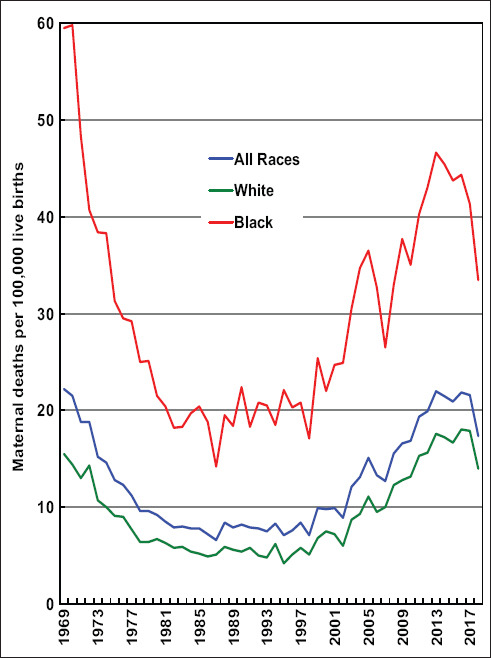
Trends in Maternal Mortality by Race, United States, 1969-2018. Source: Data derived from the National Vital Statistics System.
The risk of maternal mortality remained 2.3 to 5.3 times higher among Black women than White women during the past 5 decades (Figure 1). In 2018, the maternal mortality rate for Black women was 33.5 deaths per 100,000 live births, 2.4 times higher than the rate of 14.0 for White women.
3.2. Inequalities in Maternal Mortality by Sociodemographic Factors
According to the detailed 2013-2017 racial/ethnic data, the maternal mortality rate per 100,000 live births was highest among non-Hispanic Black women (48.2), followed by AIANs (31.3), Filipinos (19.3), non-Hispanic Whites (19.1), Koreans (16.5), Puerto Ricans (16.3), Mexicans (13.8), Vietnamese (13.3), Asian Indians (7.3), and Chinese (7.0) (Table 1). Compared to non-Hispanic White women, the maternal mortality rate was 153% higher for Black women, 64% higher for AIAN women, and 27-63% lower for Mexicans, Central and South Americans, Cubans, Asian Indians, and Chinese.
Table 1.
Maternal mortality rates per 100,000 live births by race/ethnicity, United States, 2013-2017
| Race/ethnicity | Maternal deaths | Number of live births | Maternal mortality rate | Rate ratio | 95% CI |
|---|---|---|---|---|---|
| All races | 4,246 | 19,700,129 | 21.55 | ||
| Non-Hispanic White | 2,007 | 10,533,324 | 19.05 | 1.00 | Reference |
| Non-Hispanic Black | 1,414 | 2,932,915 | 48.21 | 2.53 | 2.36–2.70 |
| Hispanic | 600 | 4,556,357 | 13.17 | 0.69 | 0.63–0.75 |
| Mexican | 371 | 2,685,467 | 13.82 | 0.73 | 0.65–0.81 |
| Puerto Rican | 57 | 350,498 | 16.26 | 0.85 | 0.63–1.08 |
| Cuban | 11 | 106,059 | 10.37 | 0.54 | 0.22–0.87 |
| Central and South American | 82 | 699,807 | 11.72 | 0.62 | 0.48–0.75 |
| American Indian/Alaska Native | 69 | 220,689 | 31.27 | 1.64 | 1.25–2.04 |
| Asian and Pacific Islander | 159 | 1,429,567 | 11.12 | 0.58 | 0.49–0.68 |
| Chinese | 21 | 298,720 | 7.03 | 0.37 | 0.21–0.53 |
| Filipino | 32 | 166,221 | 19.25 | 1.01 | 0.66–1.36 |
| Asian indian | 26 | 355,934 | 7.30 | 0.38 | 0.23–0.58 |
| Korean | 13 | 78,846 | 16.49 | 0.87 | 0.39–1.34 |
| Vietnamese | 14 | 105,204 | 13.31 | 0.70 | 0.33–1.07 |
Source: Derived from the National Mortality and Natality Detail Files, 2013-2017.
Maternal mortality rates increased consistently with increasing maternal age (Table 2). Compared to those aged <20, women aged 35-39 and ≥40 years had 2.2 and 17.7 times higher mortality risks, respectively. The impact of maternal age was particularly marked for non-Hispanic Black women. Non-Hispanic Black women aged 35-39 and ≥40 years had 4.1 and 29.3 times higher maternal mortality risks, respectively, than Non-Hispanic Black women aged <20. Within each age group, non-Hispanic Black women had higher maternal mortality rates than non-Hispanic White women, with relative risks being 3.1 and 2.5 times higher for Black women in age groups 35-39 and ≥40 years, respectively.
Table 2.
Maternal mortality rates per 100,000 live births by maternal age, education, marital status, and nativity/immigrant status, United States, 2013-2017
| Demographic variable | All Races | NH White | NH Black | ||||||
|---|---|---|---|---|---|---|---|---|---|
| Maternal deaths | Number of live births | Maternal mortality rate | Maternal deaths | Number of live births | Maternal mortality rate | Maternal deaths | Number of live births | Maternal mortality rate | |
| Maternal age1 | |||||||||
| <20 | 148 | 1,168,621 | 12.66 | 62 | 456,900 | 13.57 | 47 | 260,307 | 18.06 |
| 20-24 | 464 | 4,198,579 | 11.05 | 189 | 1,978,431 | 9.55 | 194 | 864,004 | 22.45 |
| 25-29 | 747 | 5,691,179 | 13.13 | 340 | 3,158,790 | 10.76 | 276 | 826,627 | 33.39 |
| 30-34 | 801 | 5,415,637 | 14.79 | 371 | 3,198,425 | 11.60 | 254 | 599,400 | 42.38 |
| 35-39 | 731 | 2,622,901 | 27.87 | 342 | 1,441,324 | 23.73 | 225 | 303,462 | 74.14 |
| 40+ | 1,353 | 603,212 | 224.30 | 702 | 299,454 | 234.43 | 418 | 79,115 | 528.34 |
| All ages | 4,246 | 19,700,129 | 21.55 | 2,007 | 10,533,324 | 19.05 | 1,414 | 2,932,915 | 48.21 |
| Maternal education2 | |||||||||
| <12 years | 596 | 2,183,696 | 27.29 | 233 | 604,099 | 38.57 | 180 | 322,009 | 55.90 |
| 12 years | 1,393 | 4,310,035 | 32.32 | 634 | 1,993,110 | 31.81 | 500 | 857,512 | 58.31 |
| 13-15 years | 939 | 4,369,295 | 21.49 | 438 | 3,079,823 | 14.22 | 364 | 948,012 | 38.40 |
| 16+ years | 614 | 4,802,830 | 12.78 | 328 | 4,101,778 | 8.00 | 156 | 461,563 | 33.80 |
| RR (low/high education) | 2.13 (1.89–2.38) | 4.82 (4.01–5.63) | 1.65 (1.30–2.01) | ||||||
| Marital status3 | |||||||||
| Married | 1,644 | 11,496,272 | 14.30 | 896 | 7,368,124 | 12.16 | 348 | 858,295 | 40.55 |
| Unmarried | 2,061 | 7,716,306 | 26.71 | 802 | 3,027,397 | 26.49 | 907 | 2,043,382 | 44.39 |
| RR (unmarried/married) | 1.87 (1.75–1.99) | 2.18 (1.97–2.39) | 1.09 (0.96–1.23) | ||||||
| Nativity/immigrant status3 | |||||||||
| US-born | 3,168 | 15,240,735 | 20.79 | 1,628 | 9,930,504 | 16.39 | 1,161 | 2,499,661 | 46.45 |
| Foreign-born | 561 | 4,443,057 | 12.63 | 78 | 708,301 | 11.01 | 107 | 452,563 | 23.64 |
| RR (foreign-born/US-born) | 0.62 (0.55–0.66) | 0.67 (0.52–0.82) | 0.51 (0.41–0.61) | ||||||
| Maternal age1 | |||||||||
| <20 | 32 | 408,367 | 7.84 | ||||||
| 20-24 | 13 | 91,256 | 14.25 | 11 | 157,532 | 6.98 | 66 | 1,160,512 | 5.69 |
| 25-29 | 13 | 63,911 | 20.34 | 20 | 375,507 | 5.33 | 96 | 1,262,475 | 7.60 |
| 30-34 | 11 | 42,289 | 26.01 | 50 | 531,110 | 9.41 | 115 | 1,028,383 | 11.18 |
| 35-39 | 12 | 18,989 | 63.19 | 37 | 292,570 | 12.65 | 117 | 554,553 | 21.10 |
| 40+ | 20 | 4,244 | 471.25 | 41 | 72,848 | 56.28 | 173 | 142,067 | 121.77 |
| All ages | 69 | 220,689 | 31.27 | 159 | 1,429,567 | 11.12 | 600 | 4,556,357 | 13.17 |
| Maternal education2 | |||||||||
| <12 years | 12 | 36,326 | 33.03 | 11 | 112,527 | 9.78 | 161 | 1,134,894 | 14.19 |
| 12 years | 26 | 65,409 | 39.75 | 45 | 187,271 | 24.03 | 191 | 1,233,191 | 15.49 |
| 13-15 years | 20 | 85,657 | 23.35 | 17 | 257,232 | 6.61 | 101 | 1,068,122 | 9.46 |
| 16+ years | 78 | 762,765 | 10.23 | 51 | 534,346 | 9.54 | |||
| RR (low/high education) | 1.41 (0.40–2.43) | 0.96 (0.35–1.56) | 1.49 (1.02–1.96) | ||||||
| Marital status3 | |||||||||
| Married | 18 | 73,774 | 24.40 | 121 | 1,119,259 | 10.81 | 266 | 2,045,025 | 13.01 |
| Unmarried | 45 | 143,351 | 31.39 | 34 | 227,015 | 14.98 | 273 | 2,286,040 | 11.94 |
| RR (unmarried/married) | 1.29 (0.58–1.99) | 1.39 (0.86–1.91) | 0.92 (0.76–1.07) | ||||||
| Nativity/immigrant status3 | |||||||||
| US-born | 34 | 334,337 | 10.17 | 287 | 2,328,713 | 12.32 | |||
| Foreign-born | 121 | 1,094,387 | 11.06 | 254 | 2,222,324 | 11.43 | |||
| RR (foreign-born/US-born) | 1.09 (0.67–1.50) | 0.93 (0.77–1.08) | |||||||
Source: Derived from the National Mortality and Natality Detail Files, 2013-2017. NH = Non-Hispanic; AIAN = American Indian/Alaska Native; API = Asian and Pacific Islander; RR = relative risk or rate ratio. SE (Mortality Rate) ≈ Rate/SQRT(Deaths). The foreign-born or immigrants are defined as those born outside the 50 states and DC in both natality and mortality files.
For AIANs and APIs, maternal deaths, live births and mortality rates refer to those for maternal age < 25 years.
Data were derived for mothers aged 20-49 years. For AIANs, maternal deaths, live births and mortality rates refer to those with education ≥ 13 years.
Data were derived for mothers aged 15-49 years.
Higher educational attainment was associated with lower maternal mortality rates. Educational gradients were most consistent and marked for non-Hispanic White women (Table 2). Non-Hispanic White women with <12 years of education had 4.8 times higher mortality (RR=4.82; 95% CI=4.01-5.63) than their counterparts with a college degree. For the overall US population, women with <12 and 12 years of education had 2.1 (RR=2.13; 95% CI=1.89-2.38) and 2.5 times (RR=2.53; 95% CI=2.29-2.77) higher maternal mortality risks respectively than those with a college degree. Educational differences in mortality rates for Blacks and Hispanics were less pronounced but statistically significant. Within each educational category, non-Hispanic Black women had significantly higher maternal mortality rates than their non-Hispanic White counterparts, with the racial disparity in maternal mortality being most pronounced (4-fold) among those with a college degree.
Marital status was associated with maternal mortality, with unmarried women having 1.9 times (RR=1.87; 95% CI=1.75-1.99) higher mortality rates than married women. Unmarried non-Hispanic White women had 2.2 times (RR=2.18; 95% CI=1.97-2.39) the mortality rate of their married counterparts (Table 2). Overall, immigrant women had 38% (RR=0.62; 95% CI=0.55-0.66) lower mortality rates than US-born women. Immigrant Black women and immigrant White women had 33% (RR=0.67; 95% CI=0.52-0.82) and 49% (RR=0.51; 95% CI=0.41-0.61) lower mortality rates than their US-born counterparts, respectively.
3.3. Differentials in Maternal Mortality by Urbanization Level
During 2013-2017, women in rural (non-metro) areas had 50% higher maternal mortality (RR=1.50; 95% CI=1.38-1.61) than those in urban (metro) areas, with AIAN and non-Hispanic White women in rural areas experiencing markedly higher risks of mortality than their urban counterparts (Figure 2). For the general population and non-Hispanic Whites, maternal mortality rates were directly related to levels of rurality; the more rural the geographic area – the greater the risk of maternal mortality. Overall, the maternal mortality rate was highest among women in small rural towns, 80% higher (RR=1.80; 95% CI=1.59-2.01) than that for women in inner cities. Non-Hispanic White women in small rural towns had 145% higher (RR=2.45; 95% CI=2.04-2.85) maternal mortality than their counterparts in inner cities. Among non-Hispanic Black women, maternal mortality rates were significantly higher in small urban towns and rural areas compared to inner cities and large- and mid-size metro areas. AIAN women in rural (non-metro) areas had 5.6 times higher mortality (RR=5.59; 95% CI=2.76-8.42) than their counterparts in urban (metro) areas.
Figure 2.
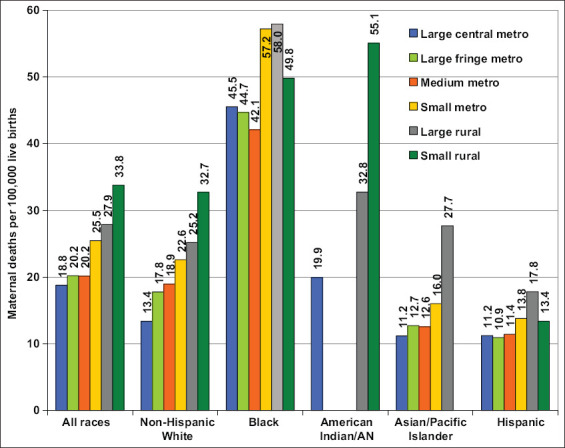
Maternal Mortality Rates by Levels of Urbanization, United States, 2013-2017. Source: Data derived from the National Vital Statistics System. Metropolitan (urban) counties include: (1) large central metro (inner-city counties of MSAs (metropolitan statistical areas) of ≥1 million population), (2) large fringe metro (suburban counties of MSAs of ≥1 million population), (3) medium metro (counties of MSAs of 250,000-999,999 population), (4) small metro (counties of MSAs with <250,000 population). Nonmetropolitan (rural) counties include: (5) micropolitan (large rural) counties in micropolitan statistical areas (population 10,000 to 49,999), (6) non-core (small rural) nonmetro counties that are not in a micropolitan statistical area. For American Indians and Alaska Natives, the mortality rates are shown for all metro areas combined, large rural areas, and small rural areas.
3.4. Racial Disparities in Maternal Mortality by Cause of Death
During 2013-2017, the leading causes of maternal deaths in the US were hemorrhage, pregnancy-induced hypertension, embolism, infection, and other chronic medical conditions (Table 3). In pregnancies with abortive outcomes, ectopic pregnancy was the leading cause of maternal death. Indirect obstetric causes such as cardiovascular diseases and preexisting medical conditions accounted for 31% of maternal deaths during this period. About 33% of Hispanic and API maternal deaths, 27% of non-Hispanic White maternal deaths, and 24% of non-Hispanic Black maternal deaths were due to indirect causes. Compared to non-Hispanic Whites (12.2), AIAN (21.8) and non-Hispanic Black women (35.7) had, respectively, 1.8 and 2.9 times higher rates of maternal mortality due to direct obstetric causes.
Table 3.
Number of maternal deaths and maternal mortality rates per 100,000 live births for selected causes by race/ethnicity, United States, 2013-2017
| Cause of death (ICD-10 codes) | All races | Non-Hispanic White | Non-Hispanic Black | |||
|---|---|---|---|---|---|---|
| Deaths | Mortality Rate | Deaths | Mortality Rate | Deaths | Mortality Rate | |
| All maternal causes (A34,O00-O95,O98-O99) | 4,246 | 21.55 | 2,007 | 19.05 | 1,414 | 48.21 |
| Pregnancy with abortive outcomes (O00-O07) | 115 | 0.58 | 41 | 0.39 | 48 | 1.64 |
| Ectopic pregnancy (O00) | 64 | 0.32 | 26 | 0.25 | 26 | 0.89 |
| Spontaneous abortion (O03) | 20 | 0.10 | 9 | 0.09 | ||
| Other direct obstetric causes (A34,O10-O92) | 2,747 | 13.94 | 1,211 | 11.50 | 976 | 33.28 |
| Eclampsia and pre-eclampsia (O11,O13-O16) | 250 | 1.27 | 90 | 0.85 | 117 | 3.99 |
| Hemorrhage of pregnancy and childbirth and placenta previa (O20,O44-O46,O67,O72) | 141 | 0.72 | 56 | 0.53 | 37 | 1.26 |
| Complications predominantly related to | 498 | 2.53 | 215 | 2.04 | 200 | 6.82 |
| puerperium (A34,O85-O92) | ||||||
| Obstetric embolism (O88) | 229 | 1.16 | 106 | 1.01 | 76 | 2.59 |
| Obstetric deaths of unspecified cause (O95) | 79 | 0.40 | 36 | 0.34 | 23 | 0.78 |
| Indirect obstetric causes (O98-O99) | 1,305 | 6.62 | 719 | 6.83 | 367 | 12.51 |
| Late maternal deaths (O96-O97) | 1,594 | 8.09 | 746 | 7.08 | 458 | 15.62 |
| Cause of deatd (ICD-10 codes) | AIAN | API | Hispanic | |||
| Deatds | Mortality Rate | Deatds | Mortality Rate | Deatds | Mortality Rate | |
| All maternal causes (A34,O00-O95,O98-O99) | 69 | 31.27 | 159 | 11.12 | 600 | 13.17 |
| Pregnancy with abortive outcomes (O00-O07) | 17 | 0.37 | ||||
| Ectopic pregnancy (O00) | ||||||
| Spontaneous abortion (O03) | ||||||
| Other direct obstetric causes (A34,O10-O92) | 43 | 19.48 | 108 | 7.55 | 413 | 9.06 |
| Eclampsia and pre-eclampsia (O11,O13-O16) | 32 | 0.70 | ||||
| Hemorrhage of pregnancy and childbirth and placenta previa (O20,O44-O46,O67,O72) | 12 | 0.84 | 32 | 0.70 | ||
| Complications predominantly related to | 23 | 1.61 | 57 | 1.25 | ||
| puerperium (A34,O85-O92) | ||||||
| Obstetric embolism (O88) | 16 | 1.12 | 30 | 0.66 | ||
| Obstetric deaths of unspecified cause (O95) | 16 | 0.35 | ||||
| Indirect obstetric causes (O98-O99) | 21 | 9.52 | 44 | 3.08 | 154 | 3.38 |
| Late maternal deaths (O96-O97) | 17 | 7.70 | 79 | 5.53 | 291 | 6.39 |
Source: Derived from the National Mortality and Natality Detail Files, 2013-2017. AIAN = American Indian/Alaska Native; API = Asian and Pacific Islander. Empty cells indicate insufficient data or deaths <10. Rates based on <10 deaths are not shown because of large standard errors and confidentiality concerns.
During 2013-2017, in addition to the 4,246 maternal deaths that occurred within 42 days of delivery, 1,594 deaths were classified as late maternal deaths from direct or indirect causes occurring more than 42 days but less than a year after termination of pregnancy. If late maternal deaths were taken into account, the maternal mortality rate for the US would be 29.6 per 100,000 during 2013-2017 and 31.3 in 2017.
3.5. Trends in Maternal Mortality by Area Deprivation
During 1969-1992, the maternal mortality rate for women in the most-affluent area group declined by 63.8%, whereas the rate for women in the middle- and most-deprived area groups decreased by 57.6% and 59.7%, respectively (Figure 3). The maternal mortality rate increased significantly between 1993 and 2018 for women in all area socioeconomic groups, with rates increasing by 139.2%, 175.9%, and 137.3% for the most- to the least-deprived groups respectively. The faster decline or slower increases in maternal mortality among more deprived area groups contributed to the narrowing of the socioeconomic differentials in maternal mortality. Compared to women in the most-affluent area group, women in the middle- and most-deprived area groups had 66% (RR=1.66; 95% CI=1.42-1.91) and 182% (RR=2.82; 95% CI=2.38-3.25) higher maternal mortality risks in 1969-1971 and 51% (RR=1.51; 95% CI=1.37-1.66) and 120% (RR=2.20; 95% CI=1.97-2.43) higher maternal mortality risks in 2014-2018, respectively (Figure 3). However, between 2002 and 2018, both absolute and relative disparities in maternal mortality by deprivation level widened. Higher deprivation levels were generally associated with higher maternal mortality risks among both White and Black women in each time period (Figure 4). For example, in 2014-2018, Black women in the most-deprived area group had a 70% higher maternal mortality risk (RR=1.70; 95% CI=1.36-2.04) than Black women in the most-affluent area group. For White women, the corresponding relative risk of mortality was 104% higher in the most-deprived group (RR=2.04; 95% CI=1.78-2.31) compared to the most-affluent group. Moreover, within each deprivation group, significant racial disparities in maternal mortality existed, with Black women experiencing 2-5 times higher maternal mortality risk than White women in each area group and time period (data not shown).
Figure 3.

Maternal Mortality Rates and Risks by Area Deprivation, United States, 1969-2018. Source: Data derived from the National Vital Statistics System linked to county-based area deprivation indices.
Figure 4.
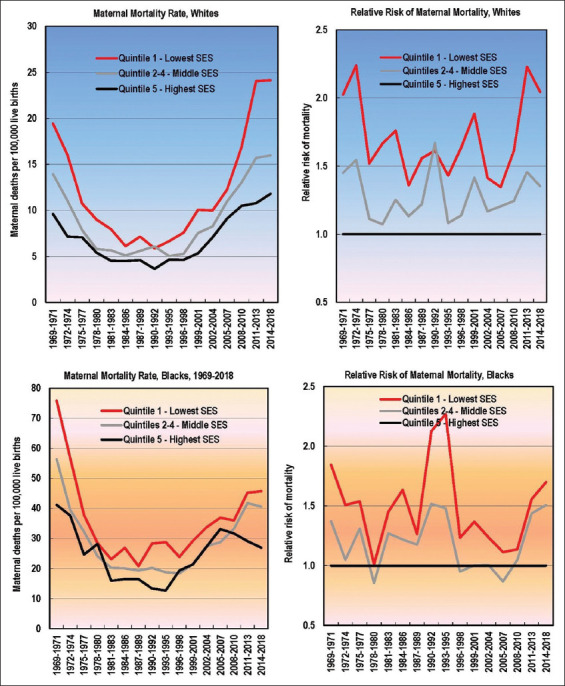
Maternal Mortality among White and Black Women by Area Deprivation Index, 1969-2018
4. Discussion
Reducing the overall maternal mortality rate as well as the associated racial/ethnic and socioeconomic disparity remains an important health objective for the nation.21 The analysis of a 50-year trend in racial and socioeconomic disparities and documenting a broader range of racial/ethnic, nativity, socioeconomic, and geographic disparities in maternal mortality are a particularly novel contribution of this study. Social inequalities, such as a 7-fold differential in maternal mortality between Black and Chinese women or between Black high school graduates and White college graduates, show the extent to which interventions can be targeted to achieve further reductions in mortality in the United States.
The overall trend from 1969 to 2018 indicates little change in US maternal mortality rates. However, a closer examination of the data reveals two countervailing trends: first, a steep downward trend in mortality from 1969 to 1982; and second, a marked upward trend in mortality from 1999 to 2017. Medical advances (including the use of antibiotics, oxytocin to induce labor, and safe blood transfusion and better management of hypertensive conditions during pregnancy), improved nutrition and access to healthcare, and reductions in maternal deaths due to abortion, hemorrhage, pregnancy-induced hypertension, and maternal sepsis/infections have been cited as factors responsible for the steep decline in maternal mortality prior to 1982.22
The upturn in maternal mortality since 1999 has partly been attributed to changes in the coding and classification of maternal deaths resulting from the implementation in 1999 of the International Classification of Diseases, 10th Revision (ICD-10) in the US.1,3,4,6,9,23 With the implementation of ICD-10 effective with mortality statistics in 1999 and thereafter, additional deaths due to indirect maternal causes of death have begun to be included in the official mortality statistics, which would not have otherwise been classified as maternal deaths in the previous ICD revisions.1,3,4,6 In addition, a number of states have, in recent years, started using a pregnancy checkbox item on death certificates, which has led to an increase in the identification of maternal deaths.1,3,4,6,24,25 As of 2013, 40 states and the District of Columbia (DC) had a separate item on the death certificate indicating pregnancy status of the decedent (6). In 2017, all 50 states and DC had included this item on the death certificate.10 The decline in maternal mortality between 2017 and 2018 has been attributed to the changes in the coding method that reduces misclassification (over-reporting) of maternal deaths associated with the pregnancy status checkbox, especially among older women.25
It is important to note that the maternal mortality statistics analyzed in this study are those compiled by NCHS in accordance with the WHO regulations and, therefore, exclude late maternal deaths occurring more than 42 days after the end of the pregnancy and deaths of pregnant women from external causes such as unintentional injuries, homicides, and suicides.1,3,4,6 Sociodemographic patterns in pregnancy-related mortality during or within 1 year of pregnancy appear to be similar to those reported here for maternal mortality during or within 42 days after the end of pregnancy.5,8,23
While maternal mortality from direct causes such as hemorrhage, pregnancy-related hypertension, and embolism has declined during the past two decades, maternal deaths due to other medical conditions, including cardiovascular and neurological problems have increased.4,5,8,23 Rising rates of obesity and chronic conditions in recent decades have contributed to the increase in maternal mortality overall and from indirect causes.8,10,23,26,27 The rising trend in cesarean rates may have also contributed to the increase in maternal mortality during the past two decades.4 The cesarean delivery rate in the US has risen by more than 50% in recent years, from 20.7% in 1996 to 32.0% in 2017.12 Complications of cesarean births have been associated with increased maternal mortality, and a recent study indicates 8 to 10 times higher maternal mortality risks for cesarean delivery compared with vaginal birth.28 An ecological regression analysis of the 2003-2007 data showed increased maternal mortality risks in states with higher cesarean rates, after adjusting for socioeconomic factors.4
4.1. Limitations
This study has some limitations. Underreporting of mortality statistics for Hispanic and API subgroups and for AIANs on the death certificate may lead to an underestimation of maternal mortality rates for these racial/ethnic groups.3,6 Inconsistencies in the reporting of race/ethnicity, educational attainment, marital status, nativity status, and maternal age in numerator (deaths) and denominator (births) databases may lead to incorrect estimation of maternal mortality rates.3,6,12 Thirdly, the differential adoption of a pregnancy checkbox item on the death certificate by many states may have been a factor influencing the recent trend (or apparent increase or misclassification) in maternal deaths and mortality.1,4,6,8,23,24,29,30
The National Maternal Health Initiative (NMHI) launched by the Maternal and Child Health Bureau at the US Health Resources and Services Administration calls for a further reduction in maternal mortality and severe morbidity cases between 2015 and 2020.31 The goal of the NMHI is to reduce maternal mortality and morbidity by improving women’s health across the life course, especially by tackling the rising prevalence of chronic medical conditions (such as obesity, diabetes, chronic and gestational hypertension, kidney diseases, and cardiovascular conditions) among women of reproductive age, and by assuring the quality and safety of maternity care.31 The Healthy People 2020 also calls for a significant reduction in both levels and disparities in the maternal mortality rate.21
5. Conclusions and Global Health Implications
As maternal mortality rates have risen in the US during the past two decades, Black women, women in lower socioeconomic groups, and women in rural communities continue to experience unacceptably high risks of maternal mortality. These marked social disparities pose an important challenge for the US health care system, as they may indicate important inequities in access to high-quality obstetric care or gaps in primary care postpartum.4 Currently, the maternal mortality rates for the overall population and for most racial/ethnic, socioeconomic, and rural-urban groups are short of the Healthy People 2020 goal – which is set at 11.4 deaths per 100,000 live births.21 Reaching the national target would require a 34% reduction in the maternal mortality rate between 2018 and end of 2020. Especially daunting are the challenges associated with reducing the maternal mortality rates of AIAN and Black women, socially-disadvantaged women, and women in rural areas in order to bring them closer to the national target. Providing high-quality clinical care is important in addressing the more proximal causes of maternal mortality such as eclampsia, hemorrhage, embolism, and infection.32,33 However, monitoring and addressing disparities according to underlying social determinants of health such as race/ethnicity, socioeconomic status, rural-urban residence, and area disadvantage is key to reducing maternal mortality as they give rise to inequalities in social conditions and health-risk factors that lead to maternal morbidity and mortality.33,34
Key Messages.
► Maternal mortality in the US declined by 68% between 1969 and 1998; however, the maternal mortality rate nearly doubled between 1999 and 2018.
► There is a 7-fold racial/ethnic variation in maternal mortality, with the rate varying from a low of 7.0 for Chinese women and 7.3 for Asian Indian women to a high of 31.3 for American Indian/ Alaska Native women and 48.2 per 100,000 live births for non-Hispanic Black women. . Non-Hispanic White women with less than a high school education have 4.8 times higher mortality than their counterparts with a college degree.
► Women in the most-deprived areas of the US have 2.2 times higher maternal mortality than those in the most-affluent areas; both absolute and relative disparities in maternal mortality by deprivation level widened between 2002 and 2018.
► The leading causes of maternal deaths in the US are hemorrhage, pregnancy-induced hypertension, embolism, infection, and chronic medical conditions; cardiovascular diseases and preexisting medical conditions account for nearly one-third of all maternal deaths.
Compliance With Ethical Standards
Conflicts of Interest: None.
Financial Disclosure: None to report.
Funding/Support: None.
Ethical approval: No IRB approval was required for this study, which is based on the secondary analysis of public-use federal databases.
Disclaimer: The views expressed in this article are those of the author and do not necessarily reflect the official policies of the US Department of Health and Human Services or the Health Resources and Services Administration.
References
- 1.Hoyert DL. Maternal mortality and related concepts. Vital and Health Statistics. 2007;3(33):1–13. [PubMed] [Google Scholar]
- 2.Grove RD, Hetzel AM. National Center for Health Statistics. Washington, DC: US Department of Health, Education, and Welfare; 1968. Vital Statistics Rates in the United States 1940-1960. [Google Scholar]
- 3.Xu JQ, Kochanek KD, Murphy SL, Tejada-Vera B. Deaths:final data for 2007. Natl Vital Stat Rep. 2010;58(19):1–135. [PubMed] [Google Scholar]
- 4.Singh GK. Maternal and Child Health Bureau. Rockville, MD: U.S. Department of Health and Human Services; 2010. [Accessed 15 September, 2020]. Maternal Mortality in the United States 1935-2007:Substantial Racial/Ethnic Socioeconomic, and Geographic Disparities Persist. A 75th Anniversary Publication. Health Resources and Services Administration. https://www.hrsa.gov/sites/default/files/ourstories/mchb75th/mchb75maternalmortality.pdf . [Google Scholar]
- 5.Chang J, Elam-Evans LD, Berg CJ, et al. Pregnancy-related mortality surveillance -- United States, 1991-1999. MMWR Surveill Summ. 2003;52(2):1–8. [PubMed] [Google Scholar]
- 6.Kochanek KD, Murphy SL, Xu JQ, Arias E. Deaths:final data for 2017. Natl Vital Stat Rep. 2019;68(9):1–77. [PubMed] [Google Scholar]
- 7.World Health Organization. World Health Statistics 2014. Geneva, Switzerland: WHO; 2014. [Google Scholar]
- 8.Organisation for Economic Co-operation and Development. OECD.Stat:Health Status. Paris, France: OECD; 2020. [Accessed 15 September 2020]. https://stats.oecd.org/Index.aspx?DataSetCode=HEALTH_STAT . [Google Scholar]
- 9.Berg CJ, Callaghan WM, Syverson C, Henderson Z. Pregnancy-related mortality in the United States 1998 to 2005. Obstet Gynecol. 2010;116(6):1302–1309. doi: 10.1097/AOG.0b013e3181fdfb11. [DOI] [PubMed] [Google Scholar]
- 10.National Center for Health Statistics. National Vital Statistics System. Mortality Multiple Cause-of-Death Public Use Data File Documentation. Hyattsville, MD: US Department of Health and Human Services; 2020. [Accessed 15 September 2020]. http://www.cdc.gov/nchs/nvss/mortality_public_use_data.htm . [Google Scholar]
- 11.National Center for Health Statistics Health. United States 2016:With Chartbook on Long-Term Trends in Health. Hyattsville, MD: US Department of Health and Human Services; 2017. [PubMed] [Google Scholar]
- 12.Martin JA, Hamilton BE, Osterman MJK, Driscoll AK, Drake P. Births:final data for 2017. Natl Vital Stat Rep. 2018;67(8):1–50. [PubMed] [Google Scholar]
- 13.Ingram DD, Franco SJ. 2013 NCHS urban-rural classification scheme for counties. Vital Health Stat. 2014;2(166):1–73. [PubMed] [Google Scholar]
- 14.US Census Bureau. Census of Population and Housing 2000, Summary File 3. Washington, DC: US Census Bureau; 2005. [Google Scholar]
- 15.US Census Bureau. Census of Population and Housing 1990, Summary Tape File 3A. Washington, DC: US Census Bureau; 1992. [Google Scholar]
- 16.US Census Bureau. The American Community Survey. Washington, DC: US Census Bureau; 2018. http://www.census.gov/acs/www/ [Google Scholar]
- 17.Singh GK, Azuine RE, Siahpush M, Kogan MD. All-cause and cause-specific mortality among US youth:socioeconomic and rural-urban disparities and international patterns. J Urban Health. 2013;90(3):388–405. doi: 10.1007/s11524-012-9744-0. [DOI] [PMC free article] [PubMed] [Google Scholar]
- 18.Singh GK. Area deprivation and widening inequalities in US mortality, 1969-1998. Am J Public Health. 2003;93(7):1137–1143. doi: 10.2105/ajph.93.7.1137. [DOI] [PMC free article] [PubMed] [Google Scholar]
- 19.Singh GK, Siahpush M. Increasing inequalities in all-cause and cardiovascular mortality among US adults aged 25-64 years by area socioeconomic status 1969-1998. Int J Epidemiol. 2002;31(3):600–613. doi: 10.1093/ije/31.3.600. [DOI] [PubMed] [Google Scholar]
- 20.Singh GK, Jemal A. 2017. Socioeconomic and racial/ethnic disparities in cancer mortality incidence, and survival in the United States 1950-2014:over six decades of changing patterns and widening Inequalities. J Environ Public Health. doi: 10.1155/2017/2819372. DOI:2017/2819372. Epub March 2017. [DOI] [PMC free article] [PubMed] [Google Scholar]
- 21.US Department of Health and Human Services. Healthy People. 2020. [Accessed 15 September, 2020]. Available at: http://www.healthypeople.gov/2020/default.aspx .
- 22.Centers for Disease Control and Prevention. National Center for Chronic Disease Prevention and Health Promotion. Achievements in public health 1900-1999:healthier mothers and babies. MMWR. 1999;48(38):849–858. [Google Scholar]
- 23.Creanga AA, Berg CJ, Ko JY, et al. Maternal mortality and morbidity in the United States:where are we now? J Women's Health. 2007;23(1):3–9. doi: 10.1089/jwh.2013.4617. [DOI] [PMC free article] [PubMed] [Google Scholar]
- 24.Hoyert DL, Uddin SFG, Miniño, AM. Evaluation of the pregnancy status checkbox on the identification of maternal deaths. Natl Vital Stat Rep. 2020;69(1):1–25. [PubMed] [Google Scholar]
- 25.Hoyert DL, Miniño AM. Maternal mortality in the United States:changes in coding publication, and data release 2018. Natl Vital Stat Rep. 2020;69(2):1–18. [PubMed] [Google Scholar]
- 26.Singh GK, Siahpush M, Liu L, Allender M. Racial/Ethnic, Nativity, and Sociodemographic Disparities in Maternal Hypertension in the United States, 2014-2015. Int J Hypertens. 2018 May 17; doi: 10.1155/2018/7897189. DOI:10.1155/2018/7897189. [DOI] [PMC free article] [PubMed] [Google Scholar]
- 27.Singh GK, DiBari JN. Marked Disparities in Pre-Pregnancy Obesity and Overweight Prevalence among US Women by Race/Ethnicity. Nativity/Immigrant Status and Sociodemographic Characteristics, 2012-2014. J Obes. 2019 Feb; doi: 10.1155/2019/2419263. DOI:10.1155/2019/2419263. [DOI] [PMC free article] [PubMed] [Google Scholar]
- 28.Clark SL, Belfort MA, Dildy GA, et al. Maternal deaths in the 21st century:causes, prevention, and relationship to cesarean delivery. Am J Obstet Gynecol. 2008;199(1):36.e1–e5. doi: 10.1016/j.ajog.2008.03.007. [DOI] [PubMed] [Google Scholar]
- 29.MacDorman MF, Declercq E, Cabral H, Morton C. Is the United States maternal mortality rate increasing?Disentangling trends from measurement issues. Obstet Gynecol. 2016;128(3):447–455. doi: 10.1097/AOG.0000000000001556. [DOI] [PMC free article] [PubMed] [Google Scholar]
- 30.Davis NL, Hoyert DL, Goodman DA, Hirai AH, Callaghan WM. Contribution of maternal age and pregnancy checkbox on maternal mortality ratios in the United States, 1978-2012. Am J Obstet Gynecol. 2017;217(3):352.e1–352.e7. doi: 10.1016/j.ajog.2017.04.042. [DOI] [PMC free article] [PubMed] [Google Scholar]
- 31.Lu MC, Highsmith K, de la Cruz D, Atrash HK. Putting the “M”back in the Matenal and Child Health Bureau:reducing maternal mortality and morbidity. Matern Child Health J. 2015;19(7):1435–1439. doi: 10.1007/s10995-015-1665-6. [DOI] [PubMed] [Google Scholar]
- 32.Kassebaum NJ, Bertozzi-Villa A, Coggeshall MS, et al. Global, regional, and national levels and causes of maternal mortality during 1990-2013:a systematic analysis for the Global Burden of Disease Study 2013. Lancet. 2014;384(9947):980–1004. doi: 10.1016/S0140-6736(14)60696-6. [DOI] [PMC free article] [PubMed] [Google Scholar]
- 33.Say L, Chou D, Gemmill A, et al. Global causes of maternal death:a WHO systematic analysis. Lancet Glob Health. 2014;2(6):e323–e333. doi: 10.1016/S2214-109X(14)70227-X. [DOI] [PubMed] [Google Scholar]
- 34.Jolivet RR, Moran AC, O'Connor M, Chou D, Bhardwaj N, Newby H, et al. Ending preventable maternal mortality:phase II of a multi-step process to develop a monitoring framework, 2016-2030. BMC Pregnancy Childbirth. 2018;18(1):258. doi: 10.1186/s12884-018-1763-8. https://doi.org/10.1186/s12884-018-1763-8. [DOI] [PMC free article] [PubMed] [Google Scholar]