

Abstract
In the acute respiratory distress syndrome (ARDS), alveolar surface tension, T, may be elevated. Elevated T should increase ventilation-induced lung injury. Exogenous surfactant therapy, intended to lower T, has not reduced mortality. Sulforhodamine B (SRB) might, alternatively, be used to lower T. We test whether substances suspected of elevating T in ARDS raise T in the lungs and test the abilities of exogenous surfactant and SRB to reduce T. In isolated rat lungs, we micropuncture a surface alveolus and instill a solution of a purported T-raising substance: control saline, cell debris, secretory phospholipase A2 (sPLA2), acid, or mucins. We test each substance alone; with albumin, to model proteinaceous edema liquid; with albumin and exogenous surfactant; and with albumin and SRB. We determine T in situ in the lungs by combining servo-nulling pressure measurement with confocal microscopy and applying the Laplace relation. With control saline, albumin does not alter T, additional surfactant raises T, and additional SRB lowers T. The experimental substances, without or with albumin, raise T. Excepting under aspiration conditions, addition of surfactant or SRB lowers T. Exogenous surfactant activity is concentration and ventilation dependent. Sulforhodamine B, which could be delivered intravascularly, holds promise as an alternative therapeutic.
NEW & NOTEWORTHY In the acute respiratory distress syndrome (ARDS), lowering surface tension, T, should reduce ventilation injury yet exogenous surfactant has not reduced mortality. We show with direct T determination in isolated lungs that substances suggested to elevate T in ARDS indeed raise T, and exogenous surfactant reduces T. Further, we extend our previous finding that sulforhodamine B (SRB) reduces T below normal in healthy lungs and show that SRB, too, reduces T under ARDS conditions.
Keywords: acute respiratory distress syndrome, surface tension, surfactant therapy, sulforhodamine B
INTRODUCTION
The acute respiratory distress syndrome (ARDS) can occur following a systemic insult, such as sepsis or pancreatitis, or a pulmonary insult, such as pneumonia or aspiration (13, 57). Estimates of ARDS incidence range from 6 to 193 per 100,000 person-years, with the highest estimates from the United States (8, 13, 42, 55), and the novel coronavirus pandemic has no doubt increased incidence. Independent of incidence, reports of in-hospital mortality range from 39% to 56% (8, 42, 49, 55, 61).
In ARDS, alveolar edema liquid impedes gas exchange. Mechanical ventilation supports gas exchange but exacerbates lung injury, which contributes to the high ARDS mortality rate (6, 7, 58). Evidence suggests that lung injury is proportional to alveolar surface tension, T, and that T may be elevated in ARDS (1, 17, 43, 46, 58).
Various possible causes of elevated T in ARDS have been proposed. It has most commonly been suggested that plasma proteins in edema liquid raise T. However, we and others have shown that plasma proteins do not alter T in the presence of an intact surfactant layer, as exists in the lungs (23, 26, 31, 38). Other possible causes include cell debris contamination of the alveolar liquid phase (25); increased activity of phospholipases, particularly secretory phospholipase A2 (sPLA2) (19, 46); and gastric aspiration, which may lower alveolar pH or wash T-raising airway mucins to the alveoli (37).
Given the success of exogenous surfactant therapy in treating neonatal respiratory distress, in which T is elevated and residual fetal lung liquid impedes gas exchange (30), it is surprising that surfactant therapy has failed to reduce ARDS mortality (5). The failure may be due to inadequate dosage or delivery strategy (14). However, whether exogenous surfactant can lower T in the lungs in the presence of substances suspected of raising T in ARDS is not known.
Sulforhodamine B (SRB) could be an alternative T-lowering therapeutic for ARDS. Sulforhodamine B is a nontoxic dye that, in combination with albumin, lowers surface tension up to 33% below normal in healthy lungs (12, 32). Sulforhodamine B could potentially be administered intravascularly, enabling a new delivery route not feasible with exogenous surfactant. However, the efficacy of SRB in the presence of substances suspected of raising T in ARDS is also not known.
Here, under controlled conditions in isolated rat lungs, we test whether purported T-raising substances raise T in the lungs and whether exogenous surfactant and SRB can counter the effects of T-raising substances. We flood surface alveoli with solutions of potentially T-raising substances. We administer each solution alone, with albumin to model the ARDS disease state, and with albumin plus exogenous surfactant or SRB. We determine T in situ in flooded alveoli.
METHODS
Isolated lung preparation.
We handle all animals in accord with a protocol approved by the Stevens Institute of Technology Institutional Animal Care and Use Committee. As described previously (37), we anesthetize a male or female Sprague–Dawley rat (225–325 g, n = 47, Charles River, Wilmington, MA) with 3.5% isoflurane in 100% oxygen. We puncture the heart through the chest wall (21G needle) and euthanize by withdrawal of ∼10 mL blood into a syringe with 1 mL of 1,000 U/mL heparin. We cannulate the trachea (blunted 15G needle connected to a stopcock), perform a midline thoracotomy, inflate the lungs with 2 mL air, close the stopcock, and excise the heart and lungs. We place the lungs costal surface-upward on the stage of an upright confocal microscope (SP5, Leica Microsystems, Buffalo Grove, IL) and connect an air source and pressure transducer to the tracheal stopcock. Having previously demonstrated that T is the same at room temperature as at 37°C (31), we maintain the lungs at room temperature. We increase transpulmonary pressure, PL, to 30 cmH2O and then decrease PL to a constant 5 cmH2O, thus maintaining lung volume above functional residual capacity.
Base solutions for modeling ARDS.
We generate solutions of purported T-raising substances, as detailed below, for microinjection into surface alveoli. We use normal saline (NS; pH 5.0) as a control solution and as the solvent for other solutions. For visualization, we include 23 µM fluorescein (00297–17, Cole-Parmer, Vernon Hills, IL) in all solutions except Infasurf (a surfactant containing 35 mg/mL phospholipids, 0.26 mg/mL surfactant protein B, and 0.44 mg/mL surfactant protein C; ONY Biotech, Amherst, NY). When we administer Infasurf, we do so as a second injection and include 5 µM sulforhodamine G (SRG, 230561, Sigma-Aldrich, St. Louis, MO); we subsequently identify an area in which both fluorescein (first injection) and SRG (second injection) are present. Neither fluorescein nor SRG alters T (31, 37).
Cell debris.
We start by washing the red blood cells (RBCs) of the withdrawn blood. We centrifuge the heparinized blood (5,000 g, 4°C, 20 min) and discard the supernatant (Fig. 1). We suspend the pellet in pH 7.5 NS to the heparinized-blood volume, centrifuge and discard the supernatant, and repeat the process two more times. Then, to obtain whole cell debris, we homogenize the RBCs, or to obtain cell debris fractions, we lyse the RBCs.
Fig. 1.
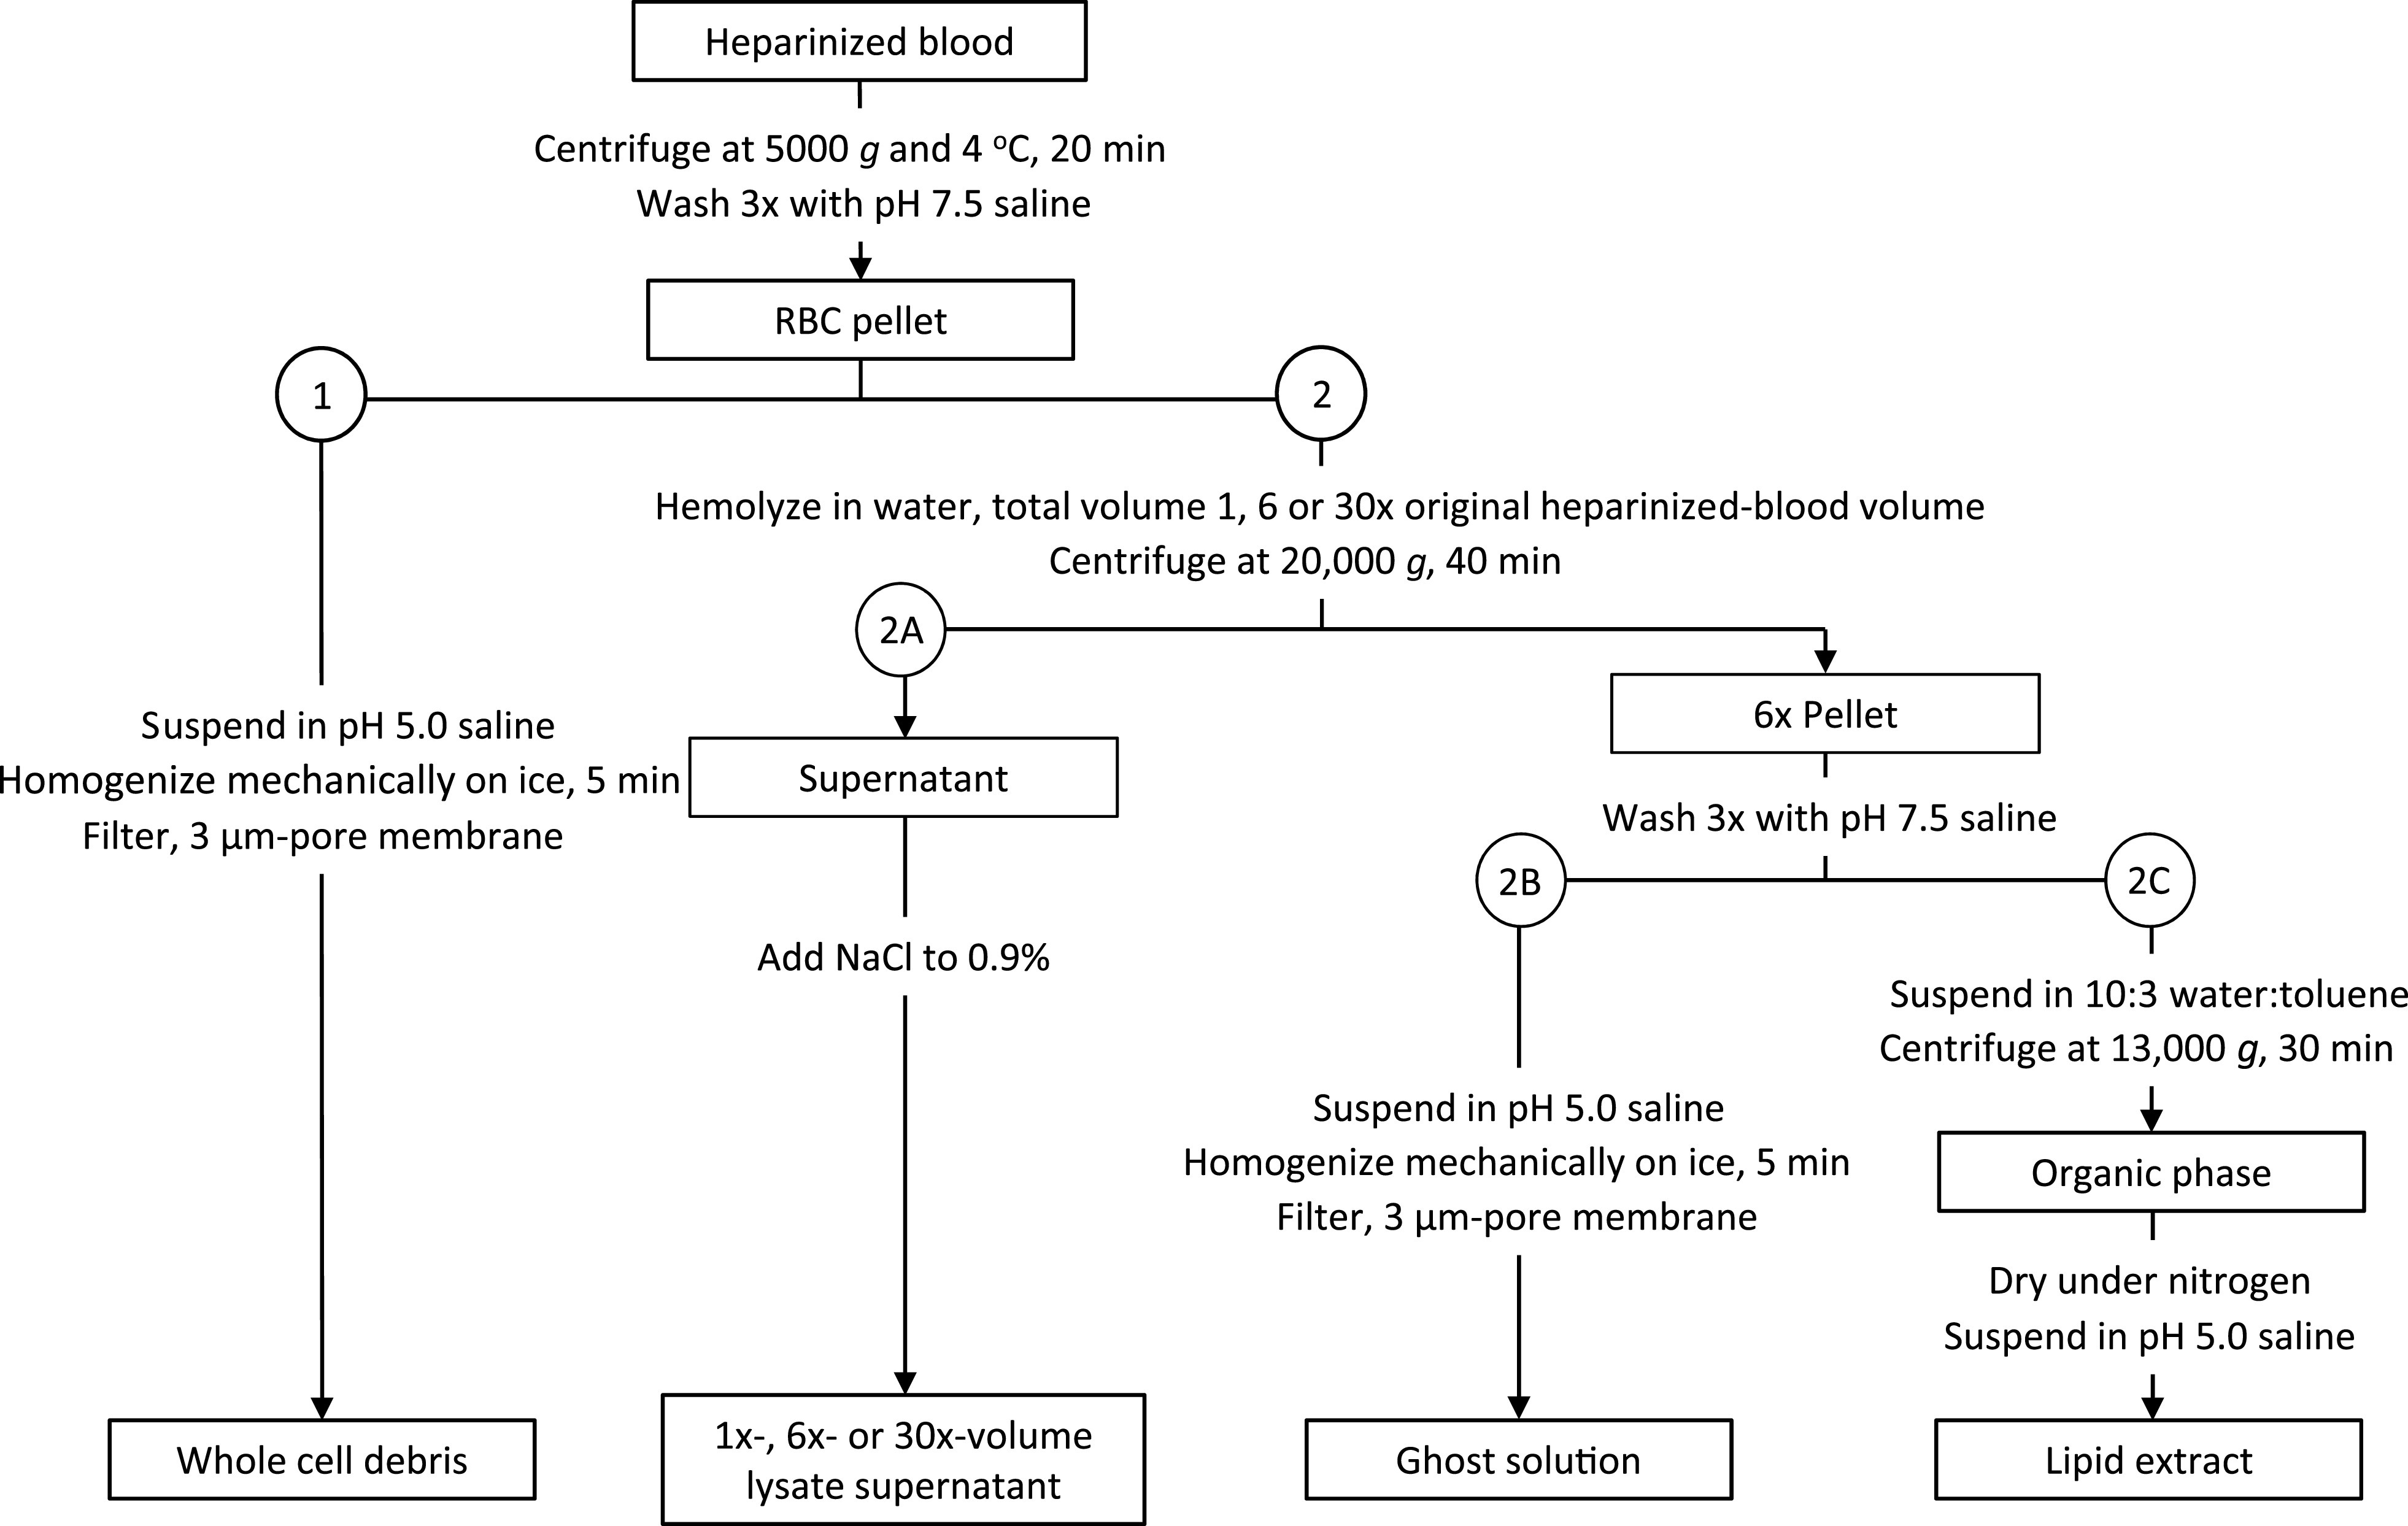
Protocol for obtaining cell debris. Methods for (1) homogenizing red blood cells (RBCs) to obtain whole cell debris or (2) lysing RBCs to obtain (2A) lysate supernatant, (2B) ghost solution, or (2C) lipid extract.
1) For whole cell debris, we suspend the pellet in pH 5.0 NS to the heparinized-blood volume. We homogenize the solution on ice (VDI12, VWR, Radnor, PA; maximum speed; 5 min) and filter the solution (3-μm pore membrane).
2) For cell debris fractions, we modify the methods of Rosenberg et al. (41). We lyse the RBCs by suspending the pellet in 1×, 6×, or 30× the heparinized-blood volume of Milli-Q-purified water (“water;” pH unadjusted, room temperature, 2 h). We centrifuge the lysate (20,000 g, 4°C, 40 min), separate the supernatant and pellet, and follow one of the three following protocols.
2A) Lysate supernatant. We add NaCl (0.9%) to the supernatant from the 1×-, 6×-, or 30×-volume lysate. The hemoglobin (Hb)-containing solutions are translucent and vary from red (1×) to pink (30×).
2B) Ghost solution. We wash the 6×-lysate pellet by suspending the pellet in the 6×-lysate volume of pH 7.5 NS (more Hb is removed at neutral than acidic pH), centrifuging the suspension (20,000 g, 4°C, 40 min), discarding the Hb-containing supernatant, and repeating the process two more times. We then suspend the pellet in pH 5.0 NS to the 6×-lysate volume, homogenize the solution on ice (maximum speed, 5 min), and filter the solution (3-μm pore membrane). The solution is light pink and cloudy.
2C) Lipid extract of RBC ghost. We wash the 6×-lysate pellet as in 2B and then suspend it in 10:3 water:toluene, with the water volume that of the 6×-lysate. To enable phase separation, we vortex the solution briefly, let the solution stand on ice (2 h), and then centrifuge the solution (13,000 g, 4°C, 30 min). We collect the toluene layer, evaporate the toluene under nitrogen, and obtain dry ghost lipids. We weigh some samples, prepared specifically for lipid quantification, on a microbalance. We prepare other samples for alveolar injection by suspending the dry lipids in 100 μL of pH 5.0 NS. The solution is clear, without color.
We quantify Hb concentration, [Hb], of whole cell debris, lysate supernatants, and ghost solution by Drabkin’s assay. We divide each sample for duplicate assay and use bovine methemoglobin (metHb) (H2500, Sigma-Aldrich) as a standard. For each solution, we calculate effective 1× [Hb] by multiplying measured [Hb] by dilution factor. For each lysate supernatant, we also prepare a solution of the equivalent concentration of metHb, [metHb].
sPLA2.
We dissolve bovine pancreatic sPLA2 IB (P8913, Sigma-Aldrich; 0.1 mg/mL) or recombinant rat sPLA2 IIA (Uniprot no. P14423 from ELISA kit LS-F23950, LS Bio, Seattle, WA; 2.5 ng/mL) in pH 5.0 NS. These two sPLA2 forms are the forms most likely to be present in ARDS (20, 24, 46).
Acid and mucins.
To test low pH or mucins, we add 0.01 N hydrochloric acid (HCl) or 25 µg/mL porcine gastric mucin (M2378, Sigma-Aldrich), respectively, to pH 5.0 NS. Alveolar instillation of this HCl concentration, which has a pH of 1.9, equivalent to that in the stomach (44), represents a worst-case scenario in which unbuffered gastric liquid reaches the alveoli.
Protocol.
We increase PL to 15 cmH2O, puncture a surface alveolus with a glass micropipette filled with a given solution, and inject ∼7–10 μL, which floods a group of alveoli. In flooded alveoli, the air-liquid interface forms a meniscus (3, 31).
We determine T at the meniscus. We first establish a regular volume history for the lungs. Noting that following alveolar injection of 5% albumin solution T is the same after 2 or 60 ventilation cycles between PL of 5 and 15 cmH2O (31), we cycle PL twice between 5 and 15 cmH2O and then hold PL at 15 cmH2O. We determine T at this high PL because we can detect a smaller percent change in T at higher PL and because elevated T at high PL is pathophysiologically relevant in that it exacerbates overexpansion-induced lung injury (31, 32, 38, 58). We determine alveolar air pressure with a tracheal transducer; liquid pressure in a flooded surface alveolus by servo-nulling measurement (Vista Electronics, Ramona, CA); and local three-dimensional meniscus radius in the same alveolus by confocal microscopy, and calculate T from the Laplace relation (31, 37). After determining T, we reduce PL to 5 cmH2O.
Experimental groups.
For control, pH 5.0 NS and solutions of each potential T-raising substance, we test the following groups: i) Base solution. ii) To model plasma-protein-rich ARDS edema liquid, base solution + 5% bovine serum albumin (A8327, Sigma-Aldrich). iii) To test exogenous surfactant at its full clinical dose, initial administration of base solution + 5% albumin and, ∼1 min later, after cycling twice between PL of 5 and 15 cmH2O to clear unstably-flooded alveoli, subsequent administration to the same region of 100% Infasurf. iv) When Infasurf does not, after the standard two-cycle ventilation history that is part of the T-determination protocol, lower T, we add an additional experiment group in which we assess the effect of further ventilation on exogenous surfactant activity. As in group (iii), we inject base solution + 5% albumin, ventilate twice, and inject Infasurf. But then, we cycle 50, rather than two, additional times between PL of 5 and 15 cmH2O before determining T. v) To test SRB (341738, Sigma-Aldrich), single administration of base solution + 5% albumin + 10 nM SRB. Table 1 shows the effects of albumin and SRB on the pH of select solutions.
Table 1.
Albumin and sulforhodamine B (SRB) effects on pH of select solutions
| Additives |
|||
|---|---|---|---|
| Base solutions | None | 5% Albumin | 5% Albumin + 10 nM SRB |
| Normal saline | 5.03 ± 0.02 | 6.83 ± 0.07* | 6.88 ± 0.05* |
| 0.01 N HCl | 1.98 ± 0.02 | 5.31 ± 0.08* | 5.23 ± 0.02* |
Values are mean ± standard deviation (SD). Solution pH measured on bench top at 22°C before injection into alveoli. *P < 0.05 vs. no-additive group for same base solution.
In the two-cycle experiments of groups (i–iii) and (v), we flood a region, ventilate twice, and determine T in a single alveolus in the region, and then repeat the protocol in three to five more regions in the same lungs over a period of up to 5 h after lung isolation. We test each solution in at least two different rat lungs. Determined T value does not correlate with time since lung isolation or rat sex. Each T determination requires 10–15 min. As the lungs are held at constant inflation during this time, our measurement is one of static surface tension. However, T in the lungs, in contrast to T under typical conditions in an in vitro surfactometer, remains metastable at its value at the time at which ventilation is stopped (28, 48). For this reason, the difference generally observed in vitro between static and dynamic T may not exist in the lungs. In support of this possibility, T determined by our static method in the lungs correlates with degree of dynamic ventilation injury (58).
In the 50-cycle experiments of group (iv), we inject base solution + 5% albumin into a first region, ventilate twice and inject Infasurf into the same region, and then repeat the two-step flooding protocol in a second region. We then administer the 50 ventilation cycles, determine T in the second region, and determine T in the first region. The time from end of ventilation to T determination is 15 min longer for the first than the second region. Next, we repeat the entire protocol, with a different solution, for two additional regions. Thus, the first set of 50 ventilation cycles applied to the lungs before injection into regions 3 and 4 is an additional protocol step for regions 3 and 4 that is not present for regions 1 and 2. However, we test each solution in two rat lungs—in regions 1 and 2 in one lung and regions 3 and 4 in a second lung. Determined T value does not vary with region number.
Statistical analysis.
We analyze data sets [in Figs. 3 and 4—groupings of 2–5 vertical bars plus normal T of the aerated alveolar liquid lining layer, represented by horizontal bar that displays data from Kharge et al. (31)] by multiple linear regression. Experimental replicate numbers indicate T determinations in individual alveoli. We report group mean ± SD and accept P < 0.05 as significant.
Fig. 3.
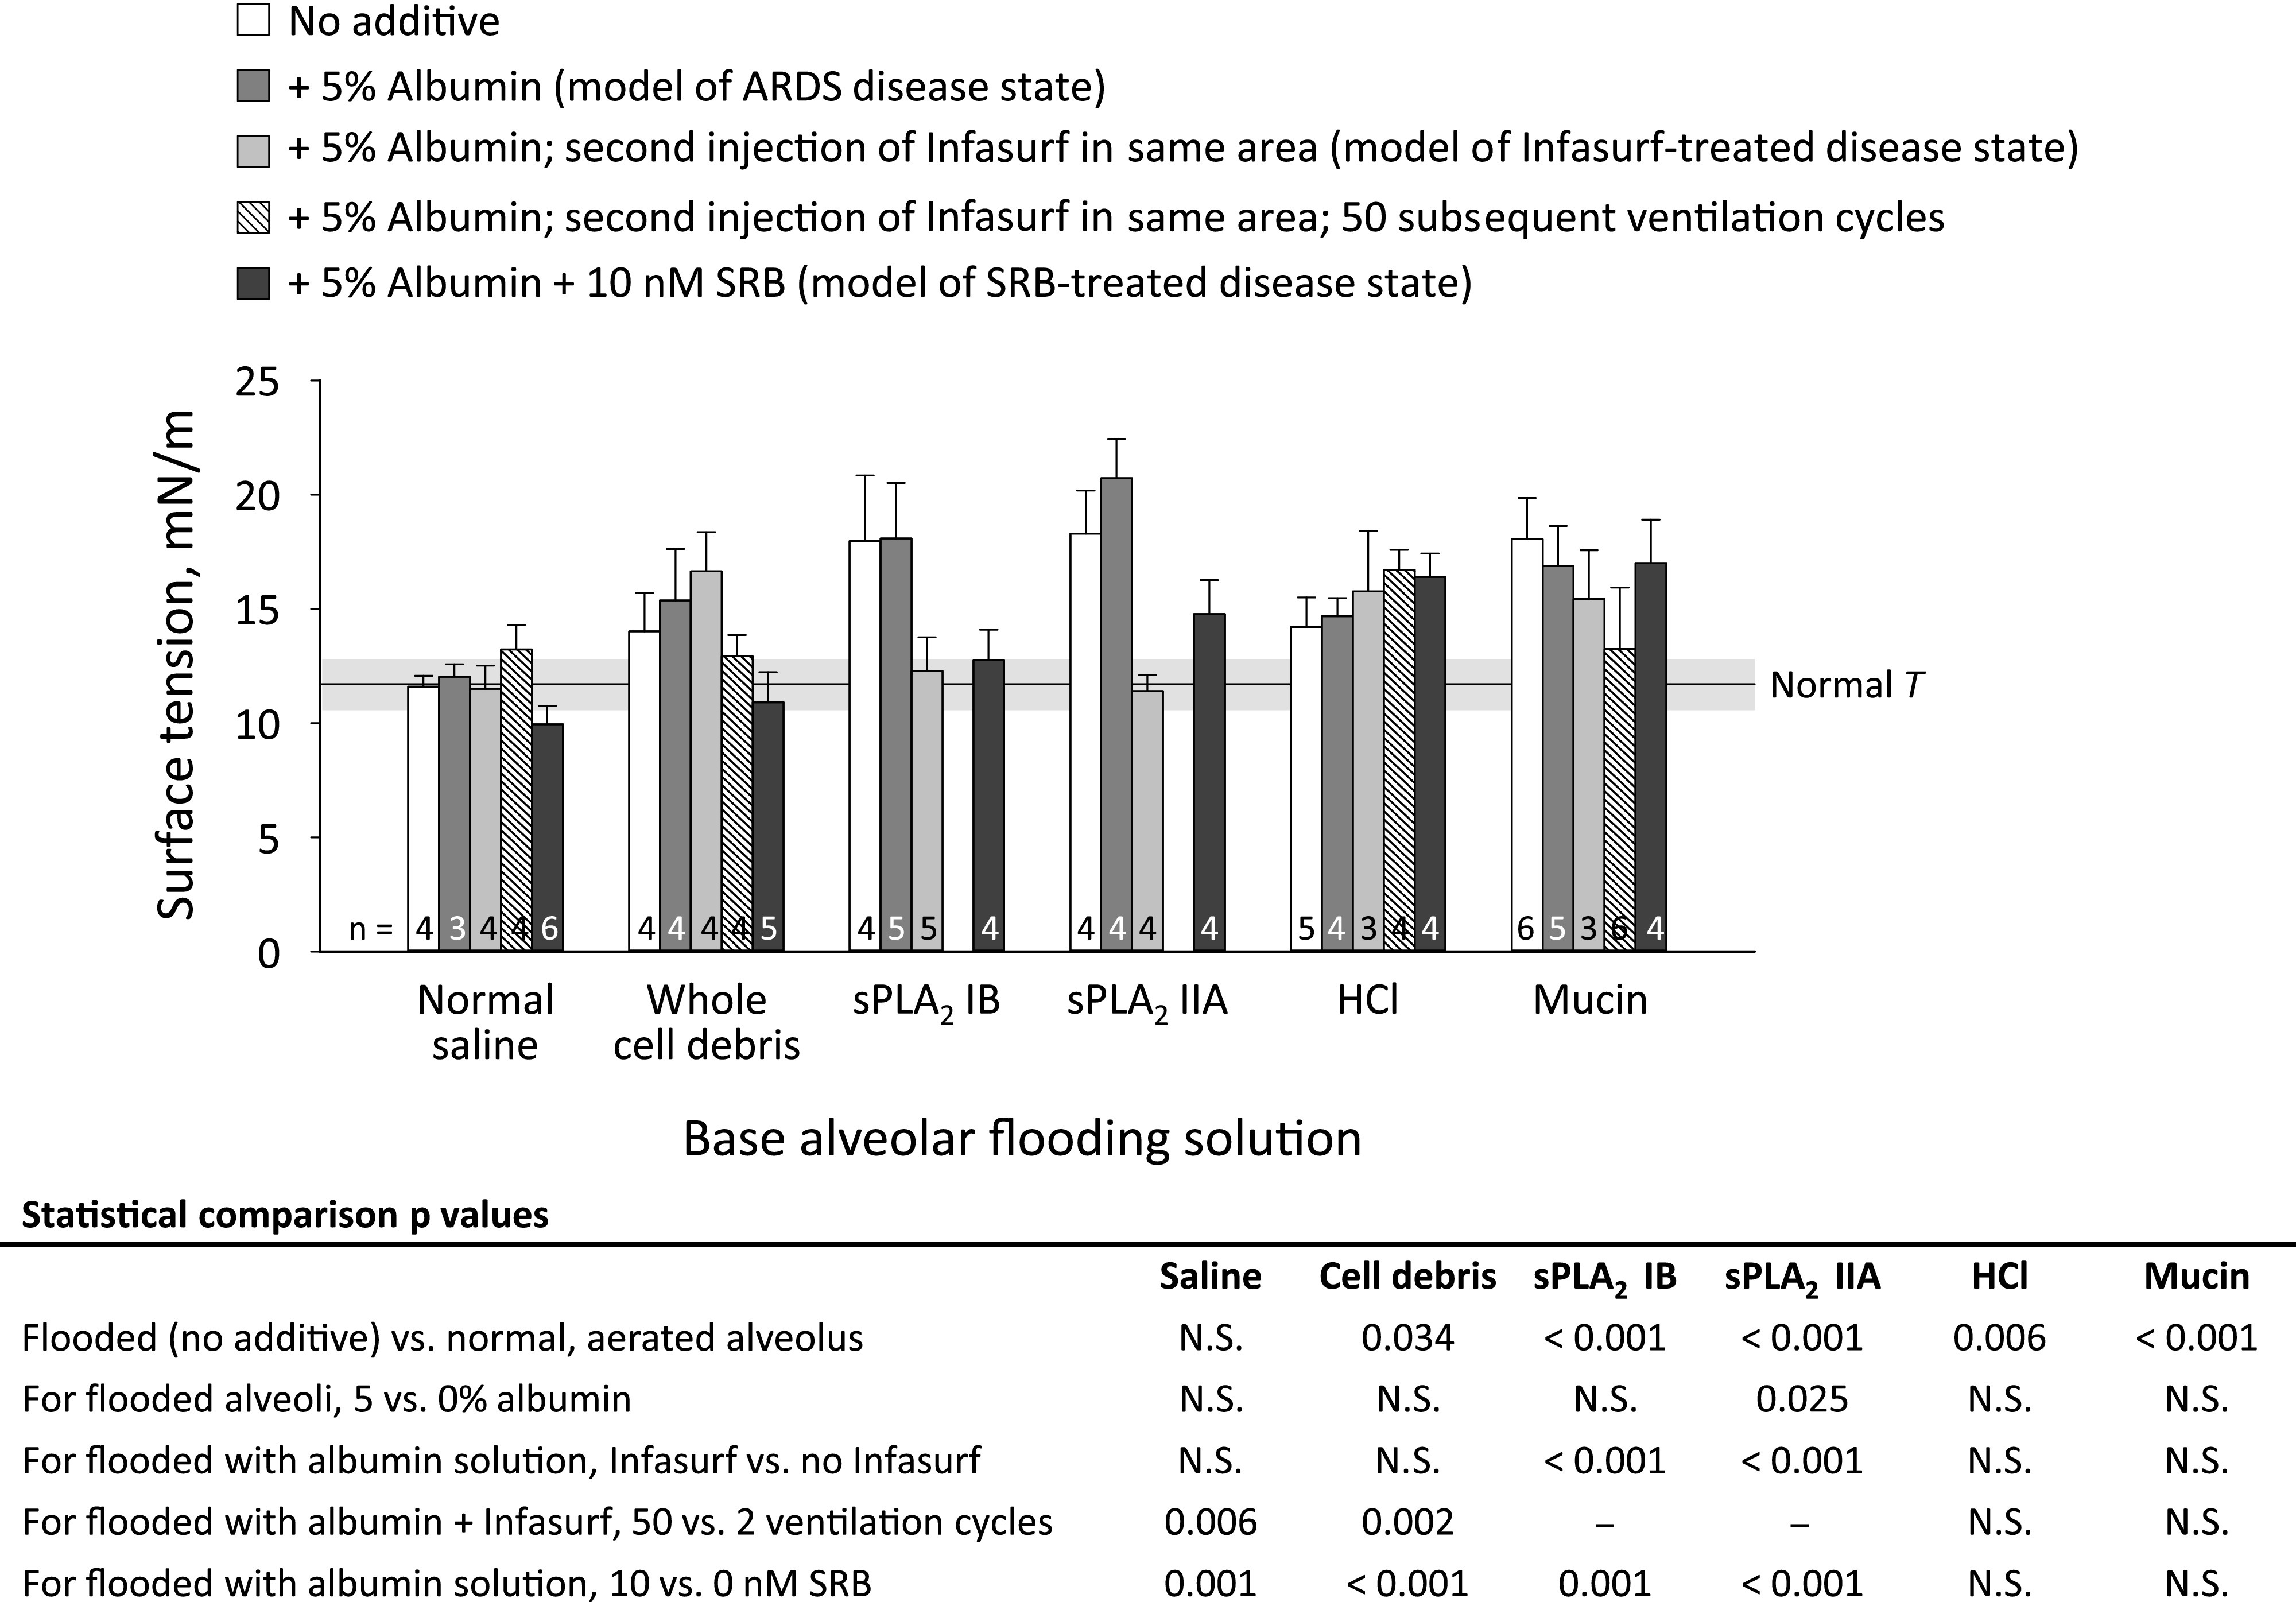
Solution effects on alveolar surface tension, T. Base flooding solutions are as follows: normal saline (control solution and solvent of experimental solutions); whole cell debris, with hemoglobin concentration of heparinized blood; secretory phospholipase A2 (sPLA2) IB, 0.1 mg/mL; sPLA2 IIA, 2.5 ng/mL; HCl, 0.01 N; and porcine gastric mucin, 25 µg/mL. Additives are as shown. After ventilating twice between transpulmonary pressures, PL, of 5 and 15 cmH2O, lungs held at constant PL of 15 cmH2O during 10- to 15-min period required to determine T. For the Infasurf + ventilation group, we apply 50, rather than two, ventilation cycles between PL of 5 and 15 cmH2O. Further details provided in the text. Horizontal gray bar shows mean ± SD for T of normal liquid lining layer in aerated lungs, also at PL of 15 cmH2O, from (31). Data for “no additive” groups with saline, HCl, and mucins are from previous study (37). Statistics shown on figure; N.S. indicates not significant.
Fig. 4.
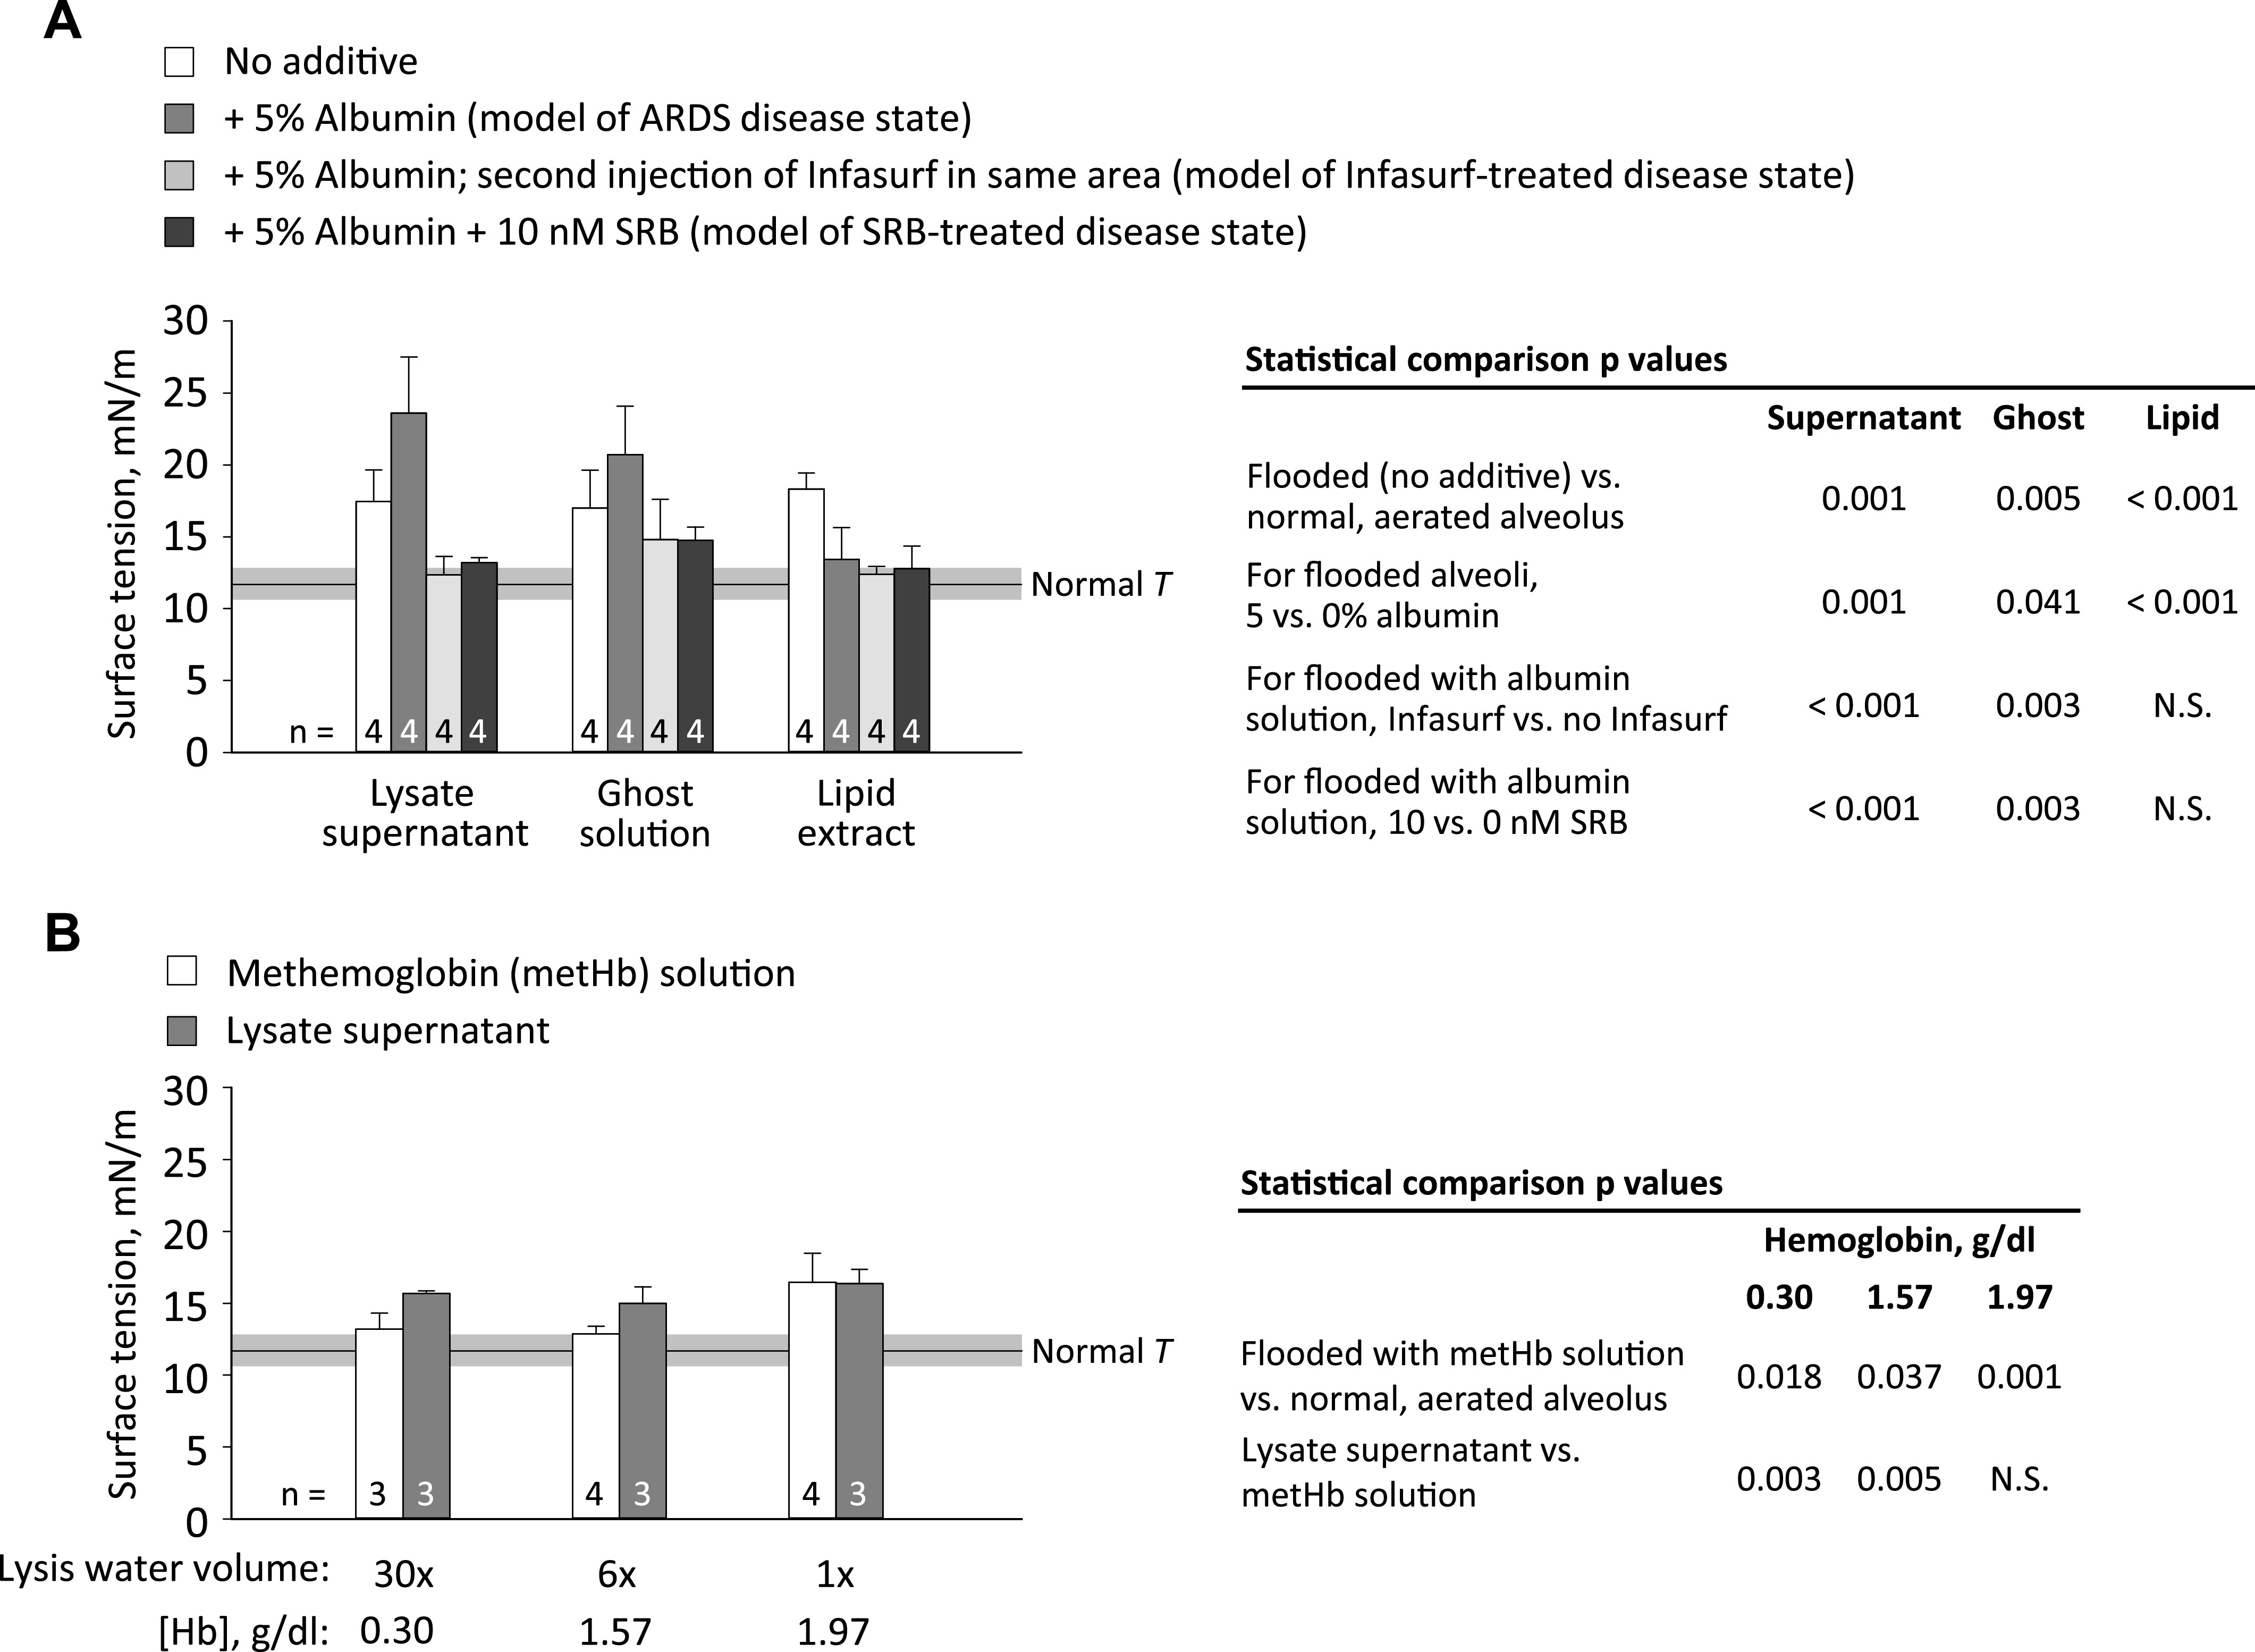
Red blood cell fraction effects on T. A: effects of 6×-lysate fractions, with additions as shown, on T. B: effects of all concentrations of lysate supernatant and solutions with matching concentrations of methemoglobin on T. Lysis water volume is multiple of original heparinized-blood volume. Surface tension determination, horizontal bar, and statistics as in Fig. 3.
RESULTS
Control saline.
In all images of injected saline ± albumin, alveolar septa appear black, indicating that fluorescein remains in the alveolar liquid (Fig. 2A). As in previous studies (31, 32, 37), alveolar injection of NS does not alter T from normal and addition of albumin has no effect (Fig. 3). Addition of Infasurf (two ventilation cycles) does not alter T, but Infasurf + 50 ventilation cycles raises T above normal. Addition of SRB lowers T below normal.
Fig. 2.

Solution effects on cells. Confocal images of alveoli after flooding with fluorescein (23 µM; green in images) in normal saline (A), 0.1 mg/mL secretory phospholipase A2 (sPLA2) IB (B), 0.01 N hydrochloric acid (HCl) (C), or 0.01 N HCl + 5% albumin (D). In A, airspace (labeled) and septa (dashed lines) are black. The latter indicates fluorescein exclusion by intact epithelium. In B–D, fluorescein appears to be concentrated in cells. Morphology suggests that the cell types may include macrophages (arrowheads, round), alveolar epithelial type I cells (open-headed arrows, thin and lining septum), and, likely, alveolar epithelial type II cells (closed-headed arrows, cuboidal), indicating damage to cell membranes and possible macrophage activation. Images (488-nm excitation, indicated laser power, 750 gain) taken ∼2 min after solution injection, at 15-μm subpleural depth. Due to saturation in (B) and (C) on left, lower-laser-power replicate images shown on right.
Cell debris.
In all images of injected cell debris ± albumin, septa appear black; fluorescein remains in the alveolar liquid. Homogenized whole cell debris raises T, and neither albumin nor Infasurf (two ventilation cycles) has an effect (Fig. 3). However, both Infasurf + 50 ventilation cycles and SRB lower T.
From the 6×-volume lysate, supernatant, ghost solution, and lipid extract fractions raise T above normal (Fig. 4A). Inclusion of albumin further raises T of lysate supernatant and ghost solution but lowers T of lipid extract. Addition of Infasurf (two ventilation cycles) or SRB lowers T of lysate supernatant and ghost solution but has no further effect on T of lipid extract.
Methemoglobin solutions with concentrations equivalent to the Hb concentrations of all three lysate supernatants (Table 2) raise T above normal (Fig. 4B). The 30×- and 6×-lysate supernatants raise T more than their equivalent metHb solutions, but the 1×-lysate supernatant does not.
Table 2.
Concentrations of hemoglobin (Hb) and lipids in whole red blood cell (RBC) debris and RBC lysate fractions
| Hb concentration, g/dL (n = 3/group) | Lipid concentration, g/dL (n = 3/group) | Effective 1× Hb concentration, g/dL | |
|---|---|---|---|
| Whole cell debris from homogenization | 13.3 ± 0.34 | — | 13.3 |
| Supernatant from 1×-volume lysate | 1.97 ± 0.27 | — | 1.97 |
| Supernatant from 6×-volume lysate | 1.57 ± 0.13 | — | 9.42 |
| Supernatant from 30×-volume lysate | 0.30 ± 0.01 | — | 9.00 |
| Ghost solution from 6×-volume lysate | 0.12 ± 0.02 | — | 0.72 |
| Lipid extract from 6×-lysate ghost solution | — | 0.13 ± 0.02 | — |
Values are mean ± SD. Solutions obtained from heparinized blood as depicted in Fig. 1 and described in methods. Effective 1× Hb concentration is product of measured Hb concentration and dilution factor.
Phospholipase A2.
In all images of injected sPLA2 IB ± albumin, 1/4 images of sPLA2 IIA, and 2/4 images of sPLA2 IIA + albumin, fluorescein is concentrated in cells (Fig. 2B). This concentration suggests hydrolysis of cell membranes and possible macrophage activation. Group IB or IIA sPLA2 solution raises T (Fig. 3). Addition of albumin has no effect on T of sPLA2 IB solution but further raises T of sPLA2 IIA solution. For these sPLA2 groups without and with albumin, there is no correlation between visual evidence of cell damage and degree of T elevation. Addition of Infasurf (two ventilation cycles) or SRB reduces T.
Hydrochloric acid and mucins.
Hydrochloric acid solution is the only tested solution that causes regional damage evident in bright-field images as visible discoloration (not shown). Following injection of HCl, fluorescein is concentrated in cells (Fig. 2C, representative of all HCl images) and T is elevated (Fig. 3). Addition of albumin buffers HCl and increases pH to 5.3 (Table 1). Nonetheless, following injection of HCl + albumin, fluorescein is concentrated in cells (Fig. 2D, representative of all HCl + albumin images) and T remains elevated. Neither Infasurf—even with 50 ventilation cycles—nor SRB lowers T.
In all images of injected mucin ± albumin, septa appear black; fluorescein remains in the alveolar liquid. Mucin solution raises T, and inclusion of albumin has no further effect (Fig. 3). Neither Infasurf—even with 50 ventilation cycles—nor SRB lowers T.
DISCUSSION
We consider, below, the mechanisms through which the substances we test alter T.
Control saline.
Our present results (Fig. 3) agree with our past report that neither albumin nor blood plasma raises T (31). Plasma proteins can increase T by adsorbing faster than surfactant to a clean interface (with constant area or cyclic 50% area compression) or readsorbing faster following surfactant layer collapse (caused by 80% area compression in vitro or 1–30 cm H2O PL variation in isolated lungs) (23, 26, 31, 56). However, plasma protein addition to the subphase does not alter T in the presence of an intact interfacial surfactant layer—in vitro, even with 50% area compression, or in isolated lungs, with physiologic PL variation (23, 26, 31). With functional native surfactant + albumin, exogenous surfactant + ventilation raises T but SRB, via a not-yet-determined mechanism, improves the efficacy of native surfactant and lowers T below normal.
Cell debris.
In ARDS, including in that caused by novel coronavirus infection, the epithelium is damaged and alveolar hemorrhage is sometimes present (2, 15, 36, 52). For whole cell debris, Infasurf + 50 ventilation cycles lowers T (Fig. 3)—interestingly, to a level that appears to be about the same as that to which, with NS + albumin (no cell debris), Infasurf + ventilation raises T. Sulforhodamine B reduces whole cell-debris-elevated T faster than Infasurf, after two ventilation cycles, suggesting action via a different mechanism than exogenous surfactant.
We further determine T in 6×-volume lysate fractions in which cell debris is more dilute than in homogenized whole cell debris (Fig. 4A). The effect of albumin differs between fractions.
Extending the previous finding of Holm and Notter (25) that RBC membrane lipids (extracted from whole sonicated cells) interfere with surfactant adsorption, we show lipid extract to interfere with an intact surfactant layer. Red blood cell membrane lipids comprise 54% phospholipid (PL), of which 6.5% is lysophosphatidylcholine (lysoPC) and 4% is disaturated PC (25). Thus, membrane lipids are more fluid than surfactant phospholipids and may interfere with the tight packing of surfactant phospholipids. LysoPC, in particular, has been shown to interfere with—suggested to intercalate into—intact surfactant layers (24, 26), although whether our lipid extract contains sufficient lysoPLs to raise T (21) is not known. Addition of albumin abolishes the T-raising effect of lipid extract. Although we use physiologically relevant fatty acid-replete albumin, albumin likely sequesters additional lipids.
Ghost solution is a homogenate of a complex mixture of RBC shells comprising cytoskeleton plus plasma membrane; organelles with their own membranes; and some whole RBCs. The presence of whole RBCs is attributable to incomplete hemolysis. During hemolysis in water, quickly rising osmolarity retards further lysis. Thus, the effective 1x [Hb] of each lysate supernatant is less than the [Hb] of whole cell debris and some Hb remains in the ghost solution (Table 2). However, the T elevation of ghost solution (Fig. 4A) is often greater than the T elevation that its low concentration of Hb would be expected to cause (Fig. 4B), suggesting that Hb is not the main T-raising component of ghost solution. Rather, membranes might be the T-raising component of ghost solution. This possibility is supported by the lack of effect of albumin—membranes are too large to be sequestered by albumin.
Hemoglobin on its own raises T in a dose-dependent fashion (Fig. 4B). One possible mechanism through which Hb might raise T is ionic interaction with the heads of negatively charged surfactant phospholipids, which could destabilize the surfactant layer (50). Previously, Hb concentrations of 2.5–20 g/dL were tested during co-adsorption with surfactant and shown to raise T (25). Here, we extend the finding to lower Hb concentrations and an intact surfactant layer.
The 30×- and 6×-lysate supernatants raise T more than their corresponding metHb solutions (Fig. 4B). The difference could be due to the presence of Fe2+-carrying fresh Hb in lysate supernatant versus Fe3+-carrying metHb in hemoglobin-only solution or due to additional T-raising substance(s), beyond Hb, present in lysate supernatant. That fresh Hb is less likely than metHb to disrupt the surfactant layer (50) suggests that the difference is most likely explained by additional T-raising substances in lysate supernatant. The identity of those T-raising substances and the mechanism through which albumin further raises T (Fig. 4A) remain to be determined. The 1×-lysate supernatant has a higher [Hb] and should have a higher concentration of other T-raising substances than the 30×- and 6×-lysate supernatants but does not raise T more than its corresponding metHb solution. The higher [Hb] has a strong effect on T and may mask the effect of other substances.
Sulforhodamine B, which rapidly normalizes T of whole cell debris (Fig. 3), also rapidly normalizes T of cell lysate fractions (Fig. 4A). The effect of Infasurf differs between solutions. With less-concentrated cell-lysate fractions (Fig. 4A), Infasurf immediately normalizes T. With more-concentrated whole cell debris (Fig. 3), ventilation is required for Infasurf to normalize T. These results suggest that cell debris-surfactant interaction is concentration dependent and support the prior finding (e.g., 35, 53) that ventilation promotes surfactant activity.
Secretory PLA2.
How elevated sPLA2 activity may elevate T in ARDS has not been fully explained. First, the mechanism could be surfactant phospholipid depletion, but >80% hydrolysis might be required (21, 24). As the hydrolysis product lysoPL associates with, but does not completely compose, small aggregates and small aggregates contain 72% of ARDS bronchoalveolar lavage fluid (BALF) phospholipids (45, 46), this threshold is not likely met. Second, hydrolysis of plasma membranes (Fig. 2B) might release T-elevating cell debris. Third, the surfactant- and plasma membrane-hydrolysis products lysoPL and fatty acid (FA) could disrupt surfactant phospholipid packing. LysoPLs, at 10%–20% hydrolysis, raise T of an intact surfactant layer, raise T following co-adsorption with surfactant, and, subsequent to co-adsorption, raise minimum T, TMIN, following cyclic 50% area compression (21, 24, 26). Although lysoPLs often comprise <10% of ARDS BALF phospholipids, lysoPC in one case comprised ∼18% (45, 46). Fatty acids, at 10%–20% hydrolysis, raise T during co-adsorption with surfactant and subsequently, albeit inconsistently and to a lesser degree than lysoPLs, raise TMIN following cyclic 50% area compression (21, 24). Fourth, the activity of sPLA2 IIA, which cleaves phosphatidylglycerol (PG) and phosphatidylethanolamine (PE) but not PC, is elevated in ARDS BALF and the fraction of PG is reduced (22, 45, 46). Degradation of PG, which interacts with surfactant protein B, may have an outsized effect on T (46).
We find that albumin does not alter or increases the sPLA2 effect on T (Fig. 3). These results fit within a wide range of reports of condition-specific and interdependent sPLA2-product and albumin effects on sPLA2 activity. Plucthun and Dennis (39) showed that FAs stimulate sPLA2 IB hydrolysis of PC/ or PE/Triton X-100 micelles. Also for sPLA2 IB, Conricode and Ochs (9) showed that cleavage products inhibit and ≤1% albumin stimulates hydrolysis of PC liposomes; and <0.1% albumin stimulates and 0.1%–0.3% albumin inhibits hydrolysis of PC/cholate micelles. (Conricode and Ochs did not investigate ∼5% albumin.) Conricode and Ochs surmised that, as FAs stimulate sPLA2 IB, likely by remaining at and lending a negative charge to the lipid-water interface, i) it must be lysoPLs, more of which dissociate, that inhibit PC liposome hydrolysis and ii) albumin must sequester lysoPLs. Conricode and Ochs further speculated that different lipid-water interface charges, which underlie membrane affinities for FAs, explain the different albumin effects under different conditions. Our observation that albumin does not alter the sPLA2 IB effect on T suggests that, for native surfactant, product inhibition of sPLA2 IB may be minimal. Although we are not aware of product stimulation/inhibition data for sPLA2 IIA, our observation that albumin tends to increase T suggests product inhibition and albumin sequestration of product.
As noted earlier in this section, sPLA2 likely cleaves surfactant and plasma-membrane PLs. Infasurf immediately and fully reverses T elevation by either sPLA2 IB or IIA. That supplementation of degraded native surfactant normalizes T again suggests that surfactant activity is concentration dependent. Sulforhodamine B fully reverses T elevation by sPLA2 IB and partially but significantly reverses T elevation by sPLA2 IIA. As SRB acts in conjunction with albumin and native surfactant, the ability of SRB to lower T indicates that significant functional native surfactant remains present.
Acid aspiration.
In aspiration, pH 1.6–2.3 gastric contents (44) enter the airways and mix with airway liquid that should buffer pH but contribute T-raising mucins (33, 37). If there is little mixture with airway liquid, then low pH liquid, which should aggregate mucins and block their T-raising effect (27, 37), may reach the alveolus. Acid might raise T by direct effect on surfactant or indirect effect on the alveolar wall, the latter scenario leading to cell debris contamination of the edema liquid. That Infasurf counters T elevation by RBC debris, but not acid, suggests that cell debris is not the cause of acid-induced T elevation; acid may, rather, directly alter lung surfactant. This conclusion contradicts a prior finding of pH of 2 not altering surfactant function in vitro (18), but, as mentioned in the methods, surfactant behaves differently in the lungs than in vitro (28, 48). If there is significant mixture of aspirate with airway liquid, then it may be a higher-pH liquid that reaches the alveolus. If pH exceeds 4, mucins should be unaggregated (27) and, upon reaching the alveoli, could potentially raise T. The possibility of a detrimental role for mucins stems from our prior finding that tracheal saline instillation washes mucins to the alveoli and raises alveolar T 42% above normal (37). However, tracheal saline instillation does not cause lung injury and we determined T in that study after two ventilation cycles. Additional ventilation might enable native surfactant to counter the effect of mucins. The pathophysiologic significance of mucin-elevated T is not known.
That albumin-buffered HCl, with a pH of 5.3 (Table 1), injures the epithelium (Fig. 2D) is surprising. We speculate that solution pH may decrease upon injection into the alveolus, where phospholipid head group phosphates may induce H+ dissociation from albumin.
Neither Infasurf nor SRB reduces T elevation by HCl + albumin. The inefficacy of SRB against HCl + albumin could be attributable to a pH effect on SRB-albumin interaction. Albumin Sudlow site I attracts the xanthene rings of SRB (34). As discussed in the paragraph above, alveolar injection may reduce the pH of HCl + albumin solution. And pH <4.3 causes compaction of albumin (4, 11), which might interfere with albumin-SRB binding. Alternatively, SRB likely responds to pH similarly to rhodamine WT, which below pH 4.7 loses a negative charge and becomes a zwitterion (54). The lost charge, which is not on the xanthene rings, might alter interaction of an albumin-SRB complex with surfactant.
Neither Infasurf nor SRB reduces T elevation by mucins, although Infasurf + ventilation appears close to having an effect. We speculate that the large, nonglycosylated hydrophobic domains of mucins (47, 51) interfere with surfactant by hydrophobic interaction. For SRB, there might, similarly, be a hydrophobic interaction between mucins and its xanthene rings (34).
Study limitations.
Our study includes multiple limitations. First, we do not test all purported mechanisms of T elevation in ARDS. We do not investigate possible cholesterol contamination of the surfactant layer (16, 35). However, we previously showed that cholesterol-containing blood plasma does not alter T in the lungs (31). Another possible mechanism is surfactant damage by leukocyte- or macrophage-released reactive oxygen species (ROS). As discussed elsewhere (38), the principal effect of phospholipid oxidation is likely due to generation of lysophospholipids (40). As Infasurf and SRB reverse sPLA2-elevated T, which is likely attributable to lysophospholipid generation, exogenous surfactant and SRB would both likely reduce T elevated by phospholipid oxidation. Oxidation of surfactant protein B (SP-B), however, may also contribute to T elevation in ARDS (40); whether oxidation of SP-B raises T of an already- established intact surfactant layer and whether exogenous surfactant or SRB would reduce T in such a scenario remains to be determined. Second, we do not assess alveolar diminishment or collapse that might rupture the surfactant layer and allow edema liquid components to raise T by adsorption but show elsewhere (60) that, even with marked alveolar diminishment in injured lungs, surfactant layer integrity is maintained. Further, surfactant secretion and recycling are continuous processes in the alveolus, including in isolated lungs (29). We have not determined whether T-raising substances act by interfering with secretion or recycling. Finally, for the substances we test, we do not know the pathophysiologic concentration in ARDS edema liquid. We select concentrations that raise T in the lungs to levels comparable to those in other models of lung injury (31, 37, 59). To determine whether SRB can reduce T under ARDS conditions, testing in animal models of ARDS will be required.
Conclusion.
We show that cell debris, sPLA2, acid, and mucins raise T of an intact surfactant layer. In the ∼12% of ARDS cases caused by gastric aspiration (13), neither exogenous surfactant nor SRB appears likely to reduce T. In ARDS due to other causes, both surfactant therapy and SRB show potential for lowering alveolar T. For exogenous surfactant, this study extends prior in vitro findings to show ventilation- and concentration-dependent efficacy in the presence of an initially intact surfactant layer. For SRB, this study demonstrates, for the first time, efficacy under ARDS conditions.
Either surfactant therapy or SRB could be administered by tracheal instillation or nebulization. However, delivery via the trachea to injured lung regions is a challenge (10, 14). Given the elevated barrier permeability of injured lung regions in ARDS, SRB might alternatively be delivered intravenously. This consideration raises the possibility of a new treatment modality for ARDS.
GRANTS
This study was funded by National Heart, Lung, and Blood Institute Grant R01 HL113577.
DISCLOSURES
No conflicts of interest, financial or otherwise, are declared by the authors.
AUTHOR CONTRIBUTIONS
T.L.N. and C.E.P. conceived and designed research; T.L.N. performed experiments; T.L.N. analyzed data; T.L.N. and C.E.P. interpreted results of experiments; T.L.N. and C.E.P. prepared figures; T.L.N. and C.E.P. drafted manuscript; T.L.N. and C.E.P. edited and revised manuscript; T.L.N. and C.E.P. approved final version of manuscript.
ACKNOWLEDGMENTS
We are grateful to Dr. Edmund Egan, of ONY Biotech, for donating the Infasurf for this study.
REFERENCES
- 1.Albert RK The role of ventilation-induced surfactant dysfunction and atelectasis in causing acute respiratory distress syndrome. Am J Respir Crit Care Med 185: 702–708, 2012. doi: 10.1164/rccm.201109-1667PP. [DOI] [PubMed] [Google Scholar]
- 2.Ambrosio AM, Luo R, Fantoni DT, Gutierres C, Lu Q, Gu W-J, Otsuki DA, Malbouisson LMS, Auler JOC Jr, Rouby J-J; Experimental ARDS Study Group . Effects of positive end-expiratory pressure titration and recruitment maneuver on lung inflammation and hyperinflation in experimental acid aspiration-induced lung injury. Anesthesiology 117: 1322–1334, 2012. doi: 10.1097/ALN.0b013e31827542aa. [DOI] [PubMed] [Google Scholar]
- 3.Bachofen H, Schürch S, Michel RP, Weibel ER. Experimental hydrostatic pulmonary edema in rabbit lungs. Morphology. Am Rev Respir Dis 147: 989–996, 1993. doi: 10.1164/ajrccm/147.4.989. [DOI] [PubMed] [Google Scholar]
- 4.Baler K, Martin OA, Carignano MA, Ameer GA, Vila JA, Szleifer I. Electrostatic unfolding and interactions of albumin driven by pH changes: a molecular dynamics study. J Phys Chem B 118: 921–930, 2014. doi: 10.1021/jp409936v. [DOI] [PMC free article] [PubMed] [Google Scholar]
- 5.Brower RG, Fessler HE. Another “negative” trial of surfactant. Time to bury this idea? Am J Respir Crit Care Med 183: 966–968, 2011. doi: 10.1164/rccm.201101-0018ED. [DOI] [PubMed] [Google Scholar]
- 6.Brower RG, Matthay MA, Morris A, Schoenfeld D, Thompson BT, Wheeler A; Acute Respiratory Distress Syndrome Network . Ventilation with lower tidal volumes as compared with traditional tidal volumes for acute lung injury and the acute respiratory distress syndrome. N Engl J Med 342: 1301–1308, 2000. doi: 10.1056/NEJM200005043421801. [DOI] [PubMed] [Google Scholar]
- 7.Cereda M, Xin Y, Hamedani H, Bellani G, Kadlecek S, Clapp J, Guerra L, Meeder N, Rajaei J, Tustison NJ, Gee JC, Kavanagh BP, Rizi RR. Tidal changes on CT and progression of ARDS. Thorax 72: 981–989, 2017. doi: 10.1136/thoraxjnl-2016-209833. [DOI] [PMC free article] [PubMed] [Google Scholar]
- 8.Chen W, Chen Y-Y, Tsai C-F, Chen SC-C, Lin M-S, Ware LB, Chen C-M. Incidence and outcomes of acute respiratory distress syndrome: a nationwide registry-based study in Taiwan, 1997 to 2011. Medicine (Baltimore) 94: e1849, 2015. doi: 10.1097/MD.0000000000001849. [DOI] [PMC free article] [PubMed] [Google Scholar]
- 9.Conricode KM, Ochs RS. Mechanism for the inhibitory and stimulatory actions of proteins on the activity of phospholipase A2. Biochim Biophys Acta 1003: 36–43, 1989. doi: 10.1016/0005-2760(89)90095-7. [DOI] [PubMed] [Google Scholar]
- 10.Dugernier J, Reychler G, Wittebole X, Roeseler J, Depoortere V, Sottiaux T, Michotte J-B, Vanbever R, Dugernier T, Goffette P, Docquier M-A, Raftopoulos C, Hantson P, Jamar F, Laterre P-F. Aerosol delivery with two ventilation modes during mechanical ventilation: a randomized study. Ann Intensive Care 6: 73, 2016. doi: 10.1186/s13613-016-0169-x. [DOI] [PMC free article] [PubMed] [Google Scholar]
- 11.El Kadi N, Taulier N, Le Huérou JY, Gindre M, Urbach W, Nwigwe I, Kahn PC, Waks M. Unfolding and refolding of bovine serum albumin at acid pH: ultrasound and structural studies. Biophys J 91: 3397–3404, 2006. doi: 10.1529/biophysj.106.088963. [DOI] [PMC free article] [PubMed] [Google Scholar]
- 12.European Commission, Directorate General, Scientific Committee on Consumer Products (SCCP) Opinion on Acid Red 52 [Online]. http://ec.europa.eu/health/ph_risk/committees/04_sccp/docs/sccp_o_137.pdf.
- 13.Eworuke E, Major JM, Gilbert McClain LI. National incidence rates for acute respiratory distress syndrome (ARDS) and ARDS cause-specific factors in the United States (2006-2014). J Crit Care 47: 192–197, 2018. doi: 10.1016/j.jcrc.2018.07.002. [DOI] [PubMed] [Google Scholar]
- 14.Filoche M, Tai C-F, Grotberg JB. Three-dimensional model of surfactant replacement therapy. Proc Natl Acad Sci USA 112: 9287–9292, 2015. doi: 10.1073/pnas.1504025112. [DOI] [PMC free article] [PubMed] [Google Scholar]
- 15.Germann PG, Häfner D. A rat model of acute respiratory distress syndrome (ARDS): Part 1. Time dependency of histological and pathological changes. J Pharmacol Toxicol Methods 40: 101–107, 1998. doi: 10.1016/S1056-8719(98)00048-3. [DOI] [PubMed] [Google Scholar]
- 16.Gunasekara L, Schürch S, Schoel WM, Nag K, Leonenko Z, Haufs M, Amrein M. Pulmonary surfactant function is abolished by an elevated proportion of cholesterol. Biochim Biophys Acta 1737: 27–35, 2005. doi: 10.1016/j.bbalip.2005.09.002. [DOI] [PubMed] [Google Scholar]
- 17.Günther A, Siebert C, Schmidt R, Ziegler S, Grimminger F, Yabut M, Temmesfeld B, Walmrath D, Morr H, Seeger W. Surfactant alterations in severe pneumonia, acute respiratory distress syndrome, and cardiogenic lung edema. Am J Respir Crit Care Med 153: 176–184, 1996. doi: 10.1164/ajrccm.153.1.8542113. [DOI] [PubMed] [Google Scholar]
- 18.Haddad IY, Holm BA, Hlavaty L, Matalon S. Dependence of surfactant function on extracellular pH: mechanisms and modifications. J Appl Physiol (1985) 76: 657–662, 1994. doi: 10.1152/jappl.1994.76.2.657. [DOI] [PubMed] [Google Scholar]
- 19.Hallman M, Spragg R, Harrell JH, Moser KM, Gluck L. Evidence of lung surfactant abnormality in respiratory failure. Study of bronchoalveolar lavage phospholipids, surface activity, phospholipase activity, and plasma myoinositol. J Clin Invest 70: 673–683, 1982. doi: 10.1172/JCI110662. [DOI] [PMC free article] [PubMed] [Google Scholar]
- 20.Hite RD, Seeds MC, Jacinto RB, Balasubramanian R, Waite M, Bass D. Hydrolysis of surfactant-associated phosphatidylcholine by mammalian secretory phospholipases A2. Am J Physiol 275: L740–L747, 1998. doi: 10.1152/ajplung.1998.275.4.L740. [DOI] [PubMed] [Google Scholar]
- 21.Hite RD, Seeds MC, Jacinto RB, Grier BL, Waite BM, Bass DA. Lysophospholipid and fatty acid inhibition of pulmonary surfactant: non-enzymatic models of phospholipase A2 surfactant hydrolysis. Biochim Biophys Acta 1720: 14–21, 2005. doi: 10.1016/j.bbamem.2005.10.014. [DOI] [PubMed] [Google Scholar]
- 22.Hite RD, Seeds MC, Safta AM, Jacinto RB, Gyves JI, Bass DA, Waite BM. Lysophospholipid generation and phosphatidylglycerol depletion in phospholipase A(2)-mediated surfactant dysfunction. Am J Physiol Lung Cell Mol Physiol 288: L618–L624, 2005. doi: 10.1152/ajplung.00274.2004. [DOI] [PubMed] [Google Scholar]
- 23.Holm BA, Enhorning G, Notter RH. A biophysical mechanism by which plasma proteins inhibit lung surfactant activity. Chem Phys Lipids 49: 49–55, 1988. doi: 10.1016/0009-3084(88)90063-1. [DOI] [PubMed] [Google Scholar]
- 24.Holm BA, Keicher L, Liu MY, Sokolowski J, Enhorning G. Inhibition of pulmonary surfactant function by phospholipases. J Appl Physiol (1985) 71: 317–321, 1991. doi: 10.1152/jappl.1991.71.1.317. [DOI] [PubMed] [Google Scholar]
- 25.Holm BA, Notter RH. Effects of hemoglobin and cell membrane lipids on pulmonary surfactant activity. J Appl Physiol (1985) 63: 1434–1442, 1987. doi: 10.1152/jappl.1987.63.4.1434. [DOI] [PubMed] [Google Scholar]
- 26.Holm BA, Wang Z, Notter RH. Multiple mechanisms of lung surfactant inhibition. Pediatr Res 46: 85–93, 1999. doi: 10.1203/00006450-199907000-00015. [DOI] [PubMed] [Google Scholar]
- 27.Hong Z, Chasan B, Bansil R, Turner BS, Bhaskar KR, Afdhal NH. Atomic force microscopy reveals aggregation of gastric mucin at low pH. Biomacromolecules 6: 3458–3466, 2005. doi: 10.1021/bm0505843. [DOI] [PubMed] [Google Scholar]
- 28.Horie T, Hildebrandt J. Dynamic compliance, limit cycles, and static equilibria of excised cat lung. J Appl Physiol 31: 423–430, 1971. doi: 10.1152/jappl.1971.31.3.423. [DOI] [PubMed] [Google Scholar]
- 29.Islam MN, Gusarova GA, Monma E, Das SR, Bhattacharya J. F-actin scaffold stabilizes lamellar bodies during surfactant secretion. Am J Physiol Lung Cell Mol Physiol 306: L50–L57, 2014. doi: 10.1152/ajplung.00252.2013. [DOI] [PMC free article] [PubMed] [Google Scholar]
- 30.Kamath BD, Macguire ER, McClure EM, Goldenberg RL, Jobe AH. Neonatal mortality from respiratory distress syndrome: lessons for low-resource countries. Pediatrics 127: 1139–1146, 2011. doi: 10.1542/peds.2010-3212. [DOI] [PMC free article] [PubMed] [Google Scholar]
- 31.Kharge AB, Wu Y, Perlman CE. Surface tension in situ in flooded alveolus unaltered by albumin. J Appl Physiol (1985) 117: 440–451, 2014. doi: 10.1152/japplphysiol.00084.2014. [DOI] [PMC free article] [PubMed] [Google Scholar]
- 32.Kharge AB, Wu Y, Perlman CE. Sulforhodamine B interacts with albumin to lower surface tension and protect against ventilation injury of flooded alveoli. J Appl Physiol (1985) 118: 355–364, 2015. doi: 10.1152/japplphysiol.00818.2014. [DOI] [PMC free article] [PubMed] [Google Scholar]
- 33.Kim D, Liao J, Hanrahan JW. The buffer capacity of airway epithelial secretions. Front Physiol 5: 188, 2014. doi: 10.3389/fphys.2014.00188. [DOI] [PMC free article] [PubMed] [Google Scholar]
- 34.Kitamura M, Murakami K, Yamada K, Kawai K, Kunishima M. Binding of sulforhodamine B to human serum albumin: a spectroscopic study. Dyes Pigments 99: 588–593, 2013. doi: 10.1016/j.dyepig.2013.06.011. [DOI] [Google Scholar]
- 35.Lugones Y, Blanco O, López-Rodríguez E, Echaide M, Cruz A, Pérez-Gil J. Inhibition and counterinhibition of Surfacen, a clinical lung surfactant of natural origin. PLoS One 13: e0204050, 2018. doi: 10.1371/journal.pone.0204050. [DOI] [PMC free article] [PubMed] [Google Scholar]
- 36.Montaner JS, Tsang J, Evans KG, Mullen JB, Burns AR, Walker DC, Wiggs B, Hogg JC. Alveolar epithelial damage. A critical difference between high pressure and oleic acid-induced low pressure pulmonary edema. J Clin Invest 77: 1786–1796, 1986. doi: 10.1172/JCI112503. [DOI] [PMC free article] [PubMed] [Google Scholar]
- 37.Nguyen TL, Perlman CE. Tracheal acid or surfactant instillation raises alveolar surface tension. J Appl Physiol (1985) 125: 1357–1367, 2018. doi: 10.1152/japplphysiol.00397.2017. [DOI] [PMC free article] [PubMed] [Google Scholar]
- 38.Perlman CE The contribution of surface tension-dependent alveolar septal stress concentrations to ventilation-induced lung injury in the acute respiratory distress syndrome. Front Physiol 11: 388, 2020. doi: 10.3389/fphys.2020.00388. [DOI] [PMC free article] [PubMed] [Google Scholar]
- 39.Plückthun A, Dennis EA. Activation, aggregation, and product inhibition of cobra venom phospholipase A2 and comparison with other phospholipases. J Biol Chem 260: 11099–11106, 1985. [PubMed] [Google Scholar]
- 40.Rodríguez-Capote K, Manzanares D, Haines T, Possmayer F. Reactive oxygen species inactivation of surfactant involves structural and functional alterations to surfactant proteins SP-B and SP-C. Biophys J 90: 2808–2821, 2006. doi: 10.1529/biophysj.105.073106. [DOI] [PMC free article] [PubMed] [Google Scholar]
- 41.Rosenberg SA, Guidotti G. The protein of human erythrocyte membranes. I. Preparation, solubilization, and partial characterization. J Biol Chem 243: 1985–1992, 1968. [PubMed] [Google Scholar]
- 42.Rubenfeld GD, Caldwell E, Peabody E, Weaver J, Martin DP, Neff M, Stern EJ, Hudson LD. Incidence and outcomes of acute lung injury. N Engl J Med 353: 1685–1693, 2005. doi: 10.1056/NEJMoa050333. [DOI] [PubMed] [Google Scholar]
- 43.Rühl N, Lopez-Rodriguez E, Albert K, Smith BJ, Weaver TE, Ochs M, Knudsen L. Surfactant protein B deficiency induced high surface tension: relationship between alveolar micromechanics, alveolar fluid properties and alveolar epithelial cell injury. Int J Mol Sci 20: 4243, 2019. doi: 10.3390/ijms20174243. [DOI] [PMC free article] [PubMed] [Google Scholar]
- 44.Savarino V, Mela GS, Zentilin P, Mansi C, Mele MR, Vigneri S, Cutela P, Vassallo A, Dallorto E, Celle G. Evaluation of 24-hour gastric acidity in patients with hepatic cirrhosis. J Hepatol 25: 152–157, 1996. doi: 10.1016/S0168-8278(96)80067-5. [DOI] [PubMed] [Google Scholar]
- 45.Scaccabarozzi D, Deroost K, Lays N, Omodeo Salè F, Van den Steen PE, Taramelli D. Altered lipid composition of surfactant and lung tissue in murine experimental malaria-associated acute respiratory distress syndrome. PLoS One 10: e0143195, 2015. doi: 10.1371/journal.pone.0143195. [DOI] [PMC free article] [PubMed] [Google Scholar]
- 46.Seeds MC, Grier BL, Suckling BN, Safta AM, Long DL, Waite BM, Morris PE, Hite RD. Secretory phospholipase A2-mediated depletion of phosphatidylglycerol in early acute respiratory distress syndrome. Am J Med Sci 343: 446–451, 2012. doi: 10.1097/MAJ.0b013e318239c96c. [DOI] [PMC free article] [PubMed] [Google Scholar]
- 47.Shankar V, Virmani AK, Naziruddin B, Sachdev GP. Macromolecular properties and polymeric structure of canine tracheal mucins. Biochem J 276: 525–532, 1991. doi: 10.1042/bj2760525. [DOI] [PMC free article] [PubMed] [Google Scholar]
- 48.Smith EC, Crane JM, Laderas TG, Hall SB. Metastability of a supercompressed fluid monolayer. Biophys J 85: 3048–3057, 2003. doi: 10.1016/S0006-3495(03)74723-7. [DOI] [PMC free article] [PubMed] [Google Scholar]
- 49.Summers C, Singh NR, Worpole L, Simmonds R, Babar J, Condliffe AM, Gunning KE, Johnston AJ, Chilvers ER. Incidence and recognition of acute respiratory distress syndrome in a UK intensive care unit. Thorax 71: 1050–1051, 2016. doi: 10.1136/thoraxjnl-2016-208402. [DOI] [PMC free article] [PubMed] [Google Scholar]
- 50.Szebeni J, Di Iorio EE, Hauser H, Winterhalter KH. Encapsulation of hemoglobin in phospholipid liposomes: characterization and stability. Biochemistry 24: 2827–2832, 1985. doi: 10.1021/bi00333a003. [DOI] [PubMed] [Google Scholar]
- 51.Thornton DJ, Rousseau K, McGuckin MA. Structure and function of the polymeric mucins in airways mucus. Annu Rev Physiol 70: 459–486, 2008. doi: 10.1146/annurev.physiol.70.113006.100702. [DOI] [PubMed] [Google Scholar]
- 52.Tian S, Xiong Y, Liu H, Niu L, Guo J, Liao M, Xiao S-Y. Pathological study of the 2019 novel coronavirus disease (COVID-19) through postmortem core biopsies. Mod Pathol 33: 1007–1014, 2020. doi: 10.1038/s41379-020-0536-x. [DOI] [PMC free article] [PubMed] [Google Scholar]
- 53.Tierney DF, Johnson RP. Altered surface tension of lung extracts and lung mechanics. J Appl Physiol 20: 1253–1260, 1965. doi: 10.1152/jappl.1965.20.6.1253. [DOI] [Google Scholar]
- 54.Vasudevan D, Fimmen RL, Francisco AB. Tracer-grade rhodamine WT: structure of constituent isomers and their sorption behavior. Environ Sci Technol 35: 4089–4096, 2001. doi: 10.1021/es010880x. [DOI] [PubMed] [Google Scholar]
- 55.Villar J, Blanco J, Kacmarek RM. Current incidence and outcome of the acute respiratory distress syndrome. Curr Opin Crit Care 22: 1–6, 2016. doi: 10.1097/MCC.0000000000000266. [DOI] [PubMed] [Google Scholar]
- 56.Warriner HE, Ding J, Waring AJ, Zasadzinski JA. A concentration-dependent mechanism by which serum albumin inactivates replacement lung surfactants. Biophys J 82: 835–842, 2002. doi: 10.1016/S0006-3495(02)75445-3. [DOI] [PMC free article] [PubMed] [Google Scholar]
- 57.Wu C, Chen X, Cai Y, Xia J, Zhou X, Xu S, Huang H, Zhang L, Zhou X, Du C, Zhang Y, Song J, Wang S, Chao Y, Yang Z, Xu J, Zhou X, Chen D, Xiong W, Xu L, Zhou F, Jiang J, Bai C, Zheng J, Song Y. Risk factors associated with acute respiratory distress syndrome and death in patients with coronavirus disease 2019 pneumonia in Wuhan, China. JAMA Intern Med 180: 934–943, 2020. doi: 10.1001/jamainternmed.2020.0994. [DOI] [PMC free article] [PubMed] [Google Scholar]
- 58.Wu Y, Kharge AB, Perlman CE. Lung ventilation injures areas with discrete alveolar flooding, in a surface tension-dependent fashion. J Appl Physiol (1985) 117: 788–796, 2014. doi: 10.1152/japplphysiol.00569.2014. [DOI] [PMC free article] [PubMed] [Google Scholar]
- 59.Wu Y, Nguyen TL, Perlman CE. Accelerated deflation promotes homogeneous airspace liquid distribution in the edematous lung. J Appl Physiol (1985) 122: 739–751, 2017. doi: 10.1152/japplphysiol.00526.2016. [DOI] [PMC free article] [PubMed] [Google Scholar]
- 60.Wu Y, Nguyen TL, Perlman CE. Intravenous sulforhodamine B reduces alveolar surface tension, improves oxygenation and reduces ventilation injury in a respiratory distress model. J Appl Physiol (1985). In press. doi: 10.1152/japplphysiol.00421.2020. [DOI] [PMC free article] [PubMed] [Google Scholar]
- 61.Wu Z, McGoogan JM. Characteristics of and important lessons from the coronavirus disease 2019 (COVID-19) outbreak in China: summary of a report of 72314 cases from the Chinese Center for Disease Control and Prevention. JAMA 323: 1239–1242, 2020. doi: 10.1001/jama.2020.2648. [DOI] [PubMed] [Google Scholar]