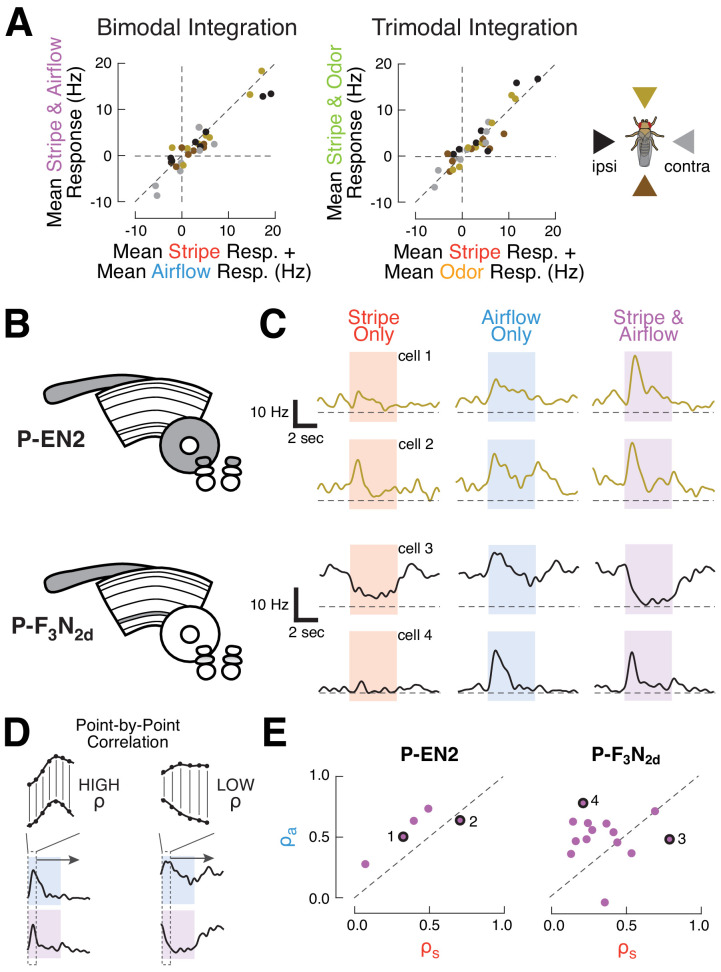
Figure 2. CX columnar neurons sum inputs from different modalities on average, but show diverse integration strategies at the level of single cells.
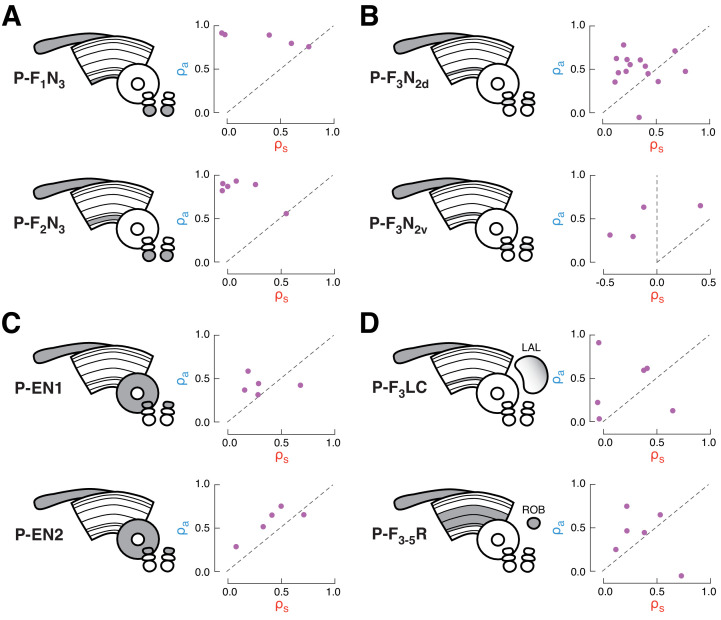
(A) Summation of multimodal cues. Left: mean spiking response to stripe and airflow together versus sum of mean stripe alone and airflow alone responses. Each point represents the response of one cell type to cues from one direction. Right: mean spiking response to stripe and airflow and odor versus sum of mean stripe alone response and mean airflow and odor response. Colors indicate cue direction (far right). Data falling along the diagonals indicate perfectly weighted summation. (B) CX neuropils innervated by example cell types P-EN2 and P-F3N2d. (C) PSTHs of two neurons from each cell type. Curves represent mean firing rate across four trials of each stimulus from a single direction. Colored boxes indicate the four second stimulus period. Dashed lines indicate 0 Hz. Top: example P-EN2 neurons responding to frontal cues. In both cases, the multi-sensory response (purple) is a weighted sum of the single modality responses (red, blue). Bottom: P-F3N2d neurons responding to ipsilateral cues. In one cell (cell 3) the stripe response dominates the multi-sensory response, while in the other (cell 4) the airflow response dominates. (D) Correlation method for computing response similarity. We computed a point-by-point correlation between the mean baseline-subtracted firing rate timecourses of multi-sensory (airflow and stripe together) responses and responses to a single modality (airflow alone, or stripe alone), across all stimulus directions. Similar traces result in high correlation coefficient (ρ). (E) Correlation coefficients (calculated as in D) of the multimodal response (stripe and airflow together) to each single modality response (airflow alone, ρa, or stripe alone, ρs). Data along the diagonal indicates that the multi-sensory response is equally similar to the stripe alone and airflow alone responses, a hallmark of summation. Data off diagonal indicates that one modality dominates the multi-sensory response. The four example cells from (C) are labeled with numbers and black rings. P-EN2 neurons consistently sum stripe and airflow responses (top), while P-F3N2d neurons integrate with greater diversity (bottom).


