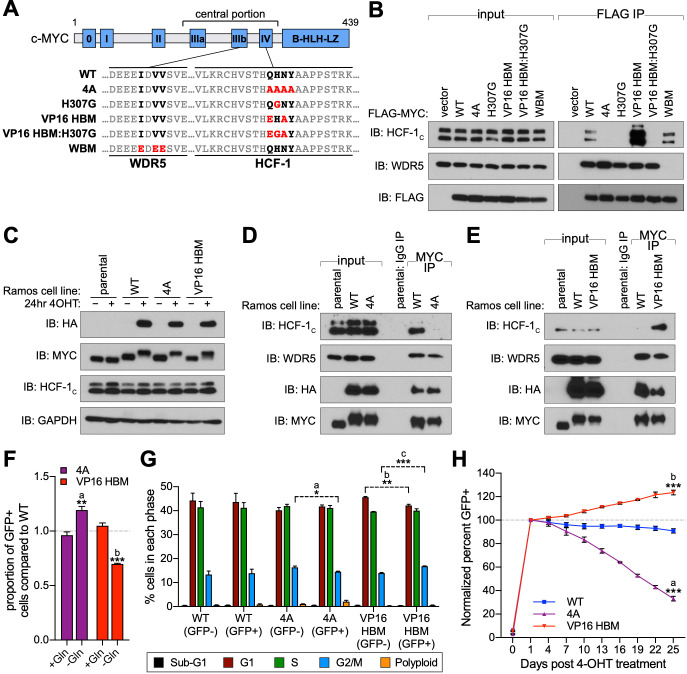
Figure 1. A gain- and loss-of-function system to study the MYC–host cell factor (HCF)–1 interaction.
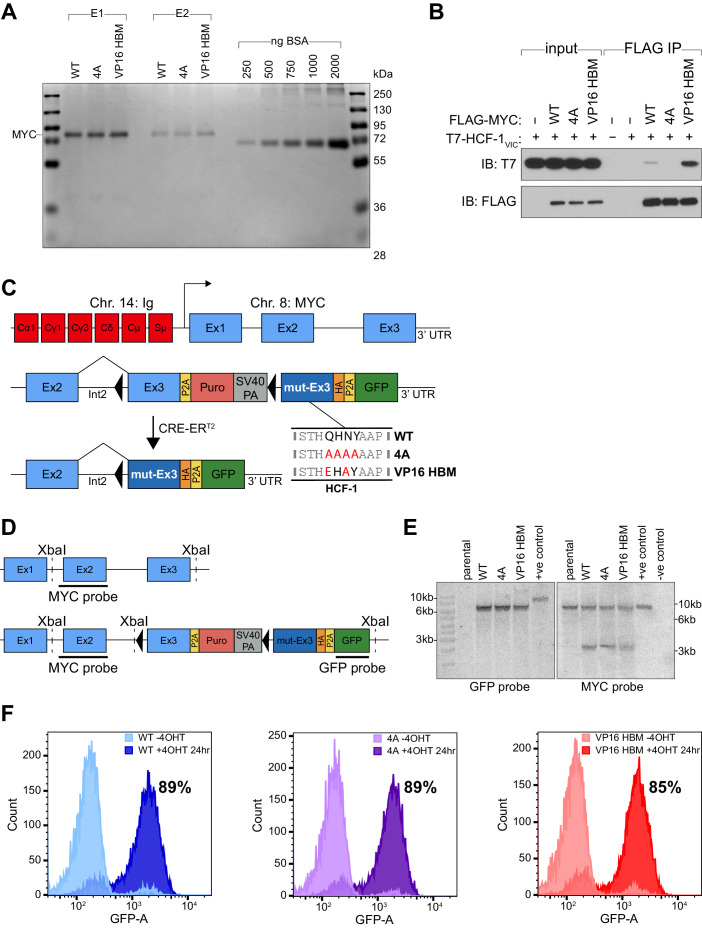
(A) Schematic of MYC, depicting the location of the six MYC boxes (Mb0–MbIV). MbIIIb carries a WDR5-binding motif (WBM). MbIV contains an HCF-1-binding motif (HBM). Residues relevant to the WBM or HBM are in bold, and residues mutated in this study are in red. (B) FLAG-tagged full-length MYC proteins carrying the mutations described in (A) were transiently expressed in 293T cells, recovered by anti-FLAG immunoprecipitation (IP), and the input, or IP eluates, probed for the presence of HCF-1C, WDR5, or FLAG-tagged proteins by western blotting. (C) Western blot of lysates from parental (CRE-ERT2) or switchable Ramos cells (wild-type [WT], 4A, or VP16 HBM) ±20 nM 4-OHT for 24 hr. Blots were probed with antibodies against the HA tag, MYC, HCF-1C, and GAPDH. (D and E) Parental or switchable Ramos cells (WT, 4A, or VP16 HBM) were treated with 20 nM 4-OHT for 24 hr, lysates prepared, and IP performed using anti-IgG or anti-MYC antibodies. Input lysates and IP eluates were probed using antibodies against HCF-1C, WDR5, HA tag, and MYC by western blotting. All lines in these experiments express CRE-ERT2. (F) Switchable Ramos cell lines were pulsed with 20 nM 4-OHT for 2 hr to switch ~50% of cells, propagated for 3 days, and grown for 16 hr in media with or without glutamine. The impact of glutamine deprivation was measured by flow cytometry to determine the proportion of green fluorescent protein (GFP)-positive (switched) cells. For each of the mutants, the proportion of GFP-positive cells was normalized to that for WT cells. Shown are the mean and standard error for three biological replicates. Student’s t-test between +Gln and −Gln was used to calculate p-values; a = 0.0066, b = 0.0002. (G) Switchable Ramos cells were pulsed with 4-OHT as in (F), grown for 7 days, and cell cycle distribution determined by propidium iodide (PI) staining and flow cytometry, binning cells according to whether they expressed GFP (GFP+, switched) or not (GFP−, unswitched). Shown are the mean and standard error for three biological replicates. Student’s t-test between GFP− and GFP+ cells was used to calculate p-values; a = 0.033, b = 0.0041, c = 0.0006. (H) Switchable Ramos cells were pulsed with 4-OHT as in (F), and the proportion of GFP-positive cells measured by flow cytometry 24 hr after treatment and every 3 days following. For each of the replicates, the proportion of GFP-positive cells is normalized to that on day 1. Shown are the mean and standard error for three biological replicates. Student’s t-test between WT and each of the mutants at day 25 was used to calculate p-values; a = 0.000028, b = 0.00026.


