Abstract
Purpose
In order to clarify the role of the optic nerve (ON) as a load on ocular rotation, we developed a finite element model (FEM) of incremental adduction induced by active contractility of extraocular muscles (EOMs), with and without tethering by the ON.
Methods
Three-dimensional (3-D) horizontal rectus EOM geometries were obtained from magnetic resonance imaging of five healthy adults, and measured constitutive tissue properties were used. Active and passive strain energies of EOMs were defined using ABAQUS (Dassault Systemes) software. All deformations were assumed to be caused by EOM twitch activation that rotated the eye about a fixed center. The medial rectus (MR) muscle was commanded to additionally contract starting from 26 degrees adducted position, and the lateral rectus (LR) to relax, further adducting the eye either with or without loading by the ON. Tridimensional heat maps were generated to represent the stress and strain distributions.
Results
Tensions in the EOMs were physiologically plausible during incremental adduction. Force in the MR increased from 10 gm at 26 degrees adduction to approximately 28 gm at 32 degrees adduction. Under identical MR contraction, adduction with ON loading reached 32 degrees but 36 degrees without it. Maximum and minimum principal strains within the MR were 16% and 22%, respectively, but when ON loading was included, resulting stress and strain were concentrated at the optic disc.
Conclusions
This physiologically plausible method of simulating EOM activation can provide realistic input to model biomechanical behavior of active and passive tissues in the orbit to clarify biomechanical consequences of ON traction during adduction.
Keywords: adduction, extraocular muscle, finite element modeling, optic nerve, sclera
Quantitative models have been invaluable in clarifying many neural control and muscular aspects of normal ocular motility1 as well as various aspects of disorders of binocular alignment that comprise strabismus.2,3 Not surprisingly in view of the multiple compartments of the six oculorotary extraocular muscles (EOMs) of each eye4,5 and the intricacy of their connective tissue gimbal system upon which the EOMs also insert,6 computational models of binocular alignment can be overwhelmingly complex. As in modeling of almost every phenomenon, simplifications have been made. The model of D. A. Robinson,3 later expanded in collaboration with J. M. Miller,2,7 and simplified by Haslwanter et al.,8–10 considered the EOMs as thin, curved, or straight lines in lumped parameter analyses. A similar modeling approach based on string primitives was also simplified.11 An alternative approach of finite element modeling (FEM) has been used on a limited basis to simulate small horizontal eye rotations based on a thermal expansion implementation of EOM contraction and relaxation,12 but only one anatomically simplified model has up to this time sought to implement physiologically realistic EOM activation.13 All of the forgoing lumped parameter and FE models of ocular motility have neglected the effect of the optic nerve (ON) altogether.
It was thus a further challenge to the ocular motor field when magnetic resonance imaging (MRI) studies revealed that the ON acts as a significant mechanical load during ocular rotations.14 When adduction exceeds about 26 degrees,15 and in some people, even a smaller angle,16 the redundancy in typical ON length is geometrically exhausted so that its path becomes maximally straightened, and the ON begins to act as a tether.14,17–19 In healthy people, this tethering in adduction stretches the ON16 and translates the eyeball nasally but does not retract it posteriorly.16,19,20 However, in patients with primary open angle glaucoma (POAG) who have either had only normal20 or elevated levels of intraocular pressure,19 ON traction in adduction causes significant globe retraction. Not surprisingly, infrared imaging discloses deformation of the optic disc during horizontal eye rotation,21 particularly in adduction beyond exceeding the threshold of tethering.15 It is also notable that lesser but still significant optic disc tilting occurs even in abduction where there is no tethering of the ON.15,21 See-saw deformation of the optic disc during horizontal eye rotation is exaggerated in patients with papilledema in whom the pressure of intracranial fluid that fills the optic nerve sheath (ONS) is abnormally elevated,22 but even in this case adduction causes greater folding in the peripapillary retina than does abduction.23 An FEM of modest 13 degrees ab- and adductions has been implemented by assumed forces exerted at the scleral insertions of the horizontal rectus EOMs as the globe rotates about an assumed fixed center within homogeneous but freely flowing orbital fat filling the orbit, without explicit EOMs or discrete connective tissues.24 This simplified FEM predicts that transverse forces in the orbit cause significant shearing forces even in the sinuous ON that tilt the optic disc and peripapillary tissues during adduction more than abduction, remarkably predicting ON tractional force at about the same absolute level as reported for horizontal rectus EOM tensions: about 15 gm in adduction and 9 gm in abduction.24
A sinuous ON path is not only complex, but individually variable in shape and relative length among different people. It is therefore a useful simplification to consider the behavior of the ON when its path has become uniformly straightened by adduction. An FEM has been developed to evaluate the effect of traction exerted by the straight ON in larger adduction by an additional 6 degrees from its 26 degrees threshold.25 This model also assumed ocular rotation about a fixed center by EOM traction on the anterior sclera (AS), and neglected all orbital tissues except for the globe and ON because for these gaze angles straight ON has negligible transverse path changes. While the FEM of Shin et al. made several assumptions that are in a sense complementary to those of Wang et al.,24 it also predicted significant deformation of the optic disc, lamina cribrosa (LC), and peripapillary sclera (PPS) during adduction tethering.
The forgoing FEMs suggest that the ON significantly loads the globe during horizontal eye movements. However, rather than incorporate explicit EOMs, both FEMs assumed ocular rotation by artificial forces, and neither assumed realistic orbital fat and connective tissue structures. It is the aim of the current study to develop an FEM of ocular adduction implemented by anatomically and functionally realistic EOMs and to evaluate the magnitude of resulting mechanical effects imposed by this eye movement on the ON and posterior ocular tissues.
Materials and Methods
A realistic anatomic structure of a left orbit was defined based on our extensive collection of MRI from which excellent quality sets were selected of five healthy normal volunteers imaged in multiple gaze positions established by fixation of fiber optic targets.26 All volunteers had given written informed consent prior to participation in a protocol approved by the Institutional Review Board for Protection of Human Subjects, and in conformity with the Declaration of Helsinki. Imaging was obtained using a General Electric (Milwaukee, WI, USA) 1.5T Signa scanner using a quad surface coil array by Medical Advances (Milwaukee, WI, USA), with 2 mm plane thickness and 246 square matrix and T2 fast spin echo pulse sequences as published.26,27 The field of view was 100 mm for axial planes, and 80 mm for quasi-coronal images perpendicular to the long orbital axis. Left orbits were digitally reflected to the orientations of right orbits.
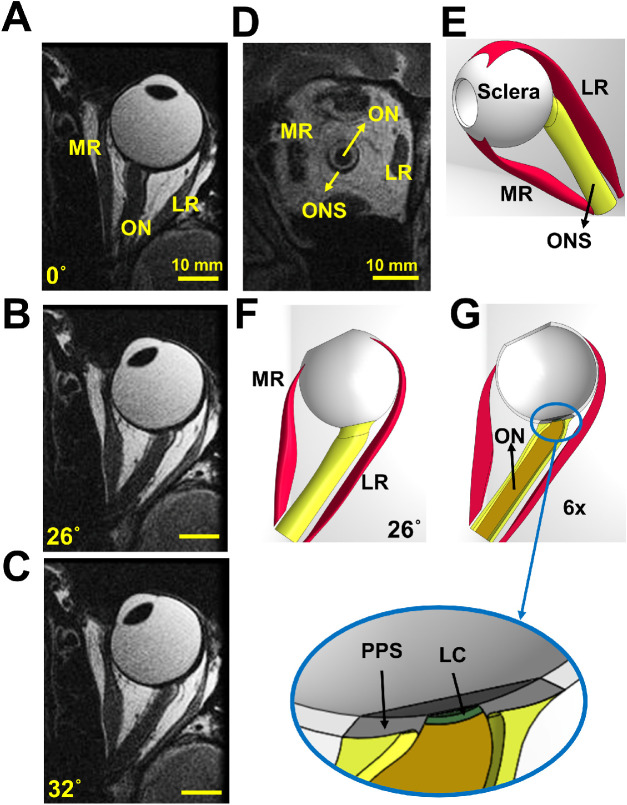
In this modeling study, ocular adduction was simulated by contracting the medial rectus (MR) muscle as the lateral rectus (LR) relaxed (Fig. 1). Previous studies have demonstrated that MR and LR EOMs are the principal actuators for horizontal eye rotation9,28,29 and treatment of horizontal strabismus.30 Therefore, for simplicity the model disregarded the existence of the vertical rectus and oblique EOMs. Initial eye position was set at 26 degrees (small adduction), which is estimated to be the average threshold for ON straightening19 at which tethering begins in healthy adults.19
Figure 1.
Axial magnetic resonance imaging (MRI) and renderings of a left orbit. (A) Axial MRI in central gaze position (angle of 0 degrees showing a sinuous ON). (B) MRI in 26 degrees adduction showing a straight ON. (C) MRI in 32 degrees adduction showing an elongated ON remaining straight. (D) Quasi-coronal MRI of the orbit illustrated in panel A. (E) The 3-D representation designed in SolidWorks. Complete (F) and horizontally hemisected (G) representation in 26 degrees adduction. LC, lamina cribrosa; MR, medial rectus muscle; LR, lateral rectus muscle; ONS, optic nerve sheath; PPS, peripapillary sclera.
Geometrical Representation
The geometrical data defining the 3D structure of the orbit was obtained from high-resolution MRI, along with published data describing several regions of sclera,31–33 including PPS34,35; LC36,37; ON14; and ONS.14 The PPS was taken to be an annulus with approximately 0.4 mm thickness34,35 and 8 mm outer diameter that surrounds the optic disc. In this study, quasi-coronal MRI planes perpendicular to the long axis of the orbits of five healthy eye volunteers were used to define the 3-D geometries of the MR and LR muscles. On average, 16 coronal planes 2 mm thick starting from near the apex to the globe equator were analyzed. The 3-D coordinate of the area centroids, as well as the cross-sectional area of the horizontal rectus EOMs, were analyzed as previously published38 and described in anatomical detail.38,39 Published locations of rectus insertions were used.40
As shown in the axial view in central gaze, Figure 1A, ON path straightens by 26 degrees adduction, the reference state for these simulations (Fig. 1B). With further adduction to 32° (Fig. 1C.), the ON undergoes tensile elongation, exerting traction on its junction with the globe, near the visually-critical LC. A hemisymmetric, 3-D model of the reference state was designed using the software package SOLIDWORKS 2020 (Dassault Systèmes SIMULIA Corp., Johnston, RI, USA; Figs. 1E, 1F). A hemisected image is represented in Figure 1G to show the interior of the eye.
Material Properties and Constitutive Models
Although it is recognized that ocular tissues exhibit complex mechanical behavior due to their anisotropic structure and time-dependent material properties, such behaviors represent a heavy computational burden for numerical simulations. This study assumed all tissues except the EOMs to be homogeneous, isotropic, incompressible, and hyperelastic based on tensile data obtained in 22 pairs of fresh, unfixed human ocular specimens in our laboratory.41 The hyperelastic functions describing these data have coefficients of determination (R2) exceeding 0.99, indicating that the functions describe the tensile behavior well. This data thus defined the material properties of ON, ONS, PPS, posterior sclera (PS), equatorial sclera (EqS), and anterior sclera (AS). Collection of this tensile data required pre-stretching of specimens until first detectable tension exceeding sensor noise level; this approach would not be able to determine the complete extent of the low toe loading region. Therefore, 2% strain was added to the beginning of each curve to replace the low toe region presumably undetectable in the experimental data.
The small size of the LC makes it difficult to define its tensile properties. Stress-strain behavior of strips of tissue containing the LC42 and attached PPS has been published, but may be confounded by inclusion of other tissues in the specimens.42 Atomic force microscopy nano-indentation of the entire LC has been published.43 We have reported that the ON contains a matrix of intrinsic connective tissue patterned similarly to the LC with which it abuts,44 and suggested that this is the reason for high ON stiffness.25 Therefore, the current study assumed that the stress-strain curve of LC is the average of those of the ON and PPS, because LC is transitional between the ON and PPS, and its material properties should change gradually to avoid junctional discontinuities. The stress-strain data for all tissues are imported into the software package ABAQUS 2020 (Dassault Systèmes SIMULIA Corp.) using hyperelastic material coefficients. Tendons are assumed to be linear elastic with relatively high stiffness approximately that of the anterior sclera (Table 1). In this table, C10-C50 and D1-D5 represent the coefficients of reduced polynomial constitutive model:
| (1) |
where U is the strain energy, is the first invariant of the right Cauchy–Green strain tensor, and Jel is elastic volume strain. In this study, N ranges from 2 to 5 according to Table 1. The E and ν in Table 1 represent Young's modulus and Poisson's ratio of linear elastic material, respectively.
Table 1.
Hyperelastic Reduced Polynomial Model Parameters for Passive Ocular Tissues
| Coefficients | |||||||||||
|---|---|---|---|---|---|---|---|---|---|---|---|
| Tissue | Model Order | C10 × 102 (MPa) | C20 (MPa) | C30 × 10−2 (MPa) | C40 × 10−3 (MPa) | C50 × 10−4 (MPa) | D1 (MPa) | D2 (MPa) | D3 (MPa) | D4 (MPa) | D5 (MPa) |
| Lamina cribrosa (LC) | 4th | 12.0 | 30.0 | −4.2 | 2.3 | – | 0.2 | 0 | 0 | 0 | – |
| Optic nerve (ON) | 5th | 1.1 | 5.3 | 2.3 | −3.8 | 1.7 | 0 | 0 | 0 | 0 | 0 |
| Optic nerve sheath (ONS) | 3rd | 2.9 | 21.5 | 1.2 | – | – | 0 | 0 | 0 | - | - |
| Peripapillary sclera (PPS) | 5th | 0.4 | 8.4 | 2.2 | −3.5 | 1.5 | 0 | 0 | 0 | 0 | 0 |
| Anterior sclera (AS) | 3rd | 0.5 | 71.7 | 2.7 | – | – | 0 | 0 | 0 | – | – |
| Equatorial sclera (EqS) | 3rd | 2.4 | 17.8 | 13.7 | – | – | – | – | – | – | – |
| Posterior sclera (PS) | 2nd | 5.2 | 28.4 | – | – | – | 0 | 0 | – | – | – |
| Tendon | 0 (Linear) | Young's Modulus (E) 50 MPa | Poisson's ratio (ν) 0.48 | ||||||||
Rectus EOMs were represented as fiber-reinforced material38,39,45 exhibiting nonlinear, hyperelastic, and active mechanical behaviors.9,45 In this study, we applied a 3-D skeletal muscle constitutive model developed by Lu et al.46,47 and based on Hill's 3-element model48 as shown in Figure 2. This model has the capability of simulating both passive and active EOM behavior during shortening and lengthening.
Figure 2.

The contractile element (CE) generates active force in the EOM. When non-activated, the CE can freely extend. The series elastic element (SEE) is a nonlinear spring in series with the CE. The SEE provides a rapid transition from inactive to active state, and an energy storing mechanism.47 The parallel element (PE) is a nonlinear spring in parallel with the CE and SEE. It represents the elasticity of the connective tissues and is responsible for the passive mechanical behavior of the EOM under stretch. The σf represents the total EOM tension.47 All EOM variables supplied to the ABAQUS subroutine are time-dependent and explained in Table 2.
Table 2.
Variables and Functions for EOM Behavior
| Variable | Definition |
|---|---|
| λs | Stretch ratio in series elastic element |
| Δλs | Stretch increment in series elastic element |
| The first invariant of the right Cauchy–Green strain tensor | |
| J | Jacobian of the deformation gradient |
| λ | Muscle stretch |
| Fiber stretch ratio with the volume change eliminated | |
| Stretch rate in contractile element (s−1) | |
| σPE | Stress in passive element (MPa) |
| fPE | Normalized function used for σPE |
| σSEE | Stress in series elastic element (MPa) |
| σCE | Stress in contractile element (MPa) |
| σf | Total stress created in muscle (MPa) |
| Strain energy density function in rectus muscle (MPa) | |
| Strain energy function stored in the isotropic matrix (MPa) | |
| Strain energy function stored in the muscle fibers (MPa) | |
| UJ(J) | Strain energy function associated with the volume change (MPa) |
| UPE( | Energy stored in passive element (MPa) |
| Energy stored in series elastic element (MPa) | |
| ft(t) | Muscle activation function (MPa) |
| Muscle force-stretch function (MPa) | |
| Muscle force-velocity function (MPa) |
We used the following total strain energy density function for rectus EOM46,47,49:
| (2) |
where, is the strain energy function related to the isotropic matrix, and UJ(J) is the strain energy function related to volume change. The represents the first invariant of the right Cauchy–Green strain tensor, and λs are incompressible fiber and SEE stretch ratios, respectively. The J defines Jacobian of the deformation gradient (Table 2).
The first part of the strain energy is given by:
| (3) |
where b and c are the material parameters for the isotropic matrix (Table 3). Volumetric strain energy, which considers material compressibility has the form:
| (4) |
where D is the compressibility constant.
Table 3.
Mechanical and Physiological Muscle Parameters
| Parameter | Definition | MR | LR | |
|---|---|---|---|---|
| b | Material parameter for isotropic matrix | 15.2 | 15.2 | |
| c | Material parameter for isotropic matrix (MPa) | 0.1 × 10⁻³ | 0.1 × 10⁻³ | |
| σ0 | Maximum isometric stress (MPa) | 0.04 | 0.04 | |
| D | Compressibility constant (MPa−1) | 10 | 10 | |
| k | Length ratio SEE: CE | 0.3 | 0.3 | |
| α | Material constant in SEE | 10 | 10 | |
| β | Material constant in SEE (MPa) | 0.4 × 10⁻³ | 0.4 × 10⁻³ | |
| Minimum stretch rate (s−1) | −10 | −10 | ||
| kc | Shape parameter in force-velocity function | 5 | 5 | |
| ke | Shape parameter in force-velocity function | 5 | 5 | |
| d | Offset of the eccentric function | 1.5 | 1.5 | |
| t 0 | Activation time (s) | 0 | 0 | |
| t 1 | Deactivation time (s) | 0.4 | 0 | |
| S | Exponential factor in activation function | 100 | 100 | |
| A | Material parameter for stress in PE | 4 | 4 | |
| n 1 | Activation level before and after activation | 0.6 | 0 | |
| n 2 | Activation level during activation | 1 | 0 | |
| λopt | Optimal fiber stretch | 1.05 | 1.05 | |
| Initial normalized force within PE | 0 | 0.2 | ||
| m 1 | First component of unit vector along the muscle fiber direction | 0 | 0 | |
| Posterior | Anterior | |||
| m 2 | Second component of unit vector along the muscle fiber direction | 0.25 | 0.175 | −0.43 |
| m 3 | Third component of unit vector along the muscle fiber direction | −0.97 | 0.984 | 0.902 |
| Initial stretch for muscle | 0.02 | 1.03 | 1.01 | |
The second part of Equation (2) is associated with the strain energy of the EOM fibers as follows:
| (5) |
where UPE and USEE are the energy stored in the PE and SEE, respectively. The integral forms of UPE and USEE in terms of stresses, respectively, are:
| (6) |
and
| (7) |
σPE(λ) and σSEE(λ,λs) represent the stress in the PE and SEE, respectively. In Equation (6), time-dependent stress in the PE is expressed as:
| (8) |
where t and Δt are the time and time increment respectively. The σ0 is constant and expresses the maximum isometric stress in the EOM (see Table 3). The is a normalized function of .
| (9) |
A is a material parameter. The is equal to zero when the EOM undergoes shortening contraction, as EOM fibers cannot resist axial compressive loads.47
In Equation (7), σSEE can be obtained by:
| (10) |
where α and β are the material constants of the SEE determined from empirical data below (Fig. 3), and:
| (11) |
Figure 3.
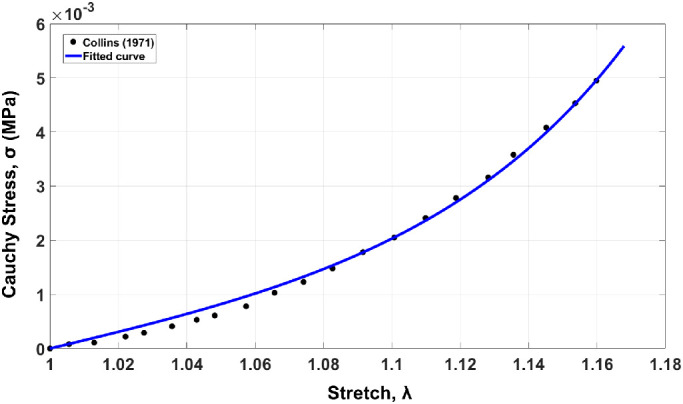
Stress-stretch curve of passive EOM loading. Dotted line represents data obtained experimentally53,54 and solid graph plots the equation for passive behavior including fibers.
It has been previously shown that the stress in CE is equal to the stress in the SEE at any time, .50 The stress in the CE is given by:
| (12) |
where ft(t) is EOM activation function given by Kojic et al.50:
| (13) |
where n1 is the level of activation before and after activation of the EOM, and n2 is the level during activation. The t0 is the beginning time of activation, and t1 is the time of deactivation. Function ht(ti,tj) is defined by:
| (14) |
where S is an exponential factor. The ti could be t or t1, and tj could be t0 or t1 in Equation (13).
The in Equation (12) is the EOM force-stretch function defined by47,51,52:
| (15) |
In Equation (15), λopt is constant and represents the optimal fiber stretch (Table 3).
The in Equation (12) is the EOM force-velocity function:
| (16) |
where variable is the stretch rate in CE, is the minimum stretch rate, kc and ke are the shape parameters, and d is the offset of the eccentric function.
Material constants b, c, α, and β have been obtained by fitting for the EOM the average stress-stretch curve53,54 and the constitutive equation for passive tensile behavior55 and using “cftool” function in MATLAB R2019a (MathWorks, Natick, MA, USA; see Fig. 3). Other mechanical and physiological muscle parameters in Table 3 were set to what we presume to be reasonable values, but by trial and error until plausible model behavior was achieved. There exist no data to do otherwise.
FEM Simulation
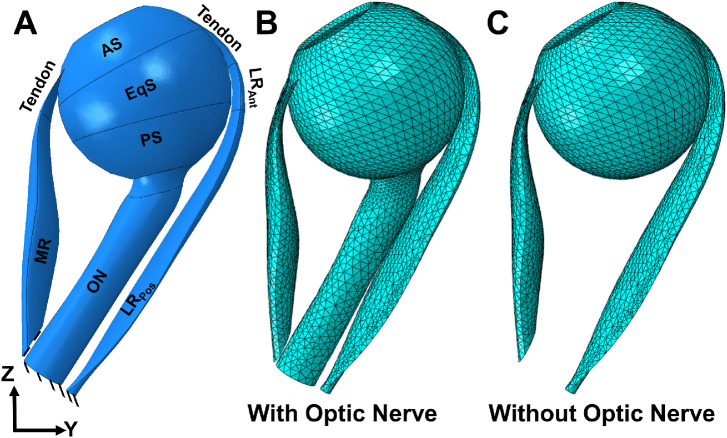
The 3-D geometry (see Fig. 1E) was transferred from SOLIDWORKS into Abaqus/Explicit (Fig. 4A). Because the model describing EOM behavior is based on 1-D fiber orientation, differing fiber orientations in the LR require that it be partitioned to two different regions, anterior LR (LRAnt) and posterior LR (LRPos), due to differing fiber orientations. As indicated in Table 3, (initial stretch for EOM), m2 (second component of unit vector along the EOM fiber direction), and m3 (third component of unit vector along the EOM fiber direction) are defined separately according to the stretch fraction and fiber direction within LRAnt and LRPos. Because the reference state is at 26 degrees adduction, pre-stretch is applied to the LR and MR whereas the normalized pre-force within PE, is only applied to the LR (see Table 3). It has been previously shown that at this angle of adduction, there is a very low active LR force that we considered negligible for additional adduction beyond 26 degrees.9,45 Active force was included in the MR to account for the 26 degrees of initial adducted position.
Figure 4.
Eye geometry in ABAQUS. (A) The reference state at 26 degrees adduction relative to central gaze. The MR has been partitioned into tendon and muscle. The LR has been partitioned into three parts: tendon, LRAnt, and LRPos. The sclera is partitioned into three parts: AS, EqS, and PS. Mesh distribution of the model with (B) and without (C) the optic nerve.
For quasi-static analysis, a mass scaling factor of 100 was used. The ratio of kinetic energy to internal energy for the whole model was minimized (less than 5%). To fix the center of the rotation of the eye as a deformable body, a kinetic coupling constraint was defined at the globe center. The origins of the LR and MR muscles are fixed as shown in Figure 4A. All elements in ABAQUS are defined as explicit element type, a 4-node linear tetrahedron (C3D4). The average optimized mesh size was set to be about 0.8 mm for EOMs and 0.6 mm near the optic disc, refined enough to obtain a consistent result. A mesh convergence test was done by using courser mesh sizes (1.5–2 times larger than the current mesh sizes) for EOMs, and there was only approximately 0.4% change in maximum principal strain. Further refinement of mesh sizes would increase the time cost dramatically. The complete model, including the mesh distribution, is shown in Figures 4B and 4C. The model assumed no external force boundary condition because the only force moving the eye is MR contraction. We simulated two situations: adduction from the 26 degrees reference state with a straight (tethered) ON (see Fig. 4B), and adduction omitting the ON and ONS (see Fig. 4C).
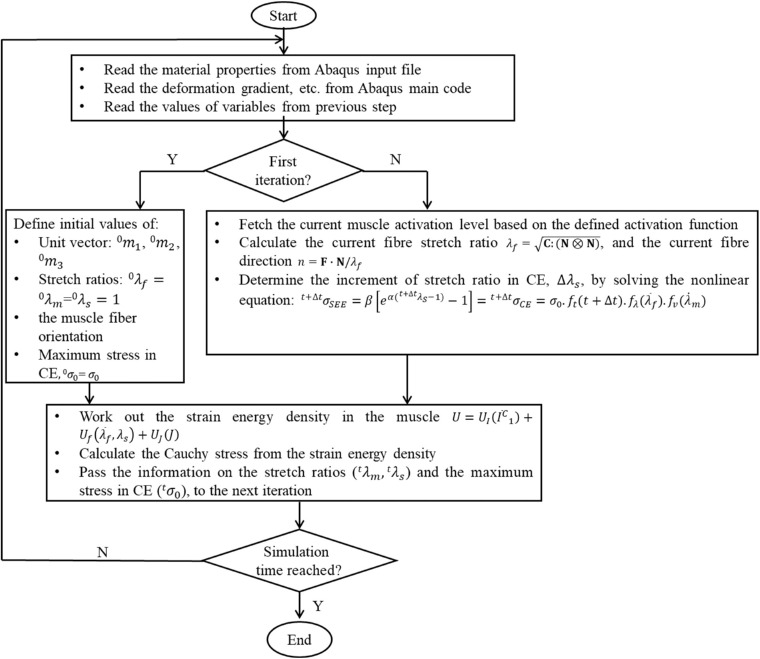
The active, fiber-reinforced hyperelastic behavior of skeletal muscle was implemented into Abaqus/Explicit using the user defined material model interface (VUMAT), as explained in the flowchart in Figure 5. In brief, the material properties, such as the maximal isometric stress and activation levels before and after contraction, etc. were read into the VUMAT. Then, in the first VUMAT iteration, initial values for the EOM fiber orientation, stretch ratios in SEE and CE, maximal stress in CE, etc. were defined.46,47 In subsequent iterations, values for present fiber orientation, present stretch ratios, etc. were updated. Afterward, EOM strain energy density was calculated and Cauchy stress at each Gauss point was computed from the strain energy density function. At the end of the VUMAT, the information needed for the next iteration, such as the stretch rates in SEE and CE, was passed back to Abaqus/Explicit as history variables. The VUMAT code was called throughout the entire FE simulation.
Figure 5.
Flowchart for the implementation of the skeletal muscle model in Abaqus/Explicit.
Results
Color maps of maximum principal strain (maximum effect [Emax]) during incremental adduction are presented in Figure 6 assuming presence (panels A and B) or absence (panels C and D) of the ON. At the reference state, there was 0.07 (7%) average maximum principal strain within the LR due to its initial stretching by MR active contraction. Figures 6B and 6D show the maximum principal strain map after completion of MR contraction. Under the same MR contraction level, the adduction in panel D where the existence of ON is ignored is more than 50% greater than that of panel B (10 degrees versus 6 degrees adduction). This is because in Figure 6B the ON resists adduction by stretching. Due to the greater adduction angle, the LR experiences greater strain at approximately 16% strain when there is no ON.
Figure 6.
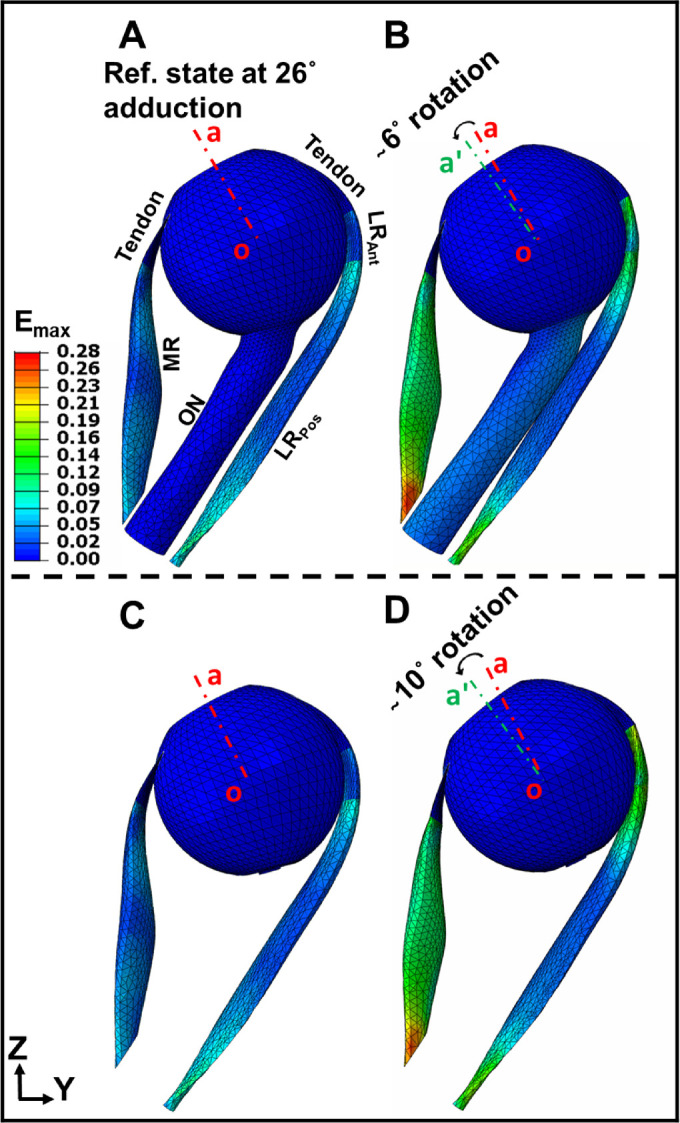
Color maps of maximum principal Lagrangian strain (maximum effect [Emax]) in MR and LR muscles assuming the presence or absence of the ON. (A) Maximum principal strain, Emax color map at reference state 26 degrees adduction at which the ON becomes completely straight. (B) Maximum principal strain, Emax within the muscles after 6 degrees adduction from the reference state. (C) Maximum principal strain, Emax at reference state when the ON is assumed absent. (D) Maximum principal strain, Emax after 10 degrees adduction from the reference state of panel C. The red and green dashed lines (oa and oaˊ) indicate orientation in reference and adducted states, respectively.
Similar behavior was observed for minimum principal strain (Emin) distribution within the EOMs (Fig. 7). The initial compressive strain along the fiber directions within the MR was set to be= −0.08 (Figs. 7A, 7C). The absolute value of Emin increased nonuniformly within the MR during adduction (Figs. 7B, 7D), as it was maximal at the middle of MR where its volume is greatest (max|Emin|≈ 22%). Comparing Figure 7D to Figure 7B, presence or absence of the ON was associated with no significant difference in minimum principal strains throughout the MR, although the adduction angle differs.
Figure 7.
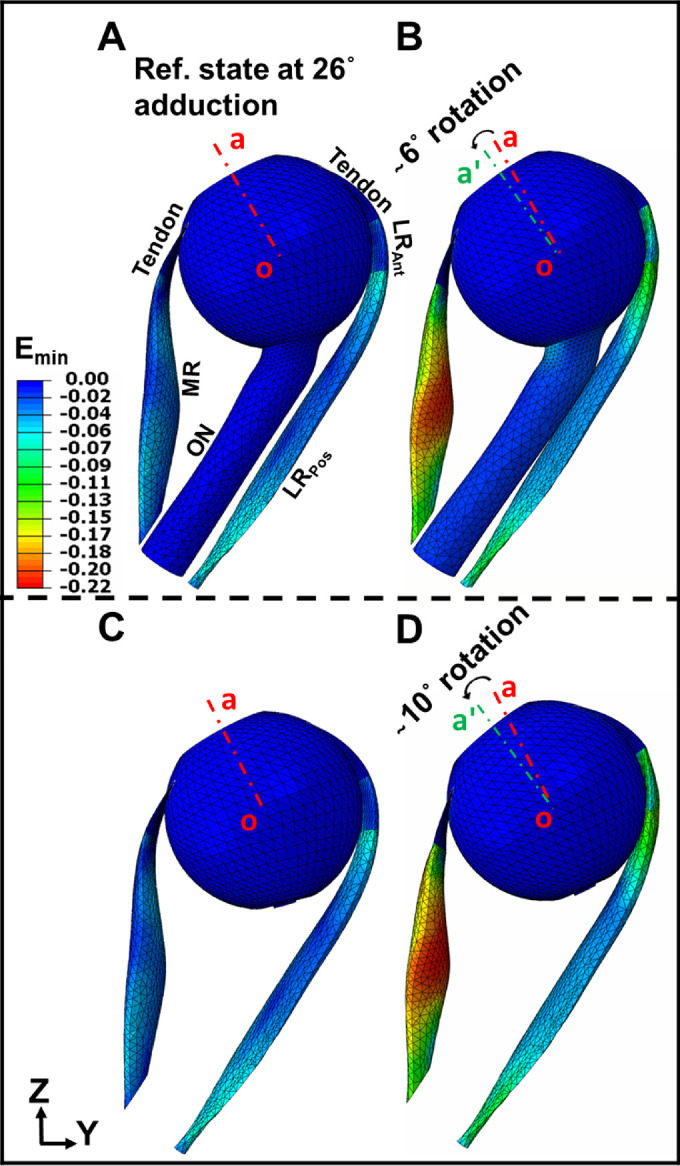
Principal Lagrangian strain distribution (minimum effect [Emin]) within MR and LR including ON, versus ignoring existence of the ON. (A) Minimum principal strain, Emin color map at reference state, 26 degrees adduction. (B) Minimum principal strain, Emin within the EOMs after 6 degrees additional adduction from panel A. (C) Minimum principal strain, Emin color map at reference state, 26 degrees adduction, omitting the ON. (D) Minimum principal strain, Emin within the EOMs after 10 degrees additional adduction from panel C. Red and green dashed lines (oa and oaˊ) indicate eye orientation in the reference and adducted state, respectively.
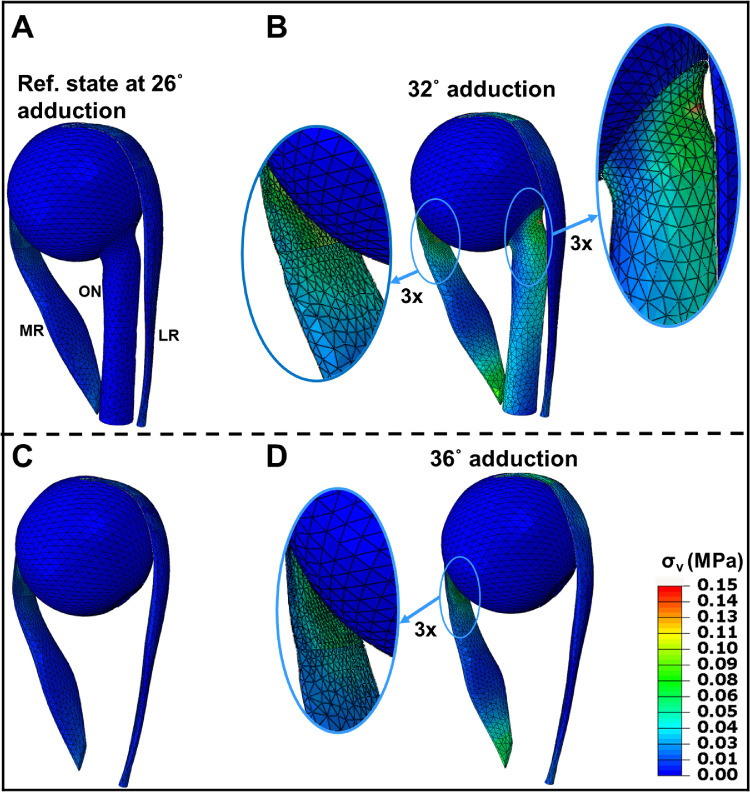
Principal strains Emax and Emin, occur roughly parallel, and perpendicular to the bulging direction of the MR, respectively (Fig. 6), but along and perpendicular to the fiber direction of the LR, respectively (Fig. 7). Tendon and ONS are stiffer than the rectus EOMs, so the strain in these passive tissues is much lower than within EOMs. Figure 8 shows von Mises stress distribution σν with and without the ON, at 32 degrees and 36 degrees adduction.
Figure 8.
Simulated von Mises stress, σν (MPa) with and without consideration of the ON. (A–C) Reference state at 26 degrees adduction at which the ON becomes completely straight. B Stress after 6 degrees adduction from reference state. C ON assumed absent in the reference state. (D) Stress after 10 degrees adduction from the reference state without the ON. Insets magnify muscle and ON insertions.
In the 26 degrees adducted reference state (Figs. 8A, 8C), stress is greatest within tendons due to initial MR contraction force and compressive strain. Regardless of edge effect, maximum stress is observed within the MR myotendinous junction after maximal adduction. The material discontinuity between EOM and stiff tendon concentrates high stress (approximately 80 kPa) across the myotendinous junction (magnified insets in Figs. 8B, 8D). During adduction, stress is concentrated in the ONS at its junction with the PS (magnified inset in Fig. 8B). The straight ON adds to LR elasticity as a load against adduction, which decreases the rotational angle for the same MR contraction and concentrates stress on the posterior globe. The LR is fully relaxed during the large adduction as it develops no active contraction.
Figure 9 illustrates the maximum (Emax) and minimum (Emin) principal strains, and von Mises stress distributions at 32 degrees adduction. Figure 9A represents a 3-D view of the eye at the reference state of 26 degrees adduction. The region in the red square in Figure 9A is magnified 9-fold (Figs. 9B–D). As shown in Figure 9B, Emax is significantly distributed within the PPS, LC, and ONS where the tissue undergoes stretching. Maximum principal strain reached 6% within ONS, 4% within ON, 8% within LC, and 10% within PPS. As shown in Figure 9C, Emin has its highest absolute value within the optic disc, LC, and nasal PPS, with 7% average magnitude. At 32 degrees adduction, stress was significantly concentrated within the LC (approximately 350 kPa) and at the globe-ON junction (approximately 150 kPa), as seen in Figure 9D.
Figure 9.
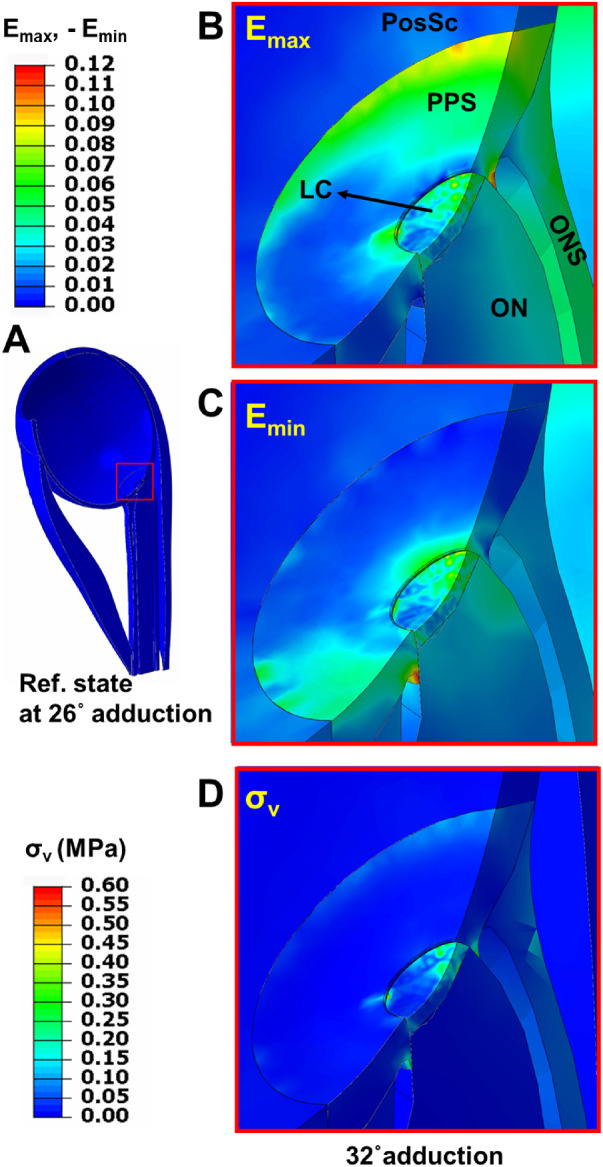
Color map of maximum and minimum principal strains, and von Mises stress within the posterior eye after 6 degrees incremental adduction from initial threshold optic nerve tethering at 26 degrees. (A) Reference state at 26 degrees adduction. Region within red square in panel A is magnified 9 × in panels B, C, and D to illustrate effects of 6 degrees further adduction. (B) Maximum principal strain (maximum effect [Emax]). (C) Minimum principal strain (minimum effect [Emin]). (D) von Mises stress (σν) after 6 degrees further adduction.
A check on the reasonability of the simulation was obtained by computing force within the MR fibers at completion of the MR activation. Figure 10 is a force-angle graph during adduction for the MR with the ON present, using units of gram-force for comparison with the empirical literature. Force in the MR increased from 10 gm at 26 degrees adduction to approximately 28 gm at 32 degrees adduction.
Figure 10.
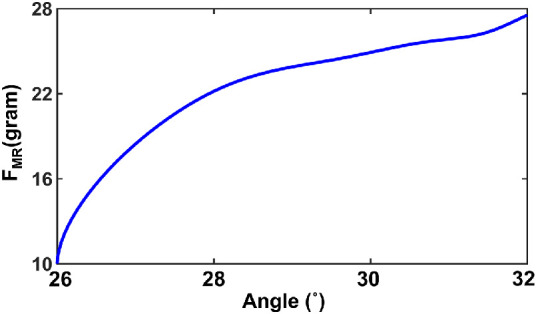
Force-angle relationship for the MR muscle FMR assuming presence of the optic nerve.
Discussion
We developed a quasi-static FEM of the human eye and horizontal rectus EOMs during incremental adduction from 26 degrees achieved by active EOM contraction, ultimately reacting 32 degrees with the ON realistically included, but 36 degrees with the effect of the ON neglected. This EOM contraction was implemented in a physiologically realistic manner, using experimentally observed twitch contraction properties of EOM rather than approximations by thermal contraction or shortening by an assumed length change. Under the same MR contraction level, the adduction angle was predicted to be substantially greater in the absence of the ON. Because the model predicted total MR tension to be a physiologically plausible 28 gm at the end of activation for either assumed condition, it can be concluded that the lesser adduction in the presence of the ON is due to its mechanical loading in opposition to the MR. The present FEM has thus answered a challenge issued at the time of the discovery in 2016 that the ON becomes tethered in adduction angles far short of the approximately 40 degrees limit3,29,45,56 of the oculomotor range, a challenge to quantitatively model the effect of the ON as a mechanical load on ocular duction.14 Experimental studies have since reported that ON tethering in large adduction translates the globe mediolaterally in healthy people but retracts it in POAG,19,20 particularly in Asians,19 stretches the normal but not glaucomatous ON,16 deforms the optic disc,15,21 and compresses the choroid.57 The current approach marks a crucial step toward a fully realistic, homeomorphic model of ocular rotation capable of accurately simulating the mechanical states of all tissues influenced by eye movement, particularly the visually critical structures, such as the ON itself.
The current approach modeled the initial states of the LR and MR EOMs based on detailed anatomy characterized by MRI. The FEM was thus able to simulate the inhomogeneous strain distribution within these rectus EOMs, with the MR not only shortening along its predominant fiber direction, but also bulging due to its contraction. Thus, during adduction the maximum principal strain, Emax reached 17% in the radial direction for the MR, while reaching 15% in LR along the fiber direction. Qualitatively, the results concord with typical MRI findings demonstrating increase in the cross section of contracting human EOMs.58 The highest absolute value of minimum principal strain occurred in the middle of the MR for both 32 degrees and 36 degrees adduction. The absolute value of minimum principal strain at maximal adduction, Emin was approximately 22% and occurred in the middle of the MR.
The current study simulated the 3-D structure of contracting and relaxing EOMs, as well as their stress and strain distributions. MRI scans show the 3-D change of EOM shape and volume due to different gaze positions but cannot directly demonstrate spatial variation of stress and strain internally.58,59 Unidimensional passive and active length-tension models have been obtained for animal and human rectus EOM.3,9,45,56 However, large local 3-D stress and strain may influence the EOM behavior are important to calculate.
Large adduction concentrates stress both on the posterior globe at the ON attachment, as well as at the MR insertion. At 32 degrees adduction, the FEM predicted von Misses stress reaching 150 kPa within the ONS and 350 kPa within the LC. The current FEM predicted that adduction may produce up to 3% strain in the horizontal rectus tendons, which is consistent with suggestions about EOM tendon strain.10
Stress on the posterior eye has been postulated as a possible cause of ON damage,14–17,19–21,25 although greater strain on posterior ocular tissues observed in healthy young eyes argues that mechanical deformations are not necessarily damaging when tissues are compliant.60 The current FEM suggests that during only 6 degrees incremental adduction beyond the threshold of ON tethering, maximum principal strain can reach 6% in the ONS, 4% in the ON, 8% in the LC, and 10% within PPS. The absolute value of minimum principal strain for ON, LC, and PPS reached an average of 7%. This is comparable to, but slightly larger than, the 4% elongation of the ON observed in healthy older adults during 6 degrees incremental adduction starting at about 26 degrees.16 The present model avoided the potentially confounding phenomenon of change in ON path during adduction, because it assumed that the ON had been initially tethered straight by 26 degrees adduction. This situation simplified induced strain within the ON to simple length elongation and change in regular cross section. In contrast, the FEM of Wang et al. assumed a sinuous ON in central gaze but predicted as much as 13% strain in the peripapillary region caused by only 13 degrees rotation from that central position.61 However, at less than the approximately 26 degrees threshold of adduction tethering,14,16 posterior ocular strain caused by smaller horizontal duction would presumably be due, not to ON elongation, but to bending stiffness of the sinuous ON and resistance of the surrounding orbital tissues, and only minimally by ON tensile stiffness. Although some data are available about the properties of orbital fat and connective tissues,62 their specific interactions with the ON very likely depend on their fine anatomic structure in the immediate vicinity, which are unlikely to be homogeneous throughout the orbit as typically assumed.
The current FEM can be used to evaluate adduction-related stress and strain in any part of the eye, including the sclera at the horizontal rectus insertions as seen in Figures 8B and 8D. However, because characterization of local mechanical loading on regions of the anterior sclera was not a major question for the current study, this region was only coarsely meshed in the interest of computational efficiency. Future investigations directed toward this question could simply increase the mesh density of the anterior sclera or any other ocular region of particular interest, without other changes in the current FEM.
In this paper, the contraction of human-shaped rectus EOMs was simulated by using a quasi-static skeletal muscle model46,47,49,63 in the FEM environment of Abaqus/explicit. Other investigators have used properties of non-EOM striated muscle to represent EOMs as simple strings10,11,31 without internal stress or strain distributions. Schutte et al. described a 3-D FEM in which linearly elastic rectus EOMs were made to contract thermally,12 rather than physiologically, over a limited range. Another FEM of EOMs did use more physiologic contraction but did not use anatomically realistic 3-D EOM shape.13
The simulations obtained from this study provide quantitative ocular adduction under physiologic MR active contraction, with and without a straight ON, and so represent resulting stress and strain distributions in different parts of the eye and ON. The range of MR force created during the rotation of the eye from 26 degrees to 32 degrees to 36 degrees adduction is consistent with experimental force measurements, which have typically been reported in units of gram force.2,3,13,28,45,56 For this FEM, it was necessary to assume many constants and parameters describing the internal contractile behavior of EOM. However, the exact values of these constants and parameters are not important in themselves to EOM loading of other orbital structures, as long as overall EOM shape and force generation are consistent with known anatomy and physiology, as is the case.
This FEM analysis was intended mainly to demonstrate the novel ability to implement active internal force in an EOM using physiologically reasonable behavior, but was not aimed to achieve a comprehensive model of the entire orbital ocular motor apparatus. The model therefore has limitations created by deliberate simplifications facilitating computational efficiency, or due to unavailability of sufficient data on the orbital suspensory system of the globe, among other things. The vertical rectus and oblique EOMs, which have minor secondary or tertiary effects on adduction, have been omitted entirely. Inclusion of these cyclovertical EOMs would likely change the forces in the MR, and distribution of forces exerted on the sclera. The globe center was assumed to be fixed so as to prohibit translational movement. Relaxation of this assumption will require detailed modeling of the globe's complex, gimbal-like connective tissue suspension system. Orbital connective tissues, including the rectus pulleys, are key factors to balance retracting forces of the EOMs on the eye and control the direction of the globe rotation.6,38,39 Furthermore, viscous orbital fat probably has a role in supporting the eye12,13,61 and controlling EOM paths.12,13 It should ultimately be possible to elaborate the FEM to include both of these factors to further improve the realism of simulations. Nevertheless, the novel method reported here for implementing physiological EOM contraction constitutes a significant advance in modeling of ocular motility.
Acknowledgments
Supported by National Eye Institute EY008313 and Research to Prevent Blindness.
Disclosure: S. Jafari, None; Y. Lu, None; J. Park, None; J.L. Demer, None
References
- 1. Robinson DA. The use of control-systems analysis in the neurophysiology of eye-movements. Annu Rev Neurosci. 1981; 4: 463–503. [DOI] [PubMed] [Google Scholar]
- 2. Miller JM, Robinson DA. A model of the mechanics of binocular alignment. Comput Biomed Res. 1984; 17: 436–470. [DOI] [PubMed] [Google Scholar]
- 3. Robinson DA. A quantitative analysis of extraocular muscle cooperation and squint. Invest Ophthalmol. 1975; 14: 801–825. [PubMed] [Google Scholar]
- 4. Demer JL, Clark RA, da Silva Costa RM, Kung J, Yoo L. Expanding repertoire in the oculomotor periphery: selective compartmental function in rectus extraocular muscles. Ann N Y Acad Sci. 2011; 1233: 8–16. [DOI] [PMC free article] [PubMed] [Google Scholar]
- 5. Demer JL. Compartmentalization of extraocular muscle function. Eye (Lond). 2015; 29: 157–162. [DOI] [PMC free article] [PubMed] [Google Scholar]
- 6. Demer JL. Pivotal role of orbital connective tissues in binocular alignment and strabismus: the Friedenwald lecture. Invest Ophthalmol Vis Sci. 2004; 45: 729–738; 728. [DOI] [PubMed] [Google Scholar]
- 7. Miller JM, Pavlovski DS, Shaemeva I. Orbit 1.8 Gaze Mechanics Simulation. San Francisco, CA: Eidactics; 1999. [Google Scholar]
- 8. Haslwanter T, Buchberger M, Kaltofen T, Hoerantner R, Priglinger S. SEE++: a biomechanical model of the oculomotor plant. Ann N Y Acad Sci. 2005; 1039: 9–14. [DOI] [PubMed] [Google Scholar]
- 9. Clark MR, Stark L. Control of human eye movements: I. Modelling of extraocular muscle. Mathematical Biosciences. 1974; 20: 191–211. [Google Scholar]
- 10. Simonsz HJ, Spekreijse H. Robinson's computerized strabismus model comes of age. Strabismus. 1996; 4: 25–40. [DOI] [PubMed] [Google Scholar]
- 11. Wei Q, Sueda S, Pai DK. Physically-based modeling and simulation of extraocular muscles. Prog Biophys Mol Biol. 2010; 103: 273–283. [DOI] [PMC free article] [PubMed] [Google Scholar]
- 12. Schutte S, van den Bedem SP, van Keulen F, van der Helm FC, Simonsz HJ. A finite-element analysis model of orbital biomechanics. Vision Res. 2006; 46: 1724–1731. [DOI] [PubMed] [Google Scholar]
- 13. Karami A, Eghtesad M, Haghpanah SA. Prediction of muscle activation for an eye movement with finite element modeling. Comput Biol Med. 2017; 89: 368–378. [DOI] [PubMed] [Google Scholar]
- 14. Demer JL. Optic nerve sheath as a novel mechanical load on the globe in ocular duction. Invest Ophth Vis Sci. 2016; 57: 1826–1838. [DOI] [PMC free article] [PubMed] [Google Scholar]
- 15. Suh SY, Le A, Shin A, Park J, Demer JL. Progressive deformation of the optic nerve head and peripapillary structures by graded horizontal duction. Invest Ophthalmol Vis Sci. 2017; 58: 5015–5021. [DOI] [PMC free article] [PubMed] [Google Scholar]
- 16. Clark RA, Suh SY, Caprioli J, et al.. Adduction-induced strain on the optic nerve in primary open angle glaucoma at normal intraocular pressure [published online ahead of print September 11, 2020]. Curr Eye Res, 10.1080/02713683.2020.1817491. [DOI] [PMC free article] [PubMed] [Google Scholar]
- 17. Suh SY, Clark RA, Demer JL. Optic nerve sheath tethering in adduction occurs in esotropia and hypertropia, but not in exotropia. Invest Ophthalmol Vis Sci. 2018; 59: 2899–2904. [DOI] [PMC free article] [PubMed] [Google Scholar]
- 18. Demer JL, Clark RA.. Translation and eccentric rotation in ocular motor modeling. Prog Brain Res. 2019; 248: 117–126. [DOI] [PMC free article] [PubMed] [Google Scholar]
- 19. Demer JL, Clark RA, Suh SY, et al.. Optic nerve traction during adduction in open angle glaucoma with normal versus elevated intraocular pressure. Curr Eye Res. 2020; 45: 199–210. [DOI] [PMC free article] [PubMed] [Google Scholar]
- 20. Demer JL, Clark RA, Suh SY, et al.. Magnetic resonance imaging of optic nerve traction during adduction in primary open-angle glaucoma with normal intraocular pressure. Invest Ophthalmol Vis Sci. 2017; 58: 4114–4125. [DOI] [PMC free article] [PubMed] [Google Scholar]
- 21. Chang MY, Shin A, Park J, et al.. Deformation of optic nerve head and peripapillary tissues by horizontal duction. Am J Ophthalmol. 2017; 174: 85–94. [DOI] [PMC free article] [PubMed] [Google Scholar]
- 22. Sibony PA. Gaze evoked deformations of the peripapillary retina in papilledema and ischemic optic neuropathy. Invest Ophthalmol Vis Sci. 2016; 57: 4979–4987. [DOI] [PubMed] [Google Scholar]
- 23. Sibony PA, Hou W.. Adduction-induced deformations evoke peripapillary folds in papilledema. Ophthalmology. 2019; 126: 912–914. [DOI] [PubMed] [Google Scholar]
- 24. Wang X, Fisher LK, Milea D, Jonas JB, Girard MJ. Predictions of optic nerve traction forces and peripapillary tissue stresses following horizontal eye movements. Invest Ophthalmol Vis Sci. 2017; 58: 2044–2053. [DOI] [PubMed] [Google Scholar]
- 25. Shin A, Yoo L, Park J, Demer JL. Finite element biomechanics of optic nerve sheath traction in adduction. J Biomech Eng. 2017; 139: 101010. [DOI] [PMC free article] [PubMed] [Google Scholar]
- 26. Demer JL, Clark RA, Kono R, Wright W, Velez F, Rosenbaum AL. A 12-year, prospective study of extraocular muscle imaging in complex strabismus. J AAPOS. 2002; 6: 337–347. [DOI] [PubMed] [Google Scholar]
- 27. Demer JL, Dushyanth A.. T2-weighted fast spin-echo magnetic resonance imaging of extraocular muscles. J AAPOS. 2011; 15: 17–23. [DOI] [PMC free article] [PubMed] [Google Scholar]
- 28. Collins CC, O'Meara D, Scott AB. Muscle tension during unrestrained human eye movements. J Physiol. 1975; 245: 351–369. [DOI] [PMC free article] [PubMed] [Google Scholar]
- 29. Collins CC, Carlson MR, Scott AB, Jampolsky A. Extraocular muscle forces in normal human subjects. Invest Ophthalmol Vis Sci. 1981; 20: 652–664. [PubMed] [Google Scholar]
- 30. Shin A, Yoo L, Chaudhuri Z, Demer JL. Independent passive mechanical behavior of bovine extraocular muscle compartments. Invest Ophthalmol Vis Sci. 2012; 53: 8414–8423. [DOI] [PMC free article] [PubMed] [Google Scholar]
- 31. Li Y, Wei Q, Le A, Gawargious BA, Demer JL. Rectus extraocular muscle paths and staphylomata in high myopia. Am J Ophthalmol. 2019; 201: 37–45. [DOI] [PMC free article] [PubMed] [Google Scholar]
- 32. Ohno-Matsui K, Akiba M, Modegi T, et al.. Association between shape of sclera and myopic retinochoroidal lesions in patients with pathologic myopia. Invest Ophthalmol Vis Sci. 2012; 53: 6046–6061. [DOI] [PubMed] [Google Scholar]
- 33. Norman RE, Flanagan JG, Rausch SM, et al.. Dimensions of the human sclera: thickness measurement and regional changes with axial length. Exp Eye Res. 2010; 90: 277–284. [DOI] [PubMed] [Google Scholar]
- 34. Vurgese S, Panda-Jonas S, Jonas JB. Scleral thickness in human eyes. PLoS One. 2012; 7: e29692. [DOI] [PMC free article] [PubMed] [Google Scholar]
- 35. Girkin CA, Fazio MA, Yang H, et al.. Variation in the three-dimensional histomorphometry of the normal human optic nerve head with age and race: lamina cribrosa and peripapillary scleral thickness and position. Invest Ophthalmol Vis Sci. 2017; 58: 3759–3769. [DOI] [PMC free article] [PubMed] [Google Scholar]
- 36. Elkington AR, Inman CB, Steart PV, Weller RO. The structure of the lamina cribrosa of the human eye: an immunocytochemical and electron microscopical study. Eye (Lond). 1990; 4(Pt 1): 42–57. [DOI] [PubMed] [Google Scholar]
- 37. Quigley HA, Addicks EM.. Regional differences in the structure of the lamina cribrosa and their relation to glaucomatous optic nerve damage. Arch Ophthalmol. 1981; 99: 137–143. [DOI] [PubMed] [Google Scholar]
- 38. Clark RA, Miller JM, Demer JL. Three-dimensional location of human rectus pulleys by path inflections in secondary gaze positions. Invest Ophthalmol Vis Sci. 2000; 41: 3787–3797. [PubMed] [Google Scholar]
- 39. Kono R, Clark RA, Demer JL. Active pulleys: magnetic resonance imaging of rectus muscle paths in tertiary gazes. Invest Ophthalmol Vis Sci. 2002; 43: 2179–2188. [PubMed] [Google Scholar]
- 40. Apt L, Call NB.. An anatomical reevaluation of rectus muscle insertions. Ophthalmic Surg. 1982; 13: 108–112. [PubMed] [Google Scholar]
- 41. Park J, Shin A, Demer JL. Sensitivity of mechanical strain in human peripapillary region to adduction tethering evaluated by hyperelastic characterization and finite element analysis (FEA). ARVO Abstracts #2029, 2018.
- 42. Spoerl E, Boehm AG, Pillunat LE. The influence of various substances on the biomechanical behavior of lamina cribrosa and peripapillary sclera. Invest Ophthalmol Vis Sci. 2005; 46: 1286–1290. [DOI] [PubMed] [Google Scholar]
- 43. Braunsmann C, Hammer CM, Rheinlaender J, Kruse FE, Schaffer TE, Schlotzer-Schrehardt U. Evaluation of lamina cribrosa and peripapillary sclera stiffness in pseudoexfoliation and normal eyes by atomic force microscopy. Invest Ophthalmol Vis Sci. 2012; 53: 2960–2967. [DOI] [PubMed] [Google Scholar]
- 44. Karim S, Clark RA, Poukens V, Demer JL. Demonstration of systematic variation in human intraorbital optic nerve size by quantitative magnetic resonance imaging and histology. Invest Ophthalmol Vis Sci. 2004; 45: 1047–1051. [DOI] [PubMed] [Google Scholar]
- 45. Robinson DA, O'Meara DM, Scott AB, Collins CC. Mechanical components of human eye movements. J Appl Physiol. 1969; 26: 548–553. [DOI] [PubMed] [Google Scholar]
- 46. Lu YT, Zhu HX, Richmond S, Middleton J. Modelling skeletal muscle fibre orientation arrangement. Comput Methods Biomech Biomed Engin. 2011; 14: 1079–1088. [DOI] [PubMed] [Google Scholar]
- 47. Lu Y. Soft tissue modelling and facial movement simulation using the finite element method. Doctoral Dissertation, Schools of Engineering and Dentistry, Cardiff University, United Kingdom, 2010, http://orca.cf.ac.uk/id/eprint/54369. [Google Scholar]
- 48. Hill AV. The heat of shortening and the dynamic constants of muscle. Proc R Soc Ser B-Bio. 1938; 126: 136–195. [Google Scholar]
- 49. Tang CY, Zhang G, Tsui CP. A 3D skeletal muscle model coupled with active contraction of muscle fibres and hyperelastic behaviour. J Biomech. 2009; 42: 865–872. [DOI] [PubMed] [Google Scholar]
- 50. Kojic M, Mijailovic S, Zdravkovic N. Modelling of muscle behaviour by the finite element method using Hill's three‐element model. Int J Numer Methods Eng. 1998; 43: 941–953. [Google Scholar]
- 51. Bol M, Reese S.. Micromechanical modelling of skeletal muscles based on the finite element method. Comput Methods Biomech Biomed Engin. 2008; 11: 489–504. [DOI] [PubMed] [Google Scholar]
- 52. Blemker SS, Pinsky PM, Delp SL. A 3D model of muscle reveals the causes of nonuniform strains in the biceps brachii. Jf Biomechanics. 2005; 38: 657–665. [DOI] [PubMed] [Google Scholar]
- 53. Gao Z, Guo H, Chen W. Initial tension of the human extraocular muscles in the primary eye position. J Theor Biol. 2014; 353: 78–83. [DOI] [PubMed] [Google Scholar]
- 54. Collins CC. Orbital mechanics. In: Bach-Y-Rita P, Collins C, Hyde JE, eds. The Control of Eye Movements. New York: Academic Press; 1971: 283––325. [Google Scholar]
- 55. Humphrey JD, Yin FC.. On constitutive relations and finite deformations of passive cardiac tissue: I. A pseudostrain-energy function. J Biomech Eng. 1987; 109: 298–304. [DOI] [PubMed] [Google Scholar]
- 56. Robinson DA. The mechanics of human saccadic eye movement. J Physiol. 1964; 174: 245–264. [DOI] [PMC free article] [PubMed] [Google Scholar]
- 57. Chen JY, Le A, De Andrade LM, Goseki T, Demer JL. Compression of the choroid by horizontal duction. Invest Ophthalmol Vis Sci. 2019; 60: 4285–4291. [DOI] [PubMed] [Google Scholar]
- 58. Clark RA, Demer JL.. Functional morphometry of horizontal rectus extraocular muscles during horizontal ocular duction. Invest Ophthalmol Vis Sci. 2012; 53: 7375–7379. [DOI] [PMC free article] [PubMed] [Google Scholar]
- 59. Clark RA, Demer JL.. Changes in extraocular muscle volume during ocular duction. Invest Ophthalmol Vis Sci. 2016; 57: 1106–1111. [DOI] [PMC free article] [PubMed] [Google Scholar]
- 60. Le A, Chen J, Lesgart M, Gawargious BA, Suh SY, Demer JL. Age-dependent deformation of the optic nerve head and peripapillary retina by horizontal duction. Am J Ophthalmol. 2020; 209: 107–116. [DOI] [PMC free article] [PubMed] [Google Scholar]
- 61. Wang X, Rumpel H, Lim WE, et al.. Finite element analysis predicts large optic nerve head strains during horizontal eye movements. Invest Ophthalmol Vis Sci. 2016; 57: 2452–2462. [DOI] [PubMed] [Google Scholar]
- 62. Yoo L, Kim H, Gupta V, Demer JL. Quasilinear viscoelastic behavior of bovine extraocular muscle tissue. Invest Ophthalmol Vis Sci. 2009; 50: 3721–3728. [DOI] [PMC free article] [PubMed] [Google Scholar]
- 63. Lu YT, Zhu HX, Richmond S, Middleton J. A visco-hyperelastic model for skeletal muscle tissue under high strain rates. J Biomech. 2010; 43: 2629–2632. [DOI] [PubMed] [Google Scholar]


