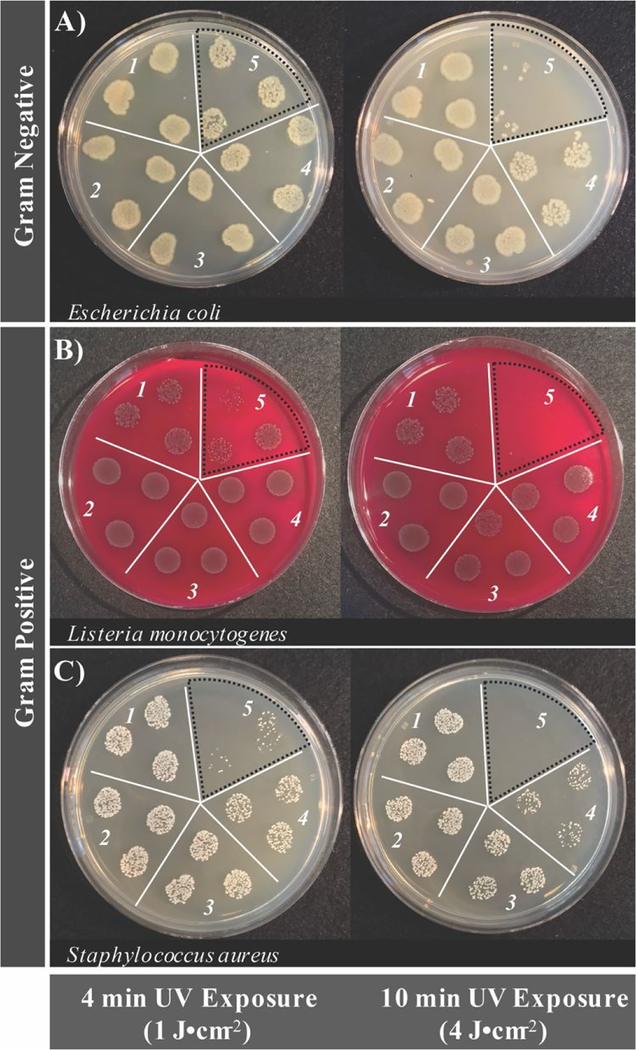
Figure 4.
Real-color photographs of bacterial growth inhibition from photosensitization of brominated carbon nanodots as a function of different exposure energy densities (pH 3.2 ± 0.2, λexposure = 365 nm, 3 mW). Strains tested include A) Escherichia coli, B) Listeria monocytogenes, and C) Staphylococcus aureus. Labels correspond to the following conditions: 1) DI water only, 2) HBr control with no UV exposure, 3) HBr control with UV exposure, 4) brominated carbon nanodots with no UV exposure, and 5) brominated carbon nanodots with UV exposure. Note: concentrations of brominated carbon nanodots are variable between bacterial strains. Bromine dot photosensitized sections are indicated by a black dotted line.

