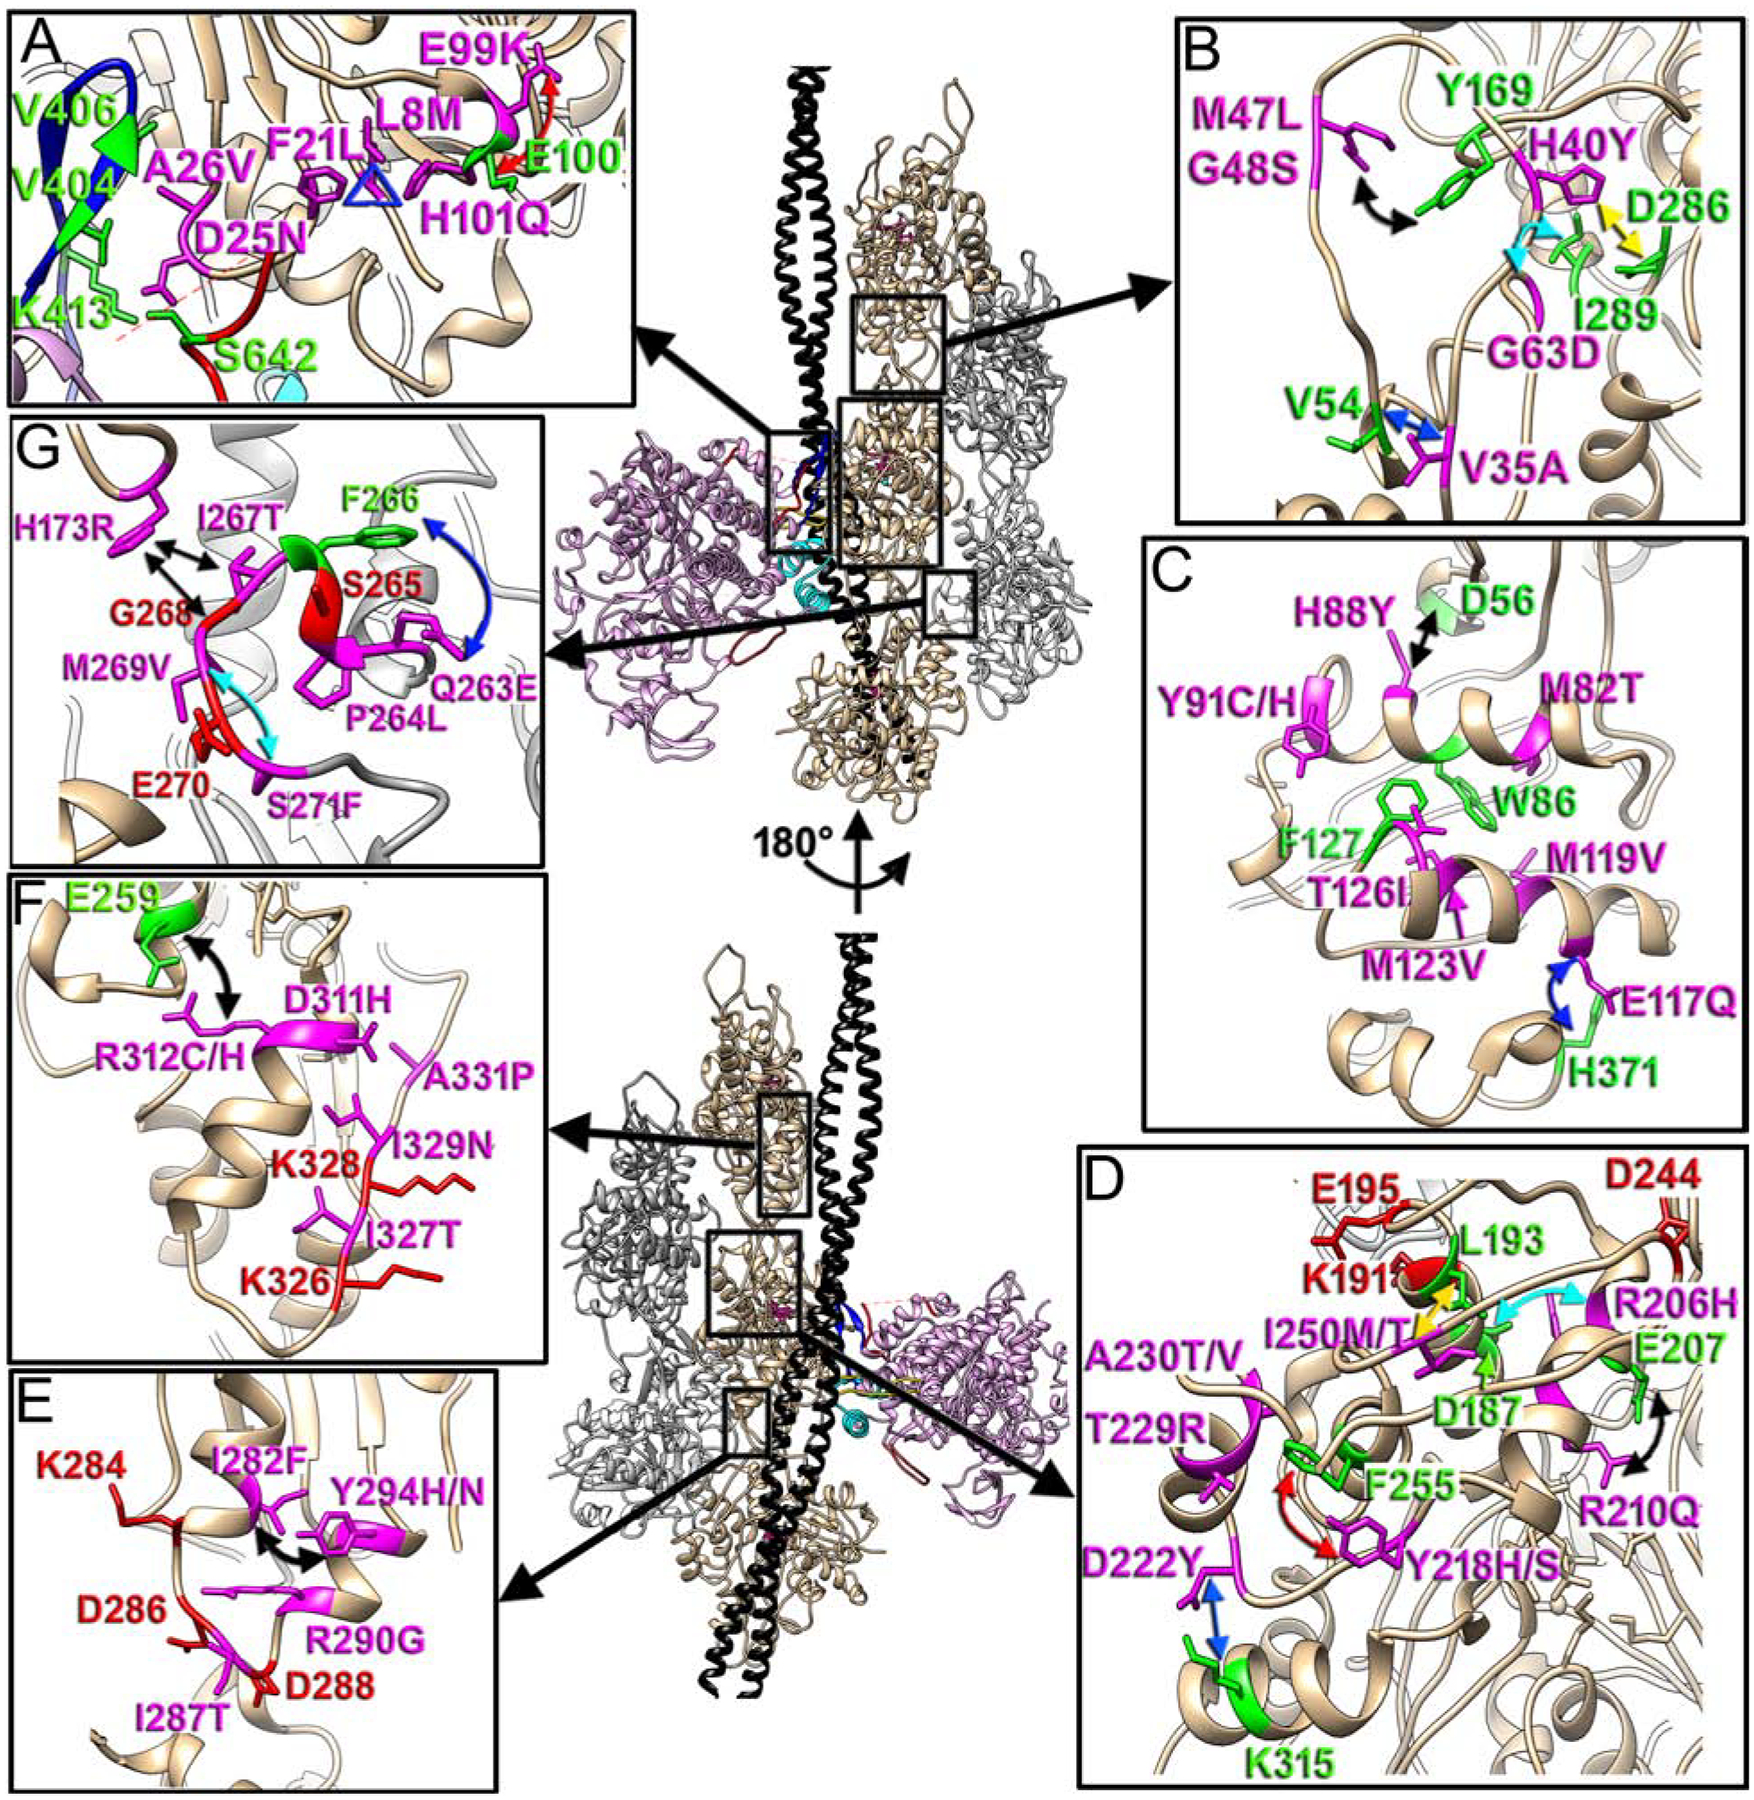
Fig. 4. Actin pathological variants.

Positioning of the seven actin regions that harbor actin missense mutations linked to cardiomyopathies is shown with black boxes on our model and is linked to the inserts as follows: actomyosin interface with CM loop and loop 2 (A), D-loop in SD2 of actin (B), two major helixes (78–92 and 112–126) in SD1 of actin (C), upper part of SD4 of actin (D), lower portion of SD3 of actin (E), Tm binding interface (F), and hydrophobic plug (HP) (G). Actin molecules in the two strands are either tan or grey, tropomyosin is black, while myosin is plum. The two views of the model are related by 180° rotation around actin helical axis. Actin pathogenic variants are in magenta, while their interacting partners are in green. The proposed interactions are marked with colored arrows.
