

Abstract
Sounds we hear in our daily life contain changes in the acoustic features (e.g., frequency, intensity, and duration or “what” information) and/or changes in location (“where” information). The purpose of this study was to examine the cortical auditory evoked potentials (CAEPs) to the change within a stimulus, the acoustic change complex (ACC), in frequency (F) and location (L) of the sound in normal hearing listeners.
Fifteen right-handed young normal hearing listeners participated in the electroencephalographic (EEG) recordings. The acoustic stimuli were pure tones (base frequency at 250 Hz) of 1 sec, with a perceivable change either in location (L, 180°), frequency (F, 5% and 50%), or both location and frequency (L+F) in the middle of the tone. Additionally, the 250 Hz tone of 1 sec without any change was used as a reference. The participants were asked to listen passively to the stimuli and not to move their heads during the testing. Compared to the reference tone, by which only the onset-CAEP was elicited, the tones containing changes (L, F, or L+F) elicited both onset-CAEP and the ACC. The waveform analysis of ACCs from the vertex electrode (electrode Cz) showed that, larger sound changes evoked larger peak amplitudes [e.g., (L+50%F)- > L-change; (L+50%F)- > 5%F-change] and shorter the peak latencies ([(L+5%F)- < 5%F-change; 50%F- < 5%F-change; (L+50%F)- < 5%F-change]. The current density patterns for the ACC N1’ peak displayed some differences between L-change vs. F-change, supporting different cortical processing for “where” and “what” information of the sound; regardless of the nature of the sound change, larger changes evoked a stronger activation than smaller changes [e.g., L- > 5%F-change; (L+5%F)- > 5%F-change; 50%F- > 5%F-change] in frontal lobe regions including the cingulate gyrus, medial frontal gyrus (MFG), superior frontal gyrus (SFG), the limbic lobe cingulate gyrus, and the parietal lobe postcentral gyrus. The results suggested that sound change-detection involves memory-based acoustic comparison (the neural encoding for the sound change vs. neural encoding for the pre-change stimulus stored in memory) and involuntary attention switch.
Keywords: Frequency change, Location change, Electroencephalograph, Cortical auditory evoked potential, Change detection
1. Introduction
Sounds we hear in daily life contain dynamic changes in the spectrotemporal contents from the same or different sound sources/locations. The cortical processing of sound changes in “what” (sound feature changes) and “where” (location changes) dimensions is critical for auditory scene analysis, a process we use to identify sound source and separate a sound from background noise (Bidelman, 2015; Boubenec et al., 2016; Jaunmahomed and Chait, 2012; Lewald et al., 2016; Lewald et al., 2018; Shiell et al., 2018; Sohoglu and Chait, 2016; Sussman et al, 2014; Symonds et al., 2020).
Frequency is an important sound feature that plays a critical role in the “what” information of sounds and the feature that is also tightly linked to the “where” information (Du et al., 2011; Sollini et al., 2017; Tuninetti et al., 2017). For instance, the frequency information of human voice, which is related to the speaker’s gender and identity (Tuninetti et al., 2017), and the location of the speaker can be integrated by the brain to segregate the target speech sounds from concurrent sounds of other talkers (Du et al., 2011). Moreover, the central auditory system integrates outputs from separate frequency channels of both ears at the peripheral stage, which are manifested as interaural time and level differences (ITD and ILD), in order to derive perception of sound location (Sollini et al., 2017).
Animal studies have reported separate processing for the “what” and “where” information of sounds. Specifically, the anterior and posterior portions of the auditory cortex and their neural projections to the frontal and parietal regions of the brain are involved separately for processing the “what” and “where” information (Lomber and Malhotra, 2008; Rauschecker and Scott, 2009). This hierarchical “dual-processing” appears to be a common attribute of cortical sensory systems across mammalian species (Rauschecker and Scott, 2009). In humans, it remains unclear how the brain may differently process the “what” and “where” information of the sound, or at what stage the dimension difference occurs (Ahveninen et al., 2014; Retsa et al., 2018). On the one hand, some neuro-imaging studies using techniques including the functional magnetic resonance imaging (fMRI), magnetoencephalography (MEG), and electroencephalography (EEG) have provided evidence that the cortical processing of “what” and “where” information of sound is through dimension-specific mechanisms involving different brain regions (Altmann et al., 2007; Anourova et al., 2001; De Santis et al., 2007; Johnson et al., 2006). For example, using the fMRI and EEG, Altmann et al. (2007) reported that the “what” information was processed predominantly in the more anterior aspect of the superior temporal lobe and the “where” information was mainly processed in the posterior temporal lobe. De Santis et al., (2007) reported that, while activations within the superior temporal cortex and prefrontal cortex bilaterally were common for both conditions, the regions within the right temporoparietal cortices were specific for the “where” condition. The difference between conditions occurred at approximately 100 ms after stimulus onset, suggesting that the distinction between the “what” and “where” processing already exists at the sensory processing stage.
On the other hand, some researchers reported that the posterior auditory cortex found to be related to code “where” information is also activated by other stimulus features, suggesting that this area may not be specifically for spatial processing (see Review by Ahveninen et al., 2014). Alain et al. (2009) reported that the brain processing of “where” and “what” information may be similar at the early stage of sensory registration and that the difference occurs at approximately 200 ms after stimulus onset and involves the top-down modulation brain regions.
The ideal neuroimaging technique to examine how the brain processes the “where” and “what” information would be the one providing high spatial and temporal resolution. The EEG and MEG techniques provide excellent temporal resolution, but the spatial localization is limited. The fMRI provides excellent spatial resolution, but it lacks temporal accuracy. The EEG is the most suitable tool if it is used in hearing-impaired individuals wearing cochlear implants (CI), because most current CI devices are compatible with the EEG, but not the fMRI or MEG.
Previous studies have examined the neural aspects of change detection using the between-stimulus changes (e.g., oddball paradigm in which the deviant stimuli reflecting a change are randomly interspersed among the standard stimuli with a fixed quiet interval between successive stimuli, Opitz et al., 2002; Molholm et al., 2005). The neural responses to such between-stimulus changes are not solely reflecting change detection per se, as such neural responses also reflect the change in the occurrence ratio of the stimuli required in the oddball paradigm (e.g., 20% for the deviants and 80% for the standard stimuli). Moreover, the neural response to the sound change is affected by the stimulus onset and offset. It is critical to examine the neural substrates of detecting the within-stimulus change because: 1) the sounds in our daily- life environment contain dynamic changes in the sound background, and 2) this allows us to better understand how human brains detect the within-stimulus changes without much interference of stimulus onset and offset, as well as the occurrence ratio of the stimuli.
This study used the EEG method to examine the cortical responses to pure tones containing changes of different dimensions in normal hearing (NH) listeners: location change (L-change), frequency changes (F-change), or both location and frequency change [(L+F)-change]. With such stimuli, the CAEPs in response to the onset of the tone (onset-CAEP) and the CAEPs to the within-stimulus changes (the acoustic change complex, ACC) can be evoked (Liang et al., 2016; Liang et al., 2018; Martin & Boothroyd, 1999; Martin & Boothroyd, 2000; Martin et al., 2010; Ostroff et al., 1998). These CAEPs recorded in a passive listening condition allow us to examine cortical processing of sound changes at the pre-attentive stage. Differences between stimulus conditions were examined to answer the following questions: 1) Are the L-change and F-change processed in the brain in a similar way? 2) Are the 2-dimensional change [(L+F)- change] and 1-dimensional change (either L- or F-change) processed similarly in the brain? 3) Are different magnitudes of change with the same dimension/dimensions processed similarly in the brain? The information would be added to the understanding of neural mechanisms related to how the brain processes the “what” and “where” information of the sound. Moreover, this study would provide normative data for future comparisons with data from cochlear implant users, whose performance of frequency change detection for sound localization is typically poor (Rana et al., 2017; Schafer et al., 2007; Zeng et al., 2014; Zhang et al., 2019).
2. Methods
2.1. Participants
Fifteen young normal hearing (NH) listeners (age range, 20-30 years) participated. They were right-handed, as defined by the Edinburgh Handedness Inventory (Oldfield, 1971), and did not have any history of hearing disorders, neurological or psychiatric disorders, or brain injury. This study was approved by the Institutional Review Board (IRB) at the University of Cincinnati. The informed consent was obtained from each participant and the privacy rights of participants have always been observed.
2.2. Stimuli
Six types of stimuli including one reference tone (250 Hz pure tone of 1 sec, 20 ms raised cosine ramps) and 5 tones containing a change in the middle of the tone (0.5 sec after the tone onset) were generated using MATLAB at a sampling rate of 44.1 kHz. The tones containing a change were composed of two segments: the 1st segment being a 0.5 sec pure tone at 250 Hz that was presented from the left speaker (−90° in azimuth), and the 2nd segment being a 0.5 sec tone representing a change of different dimensions including an upward frequency change (5%F- change, and 50%F-change), a location change by shifting the sound presentation to the right speaker (L-change, 180°), or a location + frequency change [(L+5%F)-change, and (L+50%F)-change]. The two sound segments were equalized in terms of the root mean square energy. For frequency changes, the change was instantaneous and occurred for an integer number of cycles of the base frequency at 0 phase (zero-crossing) to reduce the onset cue of the frequency change (Dimitrijevic et al., 2008). For the location change, the amplitude was reduced to zero over 10 ms at the end of the 1st segment and the beginning of the 2nd segment to minimize the transient click at the transition. Figure 1 depicts the stimulus paradigm used in this study.
Figure 1.

Schematic illustration of the stimulus presented. The reference was a tone at 250 Hz (duration: 1-sec) presented from the left speaker. For the stimulus containing a change in the middle of tones, the 1st segment (duration: 0.5 sec) was presented from the left speaker and the 2nd segment (duration: 0.5 sec) representing a frequency change (5%F- and 50%F-change) presented from the left speaker, a location change (L-change, 180°), or a location+frequency change [(L+5%F)-change or (L+50%F)-change] that was presented from the right speaker.
Figure 2 shows waveforms (top and bottom rows) and spectrograms (middle row) for the stimuli with the 5%F-change (left panel) and 50%F-change (right panel). The abrupt frequency transition in the F-change condition did introduce some frequency splatter near the transition as shown in the spectrogram. However, such frequency splatter was relatively minor and mainly introduced by short-term frequency analysis. Since the transition occurred at 0 phase, no audible transient clicks were reported by all listeners due to the smoother transition in the time domain for both 5%F and 50%F-change than the one involving a sudden change of instantaneous sound pressure.
Figure 2.

Illustrations of stimuli containing frequency changes. The top row shows the waveform and the middle row shows the spectrograms of the entire stimuli (1-sec duration) for the 5%F- (left) and 50%F-change (right). The bottom row shows the waveforms of the partial stimuli (from 0.45 to 0.55 sec) surrounding the transition middle point, as indicated by the red dot.
The above 6 types of stimuli were presented in a randomized order, each with 400 trials, through loudspeakers (LSR305, Sweetwater, IN) connected to a MOTU Interface (Sweetwater, IN) at 80 dB(A). The inter-stimulus-interval (between the offset of the l-sec tone and the onset of the successive l-sec tone) was 0.8 sec. For the reference tone and the tones containing the F- change, the whole stimuli were presented from the left speaker (0.5 m from the left ear, −90° in azimuth); for the tones containing the L- and the (L+F)-change, the 1st segments of the tones were presented from the left speaker (0.5 m from the left ear, −90° in azimuth) and the 2nd segments from the right speaker (0.5 m from the right ear, 90° in azimuth).
2.3. EEG Recording
The participant was comfortably seated in a sound-treated booth for the EEG recordings. Prior to the EEG experiment, multiple trials of stimuli were presented to ensure that the participant was able to reliably detect all types of changes in the tones. EEG recordings were collected using a 40-channel Neuroscan system (NuAmps, Compumedics Neuroscan, Inc., Charlotte, NC), with a band-pass filter setting from 0.1 to 100 Hz, an analog-to-digital converter sampling rate of 1000 Hz, and the linked ear as the reference. Before EEG recordings, the Quick-cap with 40 electrodes was placed on the participant’s scalp according to the international 10-20 system and required procedures were taken to ensure that electrode impedances were no greater than the recommended level (i.e., 5 kΩ). During testing, participants read self-selected magazines or watched a captioned movie to keep alert and were asked to ignore the acoustic stimuli. They were also instructed not to move their heads during the EEG testing.
2.4. Data Analysis
Continuous EEG data were digitally filtered (0.1 to 30 Hz), segmented (−100 ms to 1000 ms), and baseline corrected. Then the segmented data was imported to the EEGLAB Toolbox (EEGLAB, San Diego, CA), to remove the artifacts (e.g., eye blink, movement) using the Independent Component Analysis. After artifact removal, the EEG data were reconstructed and the average reference was computed. Finally, the EEG data were averaged separately for each of the 6 types of stimuli for each participant. Then MATLAB (Mathworks, Natick, MA) was used to objectively identify peak components for the vertex electrode (Cz), which was confirmed by the researcher’s visual evaluation. The N1 peak and the following P2 peak of the onset-CAEP were identified in a latency range 70-160 ms and 150-260 ms, respectively, after the onset of the tone; The N1’ and the following P2’ peaks of the ACC were identified in a latency range 670-760 ms and 750-860 ms, respectively, after the stimulus onset, or 70-160 ms and 150-260 ms after the occurrence of the change.
The Standardized low-resolution brain electromagnetic tomography (sLORETA), an online available source analysis method (http://www.uzh.ch/keyinst/loreta.htm), was performed to localize neural generators for the N1 and N1’ peaks of the CAEPs. The voxel-based current density images were created using the CAEP data from 34 electrodes (FP1, FP2, F7, F3, FZ, F4, F8, FT7, FC3, FCz, FC4, FT8, T3, C3, CZ, C4, T4, TP7, CP3, CPz, CP4, TP8, T5, P3, PZ, P4, T6, O1, OZ, O2, FT9, FT10, PO1, PO2) in the timeframes 70-100, 100-130, 130-160 ms, respectively. These 3 windows correspond to those for the 3 subcomponents of N1 (i.e., N1a, N1b, and N1c) that are generated from different but spatially and temporally overlapping cerebral generators (Budd et al., 1998; Knight et al., 1988; Woods, 1995). The current density patterns in these 3 windows would reflect the dynamic change of brain activities surrounding the N1 and N1’ peaks. The P2 peak and the corresponding P2’ were not the focus as the P2 involves independent processes compared to the obligatory N1 peak that represents the early sensory processing stage (Crowley and Colrain, 2004; Schwertner et al., 2018). Moreover, there was much less P2 data in the literature that could be used to compare the data in the current study.
2.5. Statistical Analysis
For the waveform analysis, a series of within-subject repeated analysis of variance (ANOVA) were performed to examine the difference in the peak measures of the ACCs at the Cz electrode. A p-value of 0.05 was used as the significance level for all analyses. sLORETA comparisons of the current source density of the event-related potentials (ERPs) were performed for the following 8 pairs to address the aforementioned research questions: L- vs. 5%F-change, L- vs. 50%F-change, (L+5%F)- vs. L-change, (L+5%F)- vs. 5%F-change, (L+50%F)- vs. L-change, (L+50%F)- vs. 50%F-change, (L+50%F)- vs. (L+5%F)-change, and 50%F- vs. 5%F-change. The current density comparisons were conducted in sLORETA in the latency ranges where the ERPs were significantly different in each stimulus pair (Justen and Herbert, 2016). The comparisons were performed using the sLORETA-built-in voxel-wise randomization tests based on SnPM corrected for multiple comparisons (Holmes et al. 1996). The voxels with significant differences were specified in the corresponding brain regions using sLORETA images and voxel-by-voxel t-values in Talairach space were displayed.
3. Results
Figure 3 shows the grand mean ERPs to the 6 types of stimuli from electrode Cz. Unlike the reference stimulus, for which only the onset-CAEP was observed in a latency range of approximately 70-260 ms after stimulus onset, the stimuli containing a change evoked both onset-CAEPs and ACCs, with the latter occurring at approximately 70-260 ms after the change occurred.
Figure 3.
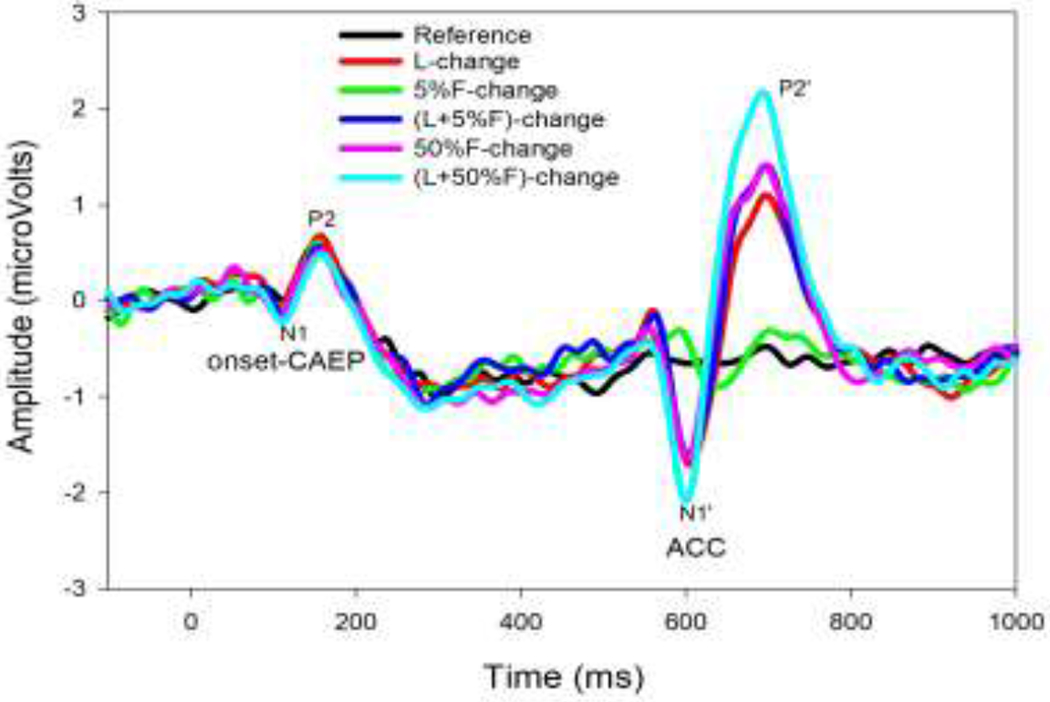
Grand-average (n=15) event-related potentials (ERPs) at the Cz electrode evoked by different stimuli (reference tone and tones containing one of 5 different changes), plotted with traces of different colors. The onset-CAEP peaks (N1 and P2) and ACC peaks (N1’ and P2’) are labeled.
Figure 4 shows the means and standard errors of peak amplitudes and latencies of the ACC peaks (N1’ and P2’) and the onset-CAEP peaks (N1 and P2) at Cz electrode. For the ACC measurements (grey), the N1’ and P2’ latencies were longest for the 5%F-change and similar for other types of changes; the N1’ and P2’ amplitudes were the smallest for the 5%F-change, largest for the (F+50%F)-change, and the response amplitudes for other types of changes had a similar size between the smallest and the largest responses. The onset-CAEP peak measurements showed a shorter P2 latency and smaller N1 amplitude (black) than the corresponding measurements in the ACCs.
Figure 4.

Mean (n=15) latencies and amplitudes of the ACC peaks (N1’ and P2’, gray) to different types of changes embedded within the tone and the values for the onset-CAEP (N1 and P2, black) at the Cz electrode. The error bars indicate the standard error. Note that, for convenient visual comparisons, the latency values for the ACCs were adjusted relative to the occurrence time of the sound change.
Statistical analyses using the repeated measures ANOVA were separately conducted to examine the effect of the acoustic change (5 types) on the latencies and amplitudes of N1’ and P2’ peaks, which were the focus of this study. The normality test (Shapiro-Wilk) failed and Friedman Repeated Measures Analysis of Variance on Ranks were conducted. For the N1’ latency, there was a statistical significance in the type of acoustic changes (Chi-square = 29.36, p < 0.001). The pairwise-comparison (Tukey Test) results were: 5%-change > (F+5%F)-change, 50%F-change, and (F+50%F)-change (p < 0.001). For the P2’ latency, there was no statistical significance in the effect of the type of acoustic changes (p > 0.05). For the N1’ amplitude, there was a statistical significance in the type of changes (Chi-square = 23.57, p < 0.01). The pairwise-comparison (Tukey Test) results for the N1’ amplitude were: (L+50%F)-change > 5%F-change (p < 0.01). For the P2’ amplitude, there was a statistical significance in the type of changes (Chi-square = 38.03, p < 0.01). The pairwise-comparison results (Tukey Test) for the P2’ amplitude were: (L+50%F)-change > 5%F-change (p < 0.01) and L-change (p < 0.05).
For the tone containing the L-change, the two segments of the stimulus were the same except that the location of the speakers presenting these two sound segments was different. The onset-CAEP and the ACC evoked by the L-change were further examined to determine if these responses are different. Statistical comparisons (pair-t tests) of the peak values showed P2’ latency (190.40 ms) was significantly longer than the P2 latency (160.68 ms, p < 0.01) and both N1’ amplitude (−1.84 μV) and P2’ amplitude (1.31 μV) were significantly larger than that for the N1 (−0.42 μV) and P2 (0.79 μV), respectively (p < 0.05).
Figure 5 shows the mean current source density (CSD) in 3 time-windows: 70-100, 100-130, and 130-160 ms after the stimulus onset for the onset-CAEP and after the change occurs for the ACCs across all participants. The CSD for the onset-CAEP was strongest in both temporal lobes for the 3 time-windows, with the right side showing a stronger activation. The CSD patterns for the ACCs showed activation in both temporal and frontal lobes. Among the ACCs, the differences between L-change vs. F-change depended on the magnitude of the F-change: the L-change activated bilateral temporal lobe in windows 70-100 and 100-130 ms then additional frontal lobe in window 130-160 ms, the 50%F-change evoked more activation in the right temporal lobe in window 70-100 ms and additional frontal lobe in the other two windows, and the 5%F-change showing temporal lobe activation in window 100-130 ms and more frontal lobe activation in the other two windows; finally, L-change dominates over F-change in cortical processing in the windows from 70-130 ms [e.g., the pattern for L-change is similar to that for (L+F)-change].
Figure 5.

The sLORETA current density activation patterns of the mean onset-CAEP and ACCs (n=15) within the latency ranges of 70-100, 100-130, and 130-160 ms after stimulus onset or after the change occurs, respectively. Maxima are color-coded as yellow.
sLORETA was used to perform the current source densities of the ERPs for the 8 stimulus pairs used to address the 3 research questions stated earlier. The current source density was compared for the stimulus pairs during the latency ranges in which the whole-head ERPs were statistically different (the latency range starting from approximately 150 ms and 200 ms after the change occurs). Figure 6 shows the sLORETA comparison maps for these stimulus pairs. There was a statistical difference in the CSD between conditions in the following pairs: L-change > 5%F-change, (L+5%F)-change > 5%F-change, and 50%F-change > 5%F-change (p < 0.05). These pairs have the commonality that the former is a larger change than the latter within the pair. The sLORETA comparison maps showed the frontal lobe regions including the cingulate gyrus, medial frontal gyrus (MFG), superior frontal gyrus (SFG), the limbic lobe cingulate gyrus, and parietal lobe postcentral gyrus were activated for larger changes. Table 1 summarizes the findings of CSDs in sLORETA.
Figure 6.

Horizontal, sagittal, and coronal slices of sLORETA statistical images (voxel-by-voxel t-tests, p < 0.05) for the current source density (CSD) comparisons between different ACCs over time windows where the ERPs showed statistical differences. Note that two separate time intervals were found to show CSD differences for the 50%F- vs. 5%F-change comparison (see Table 1). Therefore, two statistical images for these two intervals are provided. Positive t-values (yellow) indicates that former stimulus evoked a stronger activation than the latter stimulus, with the alpha being significant after Holmes’ correction for multiple comparisons. It can be seen that larger changes evoked stronger activities in regions including the frontal lobe: cingulate gyrus, middle frontal gyrus, superior frontal gyrus; limbic lobe: cingulate gyrus; and parietal lobe: postcentral gyrus.
Table 1.
Comparisons of current source densities (CSDs) in sLORETA
| Stimulus pairs used for Comparisons | The time windows after the change occurs where the ERPs was significantly different | t(critical) for CSD comparisons (p<0.05) | t value | Brain regions significantly activated |
|---|---|---|---|---|
| L- vs. 5%F-change | 148-159 ms | 1.78 | 2.18 | BA 1, 2, 3 (parietal lobe, postcentral gyrus) |
| (L+5%F)- vs. 5%F-change | 170-203 ms | 5.56 | 7.59 | BA 32, 6, 8, 24 (limbic lobe: cingulate gyrus; frontal lobe: MFG and SFG; frontal lobe: cingulate gyrus) |
| 50%F- vs. 5%F-change | 163-203 ms | 1.78 | 2.05 | BA 32, 6, 8, 24, and 2 (frontal lobe: cingulate gyrus, MFG, SFG; limbic lobe: cingulate gyrus; parietal lobe: postcentral gyrus) |
| 204-209 ms | 1.65 | 1.85 | BA 32, 6, 8, and 24 (frontal lobe: cingulate gyrus, MFG, SFG; limbic lobe: cingulate gyrus) |
BA: Brodmann areas. MFG: medial frontal gyrus. SFG: superior frontal gyrus.
4. Discussion
This study first examined cortical processing of sound changes in “what” and “where” dimensions using the CAEPs evoked by tones containing changes in location, frequency, and both location and frequency. Previous studies examined the ACCs to within-stimulus frequency changes using waveform analysis, which showed that the ACC amplitude increased with the magnitude of the frequency change (Harris et al., 2008; He et al., 2012; Vonck et al., 2019). The current study used both waveform and source analyses to reveal neural basis of change detection in frequency and location dimensions and the results are discussed below.
The onset-CAEP
The current source density distribution patterns in sLORETA for the onset-CAEP, which was evoked by the portion of stimulus presented from the left speaker, showed activation in both temporal lobes, with the right side showing a stronger activation than the left side. The left speaker presentation results in a higher loudness level received by the left ear compared to the right ear; due to the crossed fibers in the central auditory system, the right hemisphere temporal lobe is activated more than the left hemisphere. This finding is consistent with previous source analysis of the onset-CAEP that shows the contralateral dominance when the subject is stimulated with sounds from the left speaker (Briley et al., 2016).
The ACC for the L-change
The ACC evoked by the L-change is different from the onset-CAEP, although the two segments of the stimulus eliciting these responses were the same except that the location of the speakers presenting these two sound segments was different. The following evidence supports this conclusion: 1) some peak measurements of this ACC are different from those of the onset-CAEP. For instance, the P2’ latency was significantly longer than the P2 latency (p < 0.01) and both N1’ and P2’ amplitudes were significantly larger than the N1 and P2 amplitudes, respectively (p < 0.05); 2) the current density pattern showed that the involvement of the frontal lobe in addition to the temporal lobe for the ACC but both temporal lobes for the onset-CAEP (see Fig. 4). The differences and commonalities between the CAEP evoked by a L-change (achieved by using ITDs through earphones) and the onset-CAEP have also been observed in other studies (Akiyama et al., 2011).
The ACC evoked by the L-change may reflect the cortical processing of changes in the binaural cues (time and intensity cues, with the interaural time cue dominating for the low-frequency 250 Hz tone used in this study) of the sound related to the fact that the speaker was closer to left ear than the right ear for the 1st half segment of the stimulus and then was the opposite for the 2nd half segment of the stimulus (Phillips, 2008). The current density pattern shows that the bilateral temporal lobes were activated in time-windows 70-100 and 100-130 ms and the activation shifts to the left frontal lobe in the 130-160 ms window. Previous studies have reported that brain regions activated for the N1 peak evoked by location changes include both temporal lobes and regions in other lobes. For instance, Brunetti et al. (2005) reported fMRI results that brain activation to sound locations was in Heschl’s gyrus, the superiortemporal gyrus, the supramarginal gyrus, and the inferior and middle frontal lobe; Their MEG results showed activation in Heschl’s gyrus at approximately 139 ms after the auditory stimulus, in the superior temporal gyrus at 156 ms, and the inferior parietal lobule and the supramarginal gyrus at 162 ms. Other studies reported the major brain regions activated also include regions beyond the temporal lobe including the bilateral inferior frontal lobe and the right inferior parietal lobe (Ducommun et al., 2002).
The ACC evoked by the F-change
It is generally accepted that the right auditory cortex has a larger role in pitch change detection, while the left auditory cortex is more sensitive to temporal properties of the sound (Dimitrijevic et al., 2008; Hyde et al., 2008; Itoh et al., 2012; Liegeois-Chauvel et al., 2001; Molholm et al., 2005; Zatorre and Belin, 2001; Zatorre et al., 2002). Lesion studies also suggest that damage in the right hemisphere results in the impaired capability to discriminate frequencies (Johnsrude et al., 2000; Robin et al., 1990). Therefore, the current finding that the right temporal lobe is predominantly activated for the F-changes further supports the theory that the right hemisphere is more sensitive to frequency changes than the left hemisphere. When comparing the current density patterns for the 5%F- and 50%F-change, the temporal lobe is more widely activated for the 50% change. This is consistent with the MMN findings in previous studies that, with a larger frequency change, the strength of activation in the superior temporal gyrus, especially on the right side, increases (Opitz et al., 2002).
The cortical processing of L- vs. F-changes
Previous studies reported that brain activation pattern for “what” information differs from that for “where” processing both temporally and anatomically (Altmann et al., 2007; Anourova et al., 2001; Retsa et al., 2018), but debates existed regarding when the disassociation occurred. Some studies reported the difference between “what” and “where” occurred at approximately 100 ms after the change occurs, suggesting that the distinction between the “what” and “where” processing already exists at the early sensory processing stage (De Santis et al., 2007). Other studies (Alain et al., 2008, 2009) reported the dimension-specific activities began approximately 200 ms after stimulus onset and the differences were in regions including Heschl’s gyrus, and in the central medial, occipital medial, right frontal and right parietal cortex. This suggested that the “what” and “where” processing diverged after sensory registration in the temporal lobe. Note that Alain studies required the participant to perform a task related to the stimuli. Therefore, the “where” and “what” difference in brain activation patterns was influenced by attention.
In the current study, the whole-head ERP comparisons showed that the differences in the L-change vs. 5%F-change and L-change vs. 50%F-change stimulus pairs occurred after approximately 150 ms and 200 ms relative to the occurrence of the sound change, respectively. The current source density comparison illustrated that the L-change evoked stronger activation in the parietal lobe postcentral gyrus than the 5%F-change. The comparison between the L-change vs. 50%F-change did not show statistical significance. Our finding may indicate that the early cortical processing of “where” and “what” information does not differ significantly and that the dimensional-specific processes occur later beyond the temporal lobe. An alternative explanation is that the distinction of the structures in the temporal lobe involved for processing “what” and “where” was not detected, given that the EEG has poorer spatial resolution compared to the fMRI or the MEG.
The possible mechanisms for the ACCs
One explanation for the ACCs in the current study may be related to a neural mechanism involving the release from neural adaption. Specifically, the larger the change, the more neurons that are unaffected or released from neural adaption following the response to the 1st segment of the sounds, will respond to the 2nd segment since there is less overlap in frequency or spatial tuning to the two segments of the sounds. The possible involvement of the release from neural adaptation in brain activations to sound location and feature changes was also suggested by previous researchers (Ahveninen et al., 2014; Getzmann and Lewald, 2012).
The alternative explanation for the ACCs is that these responses reflect a stimulus-change detection mechanism involving higher-level cortical processes including memory-based sound comparison and involuntary attention switch, similar to the MMN (Deouell et al., 2006; Escera et al., 1998; Molholm et al., 2005; Näätänen, 1992). The activated brain regions of the MMN include the temporal, frontal, and parietal lobes, which are thought to function for automatic neural comparison of deviant and standard stimuli and involuntary attention switch (MacLean and Ward, 2014; Molholm et al., 2005; Opitz et al., 2002). Note that the MMN may reflect change-detection of multiple aspects of changes between the deviant and standard stimuli stated earlier (the change of the acoustic feature and the occurrence ratio) and the MMN response is interfered with the neural response to both offset and onset of the stimuli.
The stimulus-change detection mechanism can be used to explain the findings of ACCs in the current study. First, the ERP analysis showed that the ACC was the smallest for 5%F-change and the largest for (L+50%F)-change. The ACCs for other changes had similar amplitudes that were between the smallest and the largest (Fig. 3–4). The CSD comparisons (Table 1) showed the statistical differences existed when the stimulus conditions in the pairs were very different in physical magnitudes of the change [e.g., L-change > 5%F-change, 50%F > 5%F, and 2-dimensional changes > 1-dimensional changes].
Second, the sLORETA comparison map showed that, compared to small changes, larger changes activate brain regions in the frontal, limbic, and parietal lobes including the postcentral gyrus, medial frontal gyrus, superior frontal gyrus, and cingulate gyrus. This finding supports the existence of hierarchical organization of fronto-parietal networks used by the brain for memory-based acoustic comparison and involuntary attention switch (Molholm et al., 2005; Rossi et al., 2014).
Our results suggest that the cortical processes for detecting both frequency and location changes share the common stimulus-change detection mechanism. Such a stimulus-change detection mechanism at the pre-attentive stage may have significant impact in our daily life. For instance, it allows us to automatically detect various sound changes among the irrelevant sounds in our environment and only submit the important sounds (e.g., alarm sound for safety and speech sounds for communication) to involuntary attention switch (Molholm et al., 2005; Symonds et al., 2020).
5. Conclusions
Our results support that the ACCs, evoked by the change of “what” and “where” information, can be mainly explained by the stimulus-change detection mechanism, in which larger changes automatically activate the fronto-parietal neural network, possibly preparing the brain for better allocation of attention resources later. The differences in how the brain processes the change of “what” and “where” information exist approximately 150 ms after the change occurs and such differences are affected by the magnitude of the change.
Highlights.
The acoustic change complex (ACC) is elicited by a change in location (L-change, 180°), frequency (F-change, 5% or 50%F), or both location and frequency (L+F) within a sound stimulus.
The ACC evoked by larger changes show larger amplitudes and stronger brain activation than smaller changes [e.g., L- > 5%F-change; (L+5%F)- > 5%F-change; 50%F- > 5%F-change].
There is a common change-detection brain mechanism for detecting frequency and location changes.
Acknowledgments
We thank all participants for their contributions to this research.
Funding
This research was partially supported by the University Office of Research (PILOT 1 grant) at the University of Cincinnati, and the National Institute of Health R15 grant (NIH 1 R15 DC016463-01) to Dr. Zhang. The content is solely the responsibility of the authors and does not necessarily represent the official views of the National Institutes of Health and other funding agencies.
Footnotes
Publisher's Disclaimer: This is a PDF file of an unedited manuscript that has been accepted for publication. As a service to our customers we are providing this early version of the manuscript. The manuscript will undergo copyediting, typesetting, and review of the resulting proof before it is published in its final form. Please note that during the production process errors may be discovered which could affect the content, and all legal disclaimers that apply to the journal pertain.
References
- Ahveninen J, Kopco N, Jaaskelainen IP (2014). Psychophysics and neuronal bases of sound localization in humans. Hearing Research, 307, 86–97. doi: 10.1016/j.heares.2013.07.008 [doi] [DOI] [PMC free article] [PubMed] [Google Scholar]
- Akiyama LF, Yamashiro K, Inui K, Kakigi R (2011). Automatic cortical responses to sound movement: A magnetoencephalography study. Neuroscience Letters, 488(2), 183–187. doi: 10.1016/j.neulet.2010.11.025 [doi] [DOI] [PubMed] [Google Scholar]
- Alain C, He Y, Grady C (2008). The contribution of the inferior parietal lobe to auditory spatial working memory. Journal of Cognitive Neuroscience, 20(2), 285–295. doi: 10.1162/jocn.2008.20014 [doi] [DOI] [PubMed] [Google Scholar]
- Alain C, McDonald KL, Kovacevic N, McIntosh AR (2009). Spatiotemporal analysis of auditory “what” and “where” working memory. Cerebral Cortex (New York, N.Y.: 1991), 19(2), 305–314. doi: 10.1093/cercor/bhn082 [doi] [DOI] [PubMed] [Google Scholar]
- Altmann CF, Bledowski C, Wibral M, Kaiser J (2007). Processing of location and pattern changes of natural sounds in the human auditory cortex. NeuroImage, 35(3), 1192–1200. doi:S1053-8119(07)00036-5 [pii] [DOI] [PubMed] [Google Scholar]
- Anourova I, Nikouline VV, Ilmoniemi RJ, Hotta J, Aronen HJ, Carlson S (2001). Evidence for dissociation of spatial and nonspatial auditory information processing. NeuroImage, 14(6), 1268–1277. doi: 10.1006/nimg.2001.0903 [doi] [DOI] [PubMed] [Google Scholar]
- Bidelman GM (2015). Sensitivity of the cortical pitch onset response to height, time-variance, and directionality of dynamic pitch. Neuroscience Letters, 603, 89–93. doi: 10.1016/j.neulet.2015.07.018 [doi] [DOI] [PubMed] [Google Scholar]
- Boubenec Y, Lawlor J, Shamma S, Englitz B (2016). Change detection in auditory textures. Advances in Experimental Medicine and Biology, 894, 229–239. doi: 10.1007/978-3-319-25474-6_24 [doi] [DOI] [PMC free article] [PubMed] [Google Scholar]
- Briley PM, Goman AM, Summerfield AQ (2016). Asymmetries in the representation of space in the human auditory cortex depend on the global stimulus context. Neuroreport, 27(4), 242–246. doi: 10.1097/WNR.0000000000000527 [doi] [DOI] [PubMed] [Google Scholar]
- Brunetti M, Belardinelli P, Caulo M, Del Gratta C, Della Penna S, Ferretti A, … Romani GL (2005). Human brain activation during passive listening to sounds from different locations: An fMRI and MEG study. Human Brain Mapping, 26(4), 251–261. doi: 10.1002/hbm.20164 [doi] [DOI] [PMC free article] [PubMed] [Google Scholar]
- Budd TW, Barry RJ, Gordon E, Rennie C, Michie PT (1998). Decrement of the N1 auditory event-related potential with stimulus repetition: habituation vs. refractoriness. International journal of psychophysiology, 37(1), 51–68. 10.1016/s0167-8760 [DOI] [PubMed] [Google Scholar]
- Crowley KE, & Colrain IM (2004). A review of the evidence for P2 being an independent component process: age, sleep and modality. Clinical neurophysiology, 115(4), 732–744. 10.1016/j.clinph.2003.11.021 [DOI] [PubMed] [Google Scholar]
- De Santis L, Clarke S, Murray MM (2007). Automatic and intrinsic auditory “what” and “where” processing in humans revealed by electrical neuroimaging. Cerebral Cortex (New York, N.Y.: 1991), 77(1), 9–17. doi:bhj119 [pii] [DOI] [PubMed] [Google Scholar]
- Deouell LY, Parnes A, Pickard N, Knight RT (2006). Spatial location is accurately tracked by human auditory sensory memory: Evidence from the mismatch negativity. The European Journal of Neuroscience, 24(5), 1488–1494. doi:EJN5025 [pii] [DOI] [PubMed] [Google Scholar]
- Dimitrijevic A, Michalewski HJ, Zeng FG, Pratt EL, Starr A (2008). Frequency changes in a continuous tone: Auditory cortical potentials. Clinical Neurophysiology, 119(9), 2111–2124. doi: 10.1016/j.clinph.2008.06.002 [doi] [DOI] [PMC free article] [PubMed] [Google Scholar]
- Du Y, He Y, Ross B, Bardouille T, Wu X, Li L, Alain C (2011). Human auditory cortex activity shows additive effects of spectral and spatial cues during speech segregation. Cerebral cortex (New York, N.Y. : 1991), 21(3), 698–707. 10.1093/cercor/bhql36 [DOI] [PubMed] [Google Scholar]
- Ducommun CY, Murray MM, Thut G, Bellmann A, Viaud-Delmon I, Clarke S, Michel CM (2002). Segregated processing of auditory motion and auditory location: An ERP mapping study. Neuroimage, 76(1), 76–88. doi: 10.1006/nimg.2002.1062 [doi] [DOI] [PubMed] [Google Scholar]
- Escera C, Alho K, Winkler I, Näätänen R (1998). Neural mechanisms of involuntary attention to acoustic novelty and change. Journal of Cognitive Neuroscience, 70(5), 590–604. 10.1162/089892998562997 [DOI] [PubMed] [Google Scholar]
- Getzmann S, Lewald J (2010). Effects of natural versus artificial spatial cues on electrophysiological correlates of auditory motion. Hearing Research, 259(1-2), 44–54. doi: 10.1016/j.heares.2009.09.021 [doi] [DOI] [PubMed] [Google Scholar]
- Getzmann S, Lewald J (2012). Cortical processing of change in sound location: Smooth motion versus discontinuous displacement. Brain Research, 1466, 119–127. doi: 10.1016/j.brainres.2012.05.033 [doi] [DOI] [PubMed] [Google Scholar]
- Harris KC, Mills JH, He NJ, Dubno JR (2008). Age-related differences in sensitivity to small changes in frequency assessed with cortical evoked potentials. Hearing research, 243(1–2), 47–56. 10.1016/j.heares.2008.05.005 [DOI] [PMC free article] [PubMed] [Google Scholar]
- He S, Grose JH, Buchman CA (2012). Auditory discrimination: the relationship between psychophysical and electrophysiological measures. International Journal of Audiology, 51(10), 771–782. 10.3109/14992027.2012.699198 [DOI] [PMC free article] [PubMed] [Google Scholar]
- Hyde KL, Peretz I, Zatorre RJ (2008). Evidence for the role of the right auditory cortex in fine pitch resolution. Neuropsychologia, 46(2), 632–639. 10.1016/j.neuropsychologia.2007.09.004 [DOI] [PubMed] [Google Scholar]
- Itoh K, Okumiya-Kanke Y, Nakayama Y, Kwee IL, Nakada T (2012). Effects of musical training on the early auditory cortical representation of pitch transitions as indexed by change-N1. European Journal of Neuroscience, 36(11), 3580–3592. 10.1111/j.1460-9568.2012.08278.x [DOI] [PubMed] [Google Scholar]
- Jaunmahomed Z, Chait M (2012). The timing of change detection and change perception in complex acoustic scenes. Frontiers in Psychology, 3, 396. doi: 10.3389/fpsyg.2012.00396 [doi] [DOI] [PMC free article] [PubMed] [Google Scholar]
- Johnson BW, Hautus MJ, Hayns AL, Fitzgibbon BM (2006). Differential cortical processing of location and pitch changes in dichotic pitch. Neuroreport, 17(4), 389–393. doi: 10.1097/01.wnr.0000203358.72814.df [doi] [DOI] [PubMed] [Google Scholar]
- Johnsrude IS, Penhune VB, Zatorre RJ (2000). Functional specificity in the right human auditory cortex for perceiving pitch direction. Brain, 123(1), 155–163. 10.1093/brain/123.1.155 [DOI] [PubMed] [Google Scholar]
- Justen C, Herbert C (2016). Snap Your Fingers! An ERP/sLORETA Study Investigating Implicit Processing of Self- vs. Other-Related Movement Sounds Using the Passive Oddball Paradigm. Frontiers in Human Neuroscience, 10, 465 10.3389/fnhum.2016.00465 [DOI] [PMC free article] [PubMed] [Google Scholar]
- Knight RT, Scabini D, Woods DL, Clayworth C (1988). The effects of lesions of superior temporal gyrus and inferior parietal lobe on temporal and vertex components of the human AEP. Electroencephalography and Clinical Neurophysiology, 70(6), 499–509. 10.1016/0013-4694(88)90148-4 [DOI] [PubMed] [Google Scholar]
- Lewald J, Hanenberg C, Getzmann S (2016). Brain correlates of the orientation of auditory spatial attention onto speaker location in a “cocktail-party” situation. Psychophysiology, 53(10), 1484–1495. doi: 10.1111/psyp.l2692 [doi] [DOI] [PubMed] [Google Scholar]
- Lewald J, Schluter MC, Getzmann S (2018). Cortical processing of location changes in a “cocktail-party” situation: Spatial oddball effects on electrophysiological correlates of auditory selective attention. Hearing Research, 365, 49–61. doi:S0378-5955(18)30059-5 [pii] [DOI] [PubMed] [Google Scholar]
- Liang C, Earl B, Thompson I, Whitaker K, Cahn S, Xiang J, et al. (2016). Musicians are better than non-musicians in frequency change detection: Behavioral and electrophysiological evidence. Frontiers in Neuroscience, 10, 464. [DOI] [PMC free article] [PubMed] [Google Scholar]
- Liang C, Houston LM, Sarny RN, Abedelrehim LMI, & Zhang F (2018). Cortical processing of frequency changes reflected by the acoustic change complex in adult cochlear implant users. Audiology & Neuro-Otology, 23(3), 152–164. [DOI] [PMC free article] [PubMed] [Google Scholar]
- Liegeois-Chauvel C, Giraud K, Badier J-M, Marquis P, Chauvel P (2001). Intracerebral evoked potentials in pitch perception reveal a function of asymmetry of human auditory cortex. Dept of Psychology; U Montreal; et Al. (2003). The Cognitive Neuroscience of Music (Pp. 152-167). London, Oxford University Press. Xiii, 452 Pp, 117–132. [Google Scholar]
- Lomber SG, Malhotra S (2008). Double dissociation of’what’ and ‘where’ processing in auditory cortex. Nature neuroscience, 77(5), 609–616. 10.1038/nn.2108 [DOI] [PubMed] [Google Scholar]
- MacLean SE, Ward LM (2014). Temporo-frontal phase synchronization supports hierarchical network for mismatch negativity. Clinical Neurophysiology, 125(8), 1604–1617. doi: 10.1016/j.clinph.2013.12.109 [doi] [DOI] [PubMed] [Google Scholar]
- Martin BA, & Boothroyd A (1999). Cortical, auditory, event-related potentials in response to periodic and aperiodic stimuli with the same spectral envelope. Ear and Hearing, 20(1), 33–44. doi: 10.1097/00003446-199902000-00004 [doi] [DOI] [PubMed] [Google Scholar]
- Martin BA, & Boothroyd A (2000). Cortical, auditory, evoked potentials in response to changes of spectrum and amplitude. The Journal of the Acoustical Society of America, 107(4), 2155–2161. doi: 10.1121/1.428556 [doi] [DOI] [PubMed] [Google Scholar]
- Martin BA, Boothroyd A, Ali D, & Leach-Berth T (2010). Stimulus presentation strategies for eliciting the acoustic change complex: Increasing efficiency. Ear and Hearing, 31(3), 356–366. doi: 10.1097/AUD.ObO13e3181ce6355 [doi] [DOI] [PMC free article] [PubMed] [Google Scholar]
- Molholm S, Martinez A, Ritter W, Javitt DC, Foxe JJ (2005). The neural circuitry of pre-attentive auditory change-detection: An fMRI study of pitch and duration mismatch negativity generators. Cerebral Cortex, 15(5), 545–551. 10.1093/cercor/bhh155 [DOI] [PubMed] [Google Scholar]
- Näätänen R (1992). Attention and brain function. Hillsdale, NJ: Erlbaum. [Google Scholar]
- Oldfield RC (1971). The assessment and analysis of handedness: The edinburgh inventory. Neuropsychologia, 9(1), 97–113. doi: 10.1016/0028-3932(71)90067-4 [doi] [DOI] [PubMed] [Google Scholar]
- Opitz B, Rinne T, Mecklinger A, von Cramon DY, Schroger E (2002). Differential contribution of frontal and temporal cortices to auditory change detection: FMRI and ERP results. Neuroimage, 15(1), 167–174. [DOI] [PubMed] [Google Scholar]
- Ostroff JM, Martin BA, & Boothroyd A (1998). Cortical evoked response to acoustic change within a syllable. Ear and Hearing, 19(4), 290–297. doi: 10.1097/00003446-199808000-00004 [doi] [DOI] [PubMed] [Google Scholar]
- Phillips DP (2008). A perceptual architecture for sound lateralization in man. Hearing Research, 238(1–2), 124–132. doi:S0378-5955(07)00237-7 [pii] [DOI] [PubMed] [Google Scholar]
- Rana B, Buchholz JM, Morgan C, Sharma M, Weller T, Konganda SA, … Kawano A (2017). Bilateral versus unilateral cochlear implantation in adult listeners: Speech-on-speech masking and multitalker localization. Trends in Hearing, 21, 2331216517722106. doi: 10.1177/2331216517722106 [doi] [DOI] [PMC free article] [PubMed] [Google Scholar]
- Retsa C, Matusz PJ, Schnupp JWH, Murray MM (2018). What’s what in auditory cortices1 Neuroimage, 176, 29–40. doi:S1053-8119(18)30337-9 [pii] [DOI] [PubMed] [Google Scholar]
- Rauschecker JP, Scott SK (2009). Maps and streams in the auditory cortex: nonhuman primates illuminate human speech processing. Nature Neuroscience, 12(6), 718–724. 10.1038/nn.2331 [DOI] [PMC free article] [PubMed] [Google Scholar]
- Robin DA, Tranel D, Damasio H (1990). Auditory perception of temporal and spectral events in patients with focal left and right cerebral lesions. Brain and Language, 39(A), 539–555. 10.1016/0093-934X(90)90161-9 [DOI] [PubMed] [Google Scholar]
- Rossi S, Huang S, Furtak SC, Belliveau JW, & Ahveninen J (2014). Functional connectivity of dorsal and ventral frontoparietal seed regions during auditory orienting. Brain Research, 1583, 159–168. 10.1016/j.brainres.2014.08.002 [DOI] [PMC free article] [PubMed] [Google Scholar]
- Schafer EC, Amlani AM, Seibold A, Shattuck PL (2007). A meta-analytic comparison of binaural benefits between bilateral cochlear implants and bimodal stimulation. Journal of the American Academy of Audiology, 18(9), 760–776. [DOI] [PubMed] [Google Scholar]
- Schwertner A, Zortea M, Torres FV, Caumo W (2018). Effects of Subanesthetic Ketamine Administration on Visual and Auditory Event-Related Potentials (ERP) in Humans: A Systematic Review. Frontiers in Behavioral Neuroscience, 12, 70 10.3389/fnbeh.2018.00070 [DOI] [PMC free article] [PubMed] [Google Scholar]
- Shiell MM, Hausfeld L, Formisano E (2018). Activity in human auditory cortex represents spatial separation between concurrent sounds. The Journal of Neuroscience, 38(21), 4977–4984. [DOI] [PMC free article] [PubMed] [Google Scholar]
- Sohoglu E, Chait M (2016). Neural dynamics of change detection in crowded acoustic scenes. Neuroimage, 126, 164–172. doi: 10.1016/j.neuroimage.2015.11.050 [doi] [DOI] [PMC free article] [PubMed] [Google Scholar]
- Sollini J, Mill R, Sumner CJ (2017). Spatial processing is frequency specific in auditory cortex but not in the midbrain. The Journal of Neuroscience, 37(27), 6588–6599. doi: 10.1523/JNEUROSCI.3034-16.2017 [doi] [DOI] [PMC free article] [PubMed] [Google Scholar]
- Sussman ES, Bregman AS, Lee WW (2014). Effects of task-switching on neural representations of ambiguous sound input. Neuropsychologia, 64, 218–229. 10.1016/j.neuropsychologia.2014.09.039 [DOI] [PMC free article] [PubMed] [Google Scholar]
- Symonds RM, Zhou JW, Cole SL, Brace KM, Sussman ES (2020). Cognitive resources are distributed among the entire auditory landscape in auditory scene analysis. Psychophysiology, 57(2), el3487. doi: 10.1111/psyp.13487 [doi] [DOI] [PMC free article] [PubMed] [Google Scholar]
- Tuninetti A, Chladkova K, Peter V, Schiller NO, Escudero P (2017). When speaker identity is unavoidable: Neural processing of speaker identity cues in natural speech. Brain and Language, 174, 42–49. [DOI] [PubMed] [Google Scholar]
- Vonck B, Lammers M, van der Waals M, van Zanten GA, Versnel H (2019). Cortical Auditory Evoked Potentials in Response to Frequency Changes with Varied Magnitude, Rate, and Direction. Journal of the Association for Research in Otolaiyngology : JARO, 20(5), 489–498. 10.1007/s10162-019-00726-2 [DOI] [PMC free article] [PubMed] [Google Scholar]
- Woods DL (1995). The component structure of the N1 wave of the human auditory evoked potential. Electroencephalography and clinical neurophysiology. Supplement, 44, 102–109. [PubMed] [Google Scholar]
- Zatorre, Belin P (2001). Spectral and temporal processing in human auditory cortex. Cerebral Cortex (New York, N.Y. : 1991), 11(10), 946–953. 10.1093/cercor/11.10.946 [DOI] [PubMed] [Google Scholar]
- Zatorre, Belin P, Penhune VB (2002). Structure and function of auditory cortex: Music and speech. Trends in Cognitive Sciences, 6(1), 37–46. [DOI] [PubMed] [Google Scholar]
- Zeng FG, Tang Q, Lu T (2014). Abnormal pitch perception produced by cochlear implant stimulation. PloS One, 9(2), e88662. doi: 10.1371/journal.pone.0088662 [doi] [DOI] [PMC free article] [PubMed] [Google Scholar]
- Zhang F, Underwood G, McGuire K, Liang C, Moore DR, Fu QJ (2019). Frequency change detection and speech perception in cochlear implant users. Hearing Research, 379, 12–20. 10.1016/j.heares.2019.04.007 [DOI] [PMC free article] [PubMed] [Google Scholar]