Abstract
The human face is complex and multipartite, and characterization of its genetic architecture remains challenging. Using a multivariate genome-wide association study (GWAS) meta-analysis of 8,246 European individuals, we identified 203 genome-wide significant signals (120 also study-wide significant) associated with normal-range facial variation. Follow-up analyses find that the regions surrounding these signals are enriched for enhancer activity in cranial neural crest cells and craniofacial tissues, several regions harbor multiple signals with associations to different facial phenotypes, and there is evidence for potential coordinated actions of variants. In sum, our analyses provide insights for understanding how complex morphological traits are shaped by both individual and coordinated genetic actions.
Introduction:
In 1991, Atchley and Hall epitomized one of the major problems in contemporary biology as the need “to understand how complex morphological structures arise during development and how they are altered during evolution (p.102)1.” This problem continues to captivate biologists, geneticists, anthropologists, and clinicians almost three decades later. In their review, the authors describe a “complicated developmental choreography” in which intrinsic genetic factors, epigenetic factors, and interactions between the two make up the progeny genotype, which engages with the environment to ultimately produce a complex morphological trait composed of separate component parts1. We now understand that the intrinsic genetic factors ultimately contributing to complex morphological traits consist not only of single variants altering protein structure and/or function, but also non-coding variants and interactions among variants, each affecting multiple tissues and developmental timepoints. This realization requires methods capable of describing the genetic architecture of complex morphological traits, which includes identifying the individual genetic variants contributing to morphological variation and interactions among those variants2,3.
The human face, an exemplar complex morphological structure, is highly multipartite and results from the intricate coordination of genetic, cellular, and environmental factors4–6. Through prior GWAS, over 100 loci have been implicated in normal-range facial morphology7–23 (Supplementary Table 1). However, as with all complex morphological traits, our ability to identify and describe the genetic architecture of the face is limited by our ability to accurately characterize its phenotypic variation4, identify variants of both large and small effect15, and identify interactions between variants. We previously described a data-driven approach to facial phenotyping, which facilitated the identification and replication of 15 loci involved in global-to-local variation in facial morphology16. Here, we apply this phenotyping approach to two larger cohorts from the US and UK (nTotal = 8,246; Supplementary Table 2) and apply multivariate techniques to uncover new biological insights into the genetic architecture of the human face. We now identify 203 genome-wide significant (120 also study-wide significant) signals, located in 138 cytogenetic bands, associated with multivariate normal-range facial morphology. Many of these loci harbor genes involved in craniofacial syndromes but had not yet been observed in GWAS for normal-range facial morphology but 53 genome-wide significant (26 also study-wide significant) peaks are located in regions with no previously known role in facial development or disease, potentially pointing to previously unknown genes and pathways involved in facial development. We additionally provide evidence that variants at our genome-wide significant peaks are involved in regulating enhancer activity in cell types controlling facial morphogenesis across the developmental timeline. Furthermore, we reveal interactions between variants at different loci affecting similar aspects of facial shape variation, identifying gene sets that work in concert to build human faces. With this work, we not only push forward our understanding of human facial genetics, but also illustrate the potential for researchers to confront Atchley and Hall’s problem: by intensively characterizing complex morphological variation and using advanced methods to identify factors involved in the developmental choreography of complex morphological structures.
Results
Multivariate phenotyping and meta-analysis framework
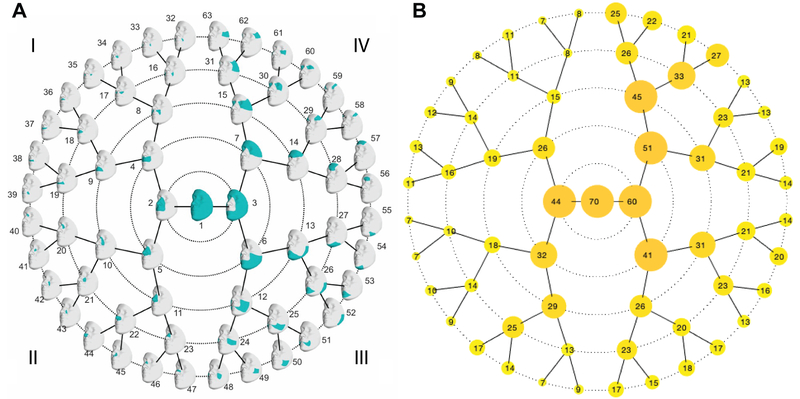
To study facial variation at both global and local scales, we start with a set of three-dimensional (3D) facial surface scans, upon which we map a dense mesh of 7,160 homologous vertices24. We then apply a data-driven facial segmentation approach, defined by grouping vertices that are strongly correlated using hierarchical spectral clustering16,25. The configurations of each of the resulting 63 segments are then independently subjected to a Generalized Procrustes analysis, after which principal components analysis (PCA) is performed in conjunction with parallel analysis to capture the major phenotypic variation in each facial segment26,27 (Extended Data Fig. 1). The number of principal components (PCs) kept at this stage of the analysis ranged from 7 to 70, with segments containing large numbers of quasi-landmarks generally requiring more PCs to describe the variation in that segment. The inherent shape variability in each segment also plays a role in the number of PCs retained by parallel analysis, with more variable segments retaining more PCs. For example, though segments 5 and 25 contain similar numbers of quasi-landmarks, because the variability of the nose (segment 5) is generally greater than that of the lower cheeks (segment 25), the parallel analysis for segment 5 retained 32 PCs while for segment 25 it retained only 20 PCs (Extended Data Fig. 1B).
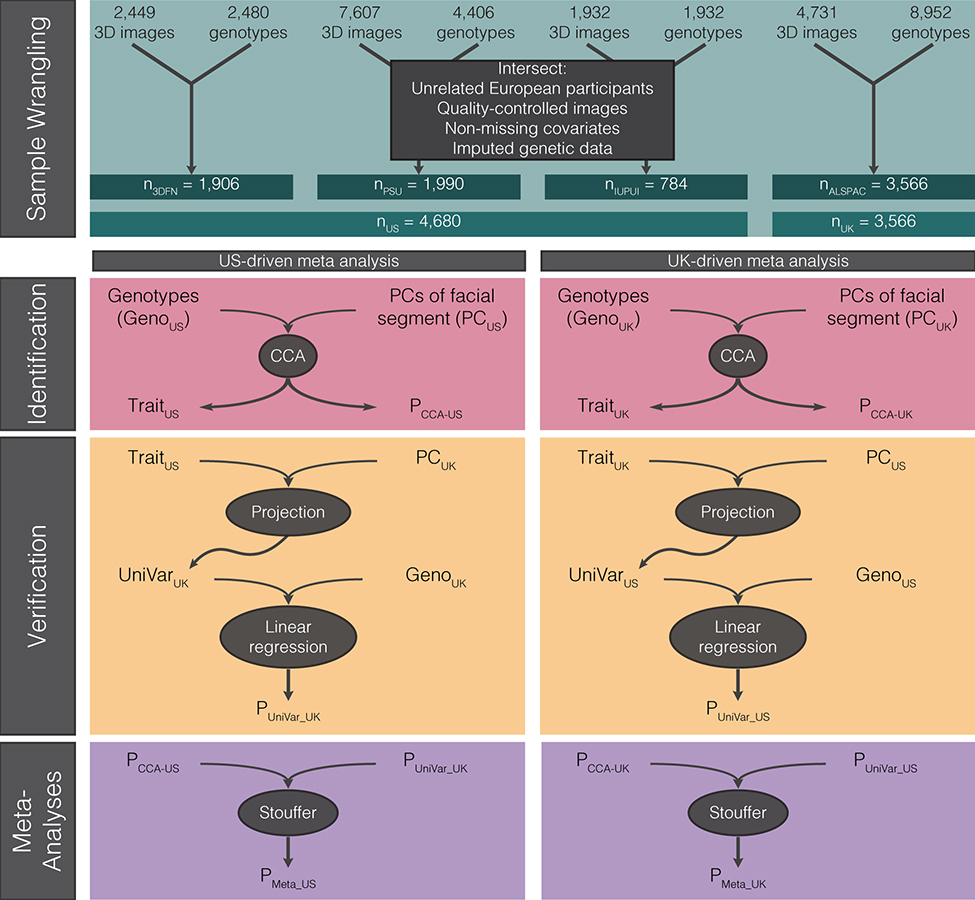
We then tested for genetic association between the facial PCs and 7,417,619 single-nucleotide polymorphisms (SNPs) using a data-driven approach (Extended Data Fig. 2). Within each segment, instead of a priori selecting the PCs of interest, or treating each of the 63 segments as a single “trait”, we use canonical correlation analysis (CCA) to first identify the linear combination of components in each segment maximally correlated with the SNP being tested in the identification cohort. We call this multivariate combination of PCs the “trait.” Thus, each SNP is associated (though not always with significance), with its own “trait” in each segment. Subsequently, the verification cohort is projected onto each of these traits, creating univariate “phenotype” variables which are tested for genotype-phenotype associations using linear regression. The projection ensures that the shape variation tested in the verification step is equivalent to the “trait” used in the identification step. The identification and verification P values are then meta-analyzed using Stouffer’s method28,29. The whole process is then repeated, switching the dataset used for identification and verification, thereby resulting in 126 meta-analysis P values and traits (63 segments × 2 meta-analysis tracks) for each SNP. Further details are available in the Methods and Supplementary Notes 1 and 2.
Sharing of genome-wide signals between facial segments
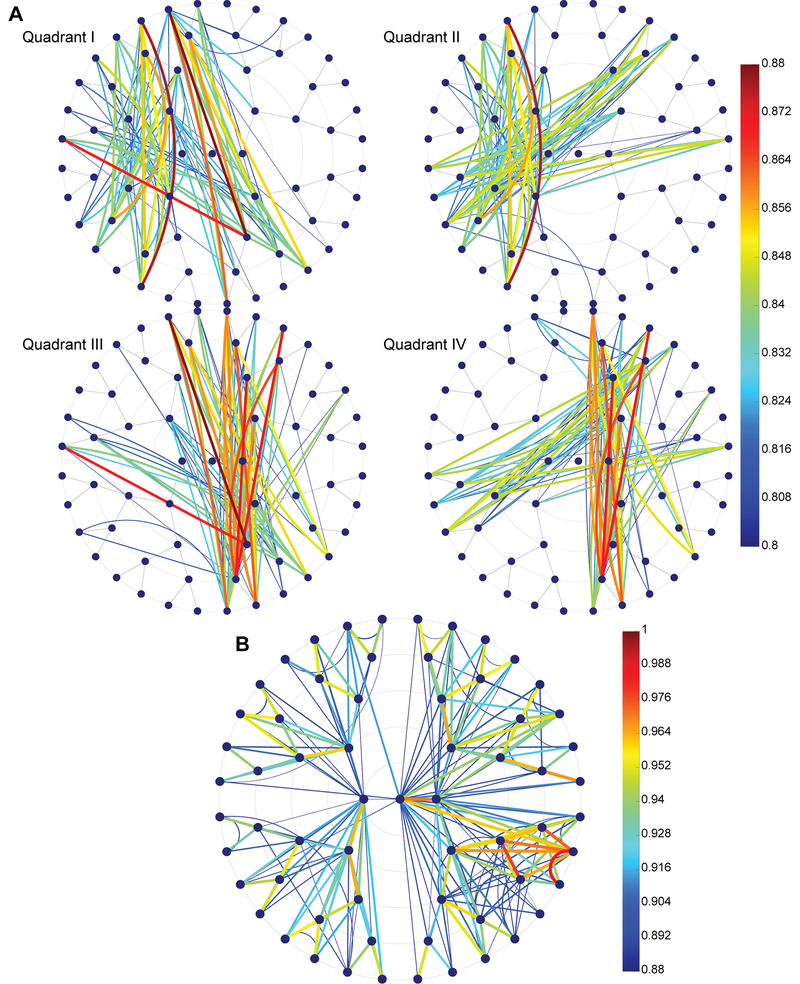
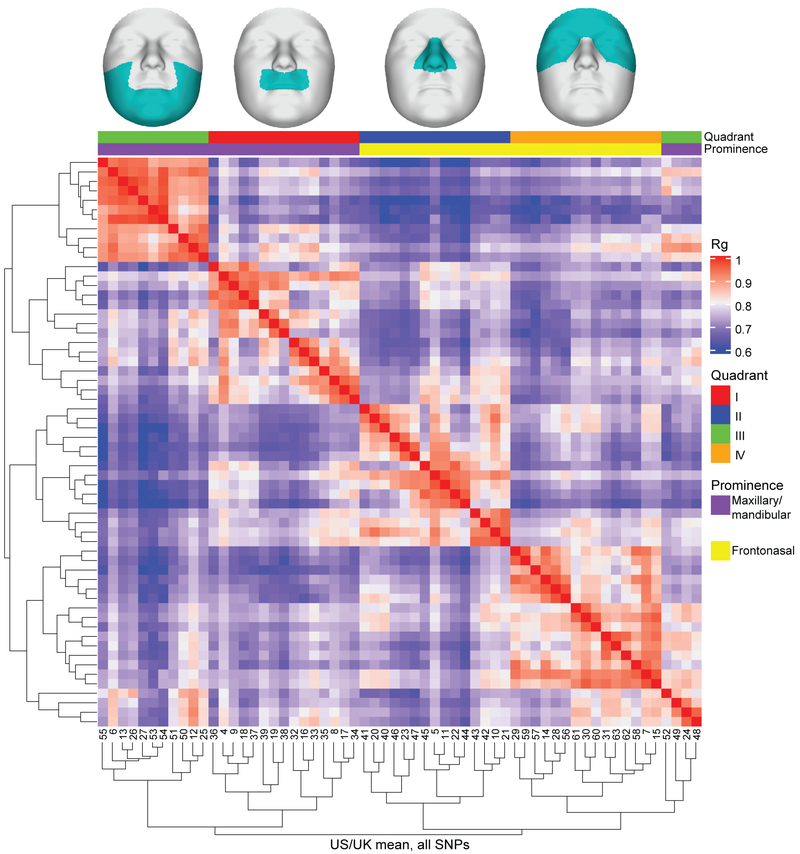
We first assessed the degree to which variation in each facial segment shares the same patterns of association across the genome by computing the linkage disequilibrium score correlation (LDSC) based on genome-wide association P values for each pair of facial segments30,31. This 63 × 63 matrix of correlations was visualized on top of the facial segmentation hierarchy to assess between-segment correlations within and between facial quadrants (Extended Data Fig. 3), though it is important to note that these LDSCs should not be considered “genetic correlations” in the typical way of a univariate trait, since the z-scores used are unsigned. The LDSCs were highest between segments of the same facial quadrant (i.e. lips, nose, lower face, upper face), validating the hierarchical clustering used to initially define the segments (Extended Data Fig. 3B). Average-linkage hierarchical clustering of the facial segments based on the correlation values gave rise to four main clusters, each primarily corresponding to segments from the same quadrant (Extended Data Fig. 4). Despite substantial within-quadrant similarity, there were notable correlations between groups of segments from different quadrants (Extended Data Fig. 3). Some of these specific correlations reflect close physical proximity of the segments in different quadrants (e.g. segments 12 and 33), but some correlations seem to reflect the shared embryological origins of groups of segments. Specifically, segments representing the nose (Quadrant II) and upper face (Quadrant IV) cluster together, and most segments representing the lips (Quadrant I) and lower face (Quadrant III) cluster together (Extended Data Fig. 4). Quadrants II and IV together approximate the frontonasal prominence, which appears earlier in development than the mandibular and maxillary prominences, which are approximated by Quadrants I and III32.
Genome-wide association meta-analysis
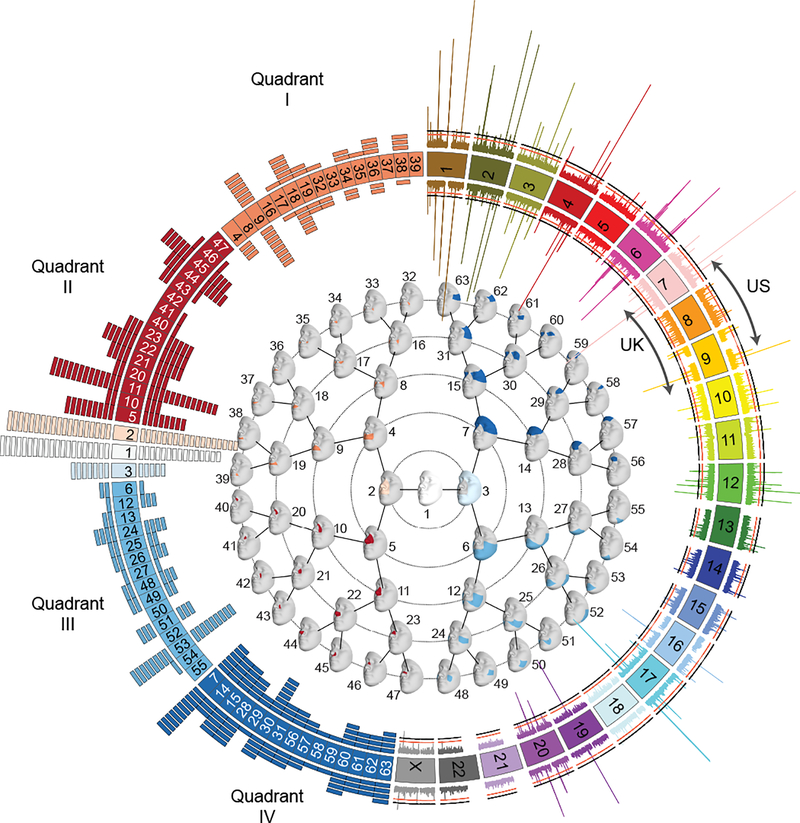
In total, we identified 17,612 SNPs with P values (PMeta-US and/or PMeta-UK) lower than the genome-wide threshold (P ≤ 5 × 10⁻⁸). Of these, 11,398 SNPs also passed the study-wide significance threshold (P ≤ 6.96 × 10⁻¹⁰) (Supplementary Fig. 1). For each peak passing the genome-wide threshold, we designated the SNP with the lowest P value across all facial segments as the “lead SNP,” refining our results to 218 genome-wide significant lead SNPs. Of these, 203 SNPs showed consistent genetic effects on the trait identified in the US- and UK-driven meta-analyses in the facial segment with the lowest P value for that SNP (Fig. 1; Supplementary Table 3) and 120 of these were also below study-wide significance. Visual representations of the LocusZoom33 and effect plots for each of the 203 genome-wide significant SNPs are available in the FigShare repository34.
Figure 1. Overall results of US-driven and UK-driven meta-analyses.
On the left, numbered blocks representing the 63 facial segments arranged and colored according to quadrant (I = orange; II = red; III = light blue; IV = dark blue), and the full face (white), and segments 2 (light orange) and 3 (ice blue). The histogram arranged on the left side represents the number of genome-wide significant lead SNPs reaching their lowest P value in each segment with each rectangle representing one SNP. The US-driven meta-analysis results are on the outside of the circle and the UK-driven meta-analysis results are on the inside of the circle. In the center, the global to local facial segmentation of all 3D images included in this analysis, obtained using hierarchical spectral clustering, colored to match with the quadrants on the left. On the right, a Miami plot of the US-driven meta-analysis P values on the outside and the UK-driven meta-analysis P values on the inside, with chromosomes colored and labeled. Values plotted are the result of Stouffer’s meta-analysis of one-sided right-tailed identification and verification P values, detailed in the Methods, and are -log10 scaled (range: [0–80]). The red line represents the genome-wide significance threshold (P = 5 × 10⁻⁸) and the black line represents the study-wide threshold (P = 6.96 × 10⁻¹⁰). Created using Circos v0.69–835.
The global-to-local approach means that we often identified associations between a single SNP and variation in many facial segments. In this manuscript, we primarily focus on the segment in which the SNP had its lowest P value (the ‘Best segment’) and provide information on which meta-analysis track (Meta-US or Meta-UK) in which the SNP reached this significance level (the ‘Best meta-analysis track’). Thus, throughout the rest of the manuscript, the reported P values for each SNP will be in the format of PBest track (Best segment) = value. By plotting the strongest association results for each segment (Fig. 1, left), segments 1 and 2 are visibly the “Best segment” for most SNPs, with n = 20 SNPs reaching lowest significance in the full face (segment 1) in the US-driven meta-analysis (n = 15 for Meta-UK) and n = 19 SNPs reaching lowest significance in segment 2 in the US-driven meta-analysis (n = 18 for Meta-UK).
Genes near lead SNPs are enriched for both craniofacial and limb development
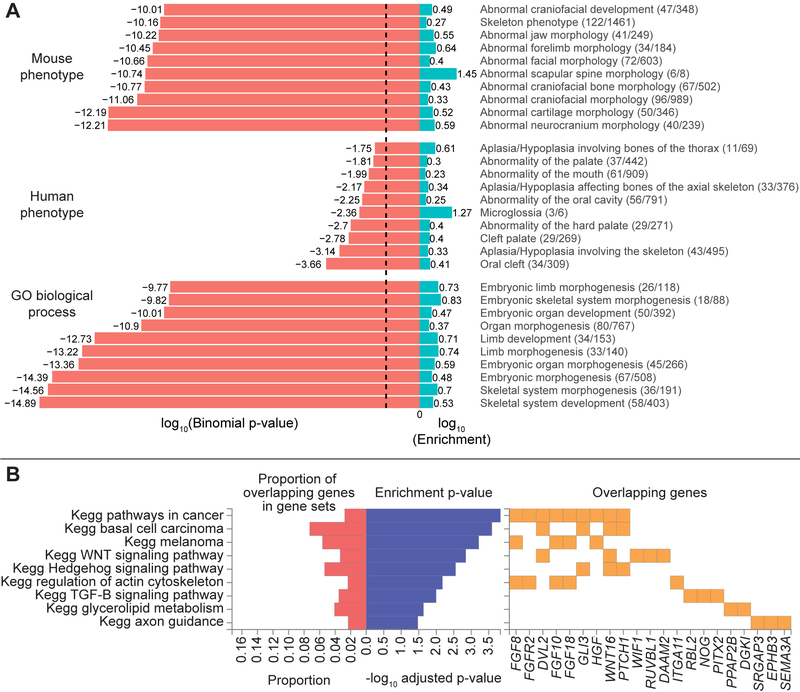
In a GREAT36 analysis of the regions surrounding the 203 genome-wide significant lead SNPs, the top ten terms (based on lowest binomial P values) in the mouse phenotype, human phenotype, and gene ontology (GO) biological processes categories are all highly relevant to craniofacial shape and overall morphology (Extended Data Fig. 5A), with the top human phenotype being oral clefting. A FUMA37 analysis of the same regions highlighted genes overlapping several pathways related to abnormal cellular maintenance and also included pathways highly relevant for morphological development, like the Wnt, Hedgehog, and TGFβ signaling pathways (Extended Data Fig. 5B).
Facial GWAS peaks are enriched for enhancers specific to cell types across the timeline of facial development
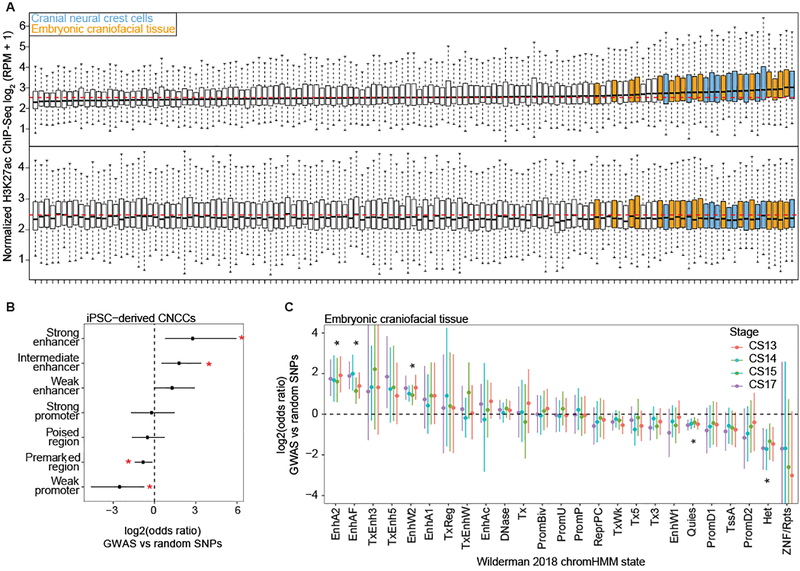
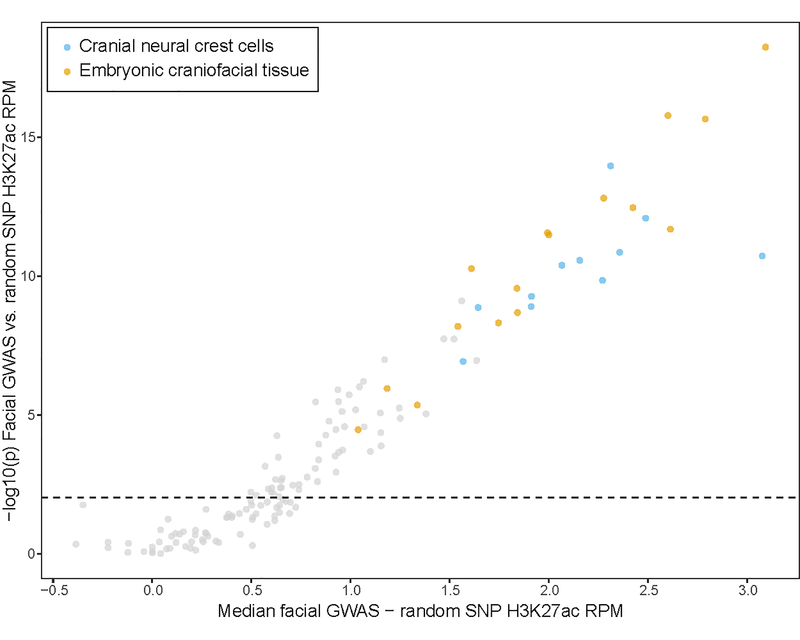
To assess the likely cell-types and developmental timepoints in which our GWAS regions are active, we compiled H3K27ac ChIP-seq signals, a marker of the promoters of transcriptionally active genes and active distal enhancers38,39, from approximately 100 different cell types and tissues, including cranial neural crest cells (CNCCs), fetal and adult osteoblasts, mesenchymal stem cell-derived chondrocytes, as well as dissected embryonic craniofacial tissues (Carnegie stages 13–20). Both CNCCs and craniofacial tissues showed the highest H3K27ac signals in the vicinity of the 203 genome-wide significant lead SNPs, whereas no H3K27ac signal was observed for 203 random SNPs matched for allele frequency and distance to the nearest gene (Fig. 2A). The difference in H3K27ac signal between the 203 genome-wide significant lead and random SNPs was significant based on a two-sided Wilcoxon rank-sum test for many cell types and tissues, with CNCCs and embryonic craniofacial tissues having the greatest median differences (Extended Data Fig. 6; Supplementary Table 4).
Figure 2. Regions near the 203 genome-wide significant lead SNPs are enriched for enhancers preferentially active in cranial neural crest cells and embryonic craniofacial tissue.
(A) Each boxplot represents the distribution of H3K27ac signal in 20-kb regions around the 203 genome-wide significant lead SNPs (top) or 203 random SNPs (bottom) in one sample, with cranial neural crest cells and embryonic craniofacial tissue highlighted. Boxplots plot the first and third quartiles, with a dark black line representing the median. Whiskers extend to the largest and smallest values no further than 1.5 × the inter-quartile range from the first and third quartiles, respectively. The dashed red lines represent the median level of H3K72ac reads per million (RPM) signal across all cell types and tissues. A larger labeled version of (A) is available in the FigShare repository34. For each class of regulatory element in either CNCCs derived from induced pluripotent stem cells (iPSC) (B) cranial neural crest cells or (C) embryonic craniofacial tissue, the number of elements within 20 kb of the 203 genome-wide significant lead SNPs was compared to the number within 20 kb of 203 random SNPs using a two-sided Fisher’s exact test. Points represent estimated odds ratio and surrounding bars represent 95% confidence intervals. Asterisk indicates any Benjamini-Hochberg adjusted P value < 0.05. For embryonic craniofacial tissue, enrichments were calculated for each Carnegie stage separately, as Wilderman et al.40 performed chromatin state segmentation for each stage separately. Descriptions of all mnemonics can be found at: https://egg2.wustl.edu/roadmap/web_portal/imputed.html#chr_imp.
To distinguish enrichment between coding and noncoding elements, we examined chromatin signals in CNCCs and embryonic craniofacial tissues in more detail, using ChIP-seq data on additional chromatin marks and transcription factors40,41. In the CNCCs, candidate regulatory regions in the vicinity of the 203 genome-wide significant lead SNPs were significantly enriched for strong and intermediate enhancers and depleted in weak promoters (Fig. 2B). In embryonic craniofacial tissue, all developmental stages sampled were significantly enriched for the chromHMM states of active enhancers, active enhancer flanks, and weak enhancers, and depleted in quiescent/low and heterochromatin states (Fig. 2C).
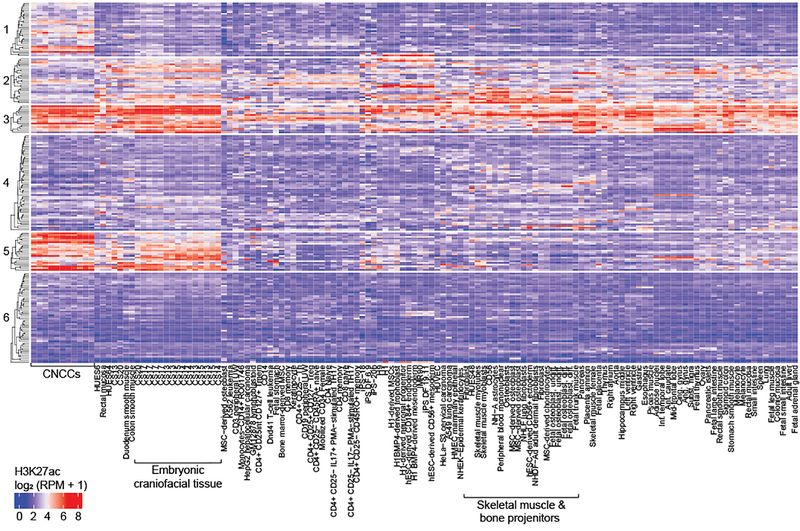
Cell-type-specific activity patterns were used to further subdivide the 203 genome-wide significant lead SNPs using k-means clustering of H3K27ac signals (Fig. 3). As expected, many lead SNPs showed specific activity for CNCCs and craniofacial tissue (e.g. cluster 5), representing activity in an early time point in development. Interestingly, however, some SNPs showed preferential activity for either CNCCs or craniofacial tissue (e.g. clusters 1 and 2). Greater specificity for CNCCs could arise because CNCCs constitute a relatively small proportion of the cells present in craniofacial tissue at Carnegie stages 13–20, while greater specificity for craniofacial tissue could be due to activity in further differentiated cell-types of the face.
Figure 3. Activity of 203 genome-wide significant lead SNPs in all cell-types studied.
H3K27ac signal calculation and k-means clustering of SNPs were performed as described in Methods. Average linkage clustering on Euclidean distances was performed both within each of the 6 row clusters and for all columns. Descriptions of all mnemonics can be found at: https://egg2.wustl.edu/roadmap/web_portal/meta.html
Known and novel loci
We identified 89 genome-wide significant (66 also study-wide significant) peaks that overlap with the results of prior association studies of normal-range facial phenotypes. Of these, 29 genome-wide significant (20 also study-wide significant) peaks were reported by studies with overlapping samples as this study and 60 genome-wide significant (46 also study-wide significant) peaks were previously reported by studies with completely non-overlapping sample sets. A total of 61 genome-wide significant (28 also study-wide significant) peaks observed in our analysis are located at loci harboring putative craniofacial genes (implicated from human malformations or animal models), but which had not yet been observed in GWAS for normal-range facial morphology. Our GWAS additionally revealed 53 genome-wide significant (26 also study-wide significant) peaks at loci harboring genes with no previously known role in facial development or disease. The annotation for each GWAS peak can be found in Supplementary Table 3.
Genomic regions harboring multiple lead SNPs
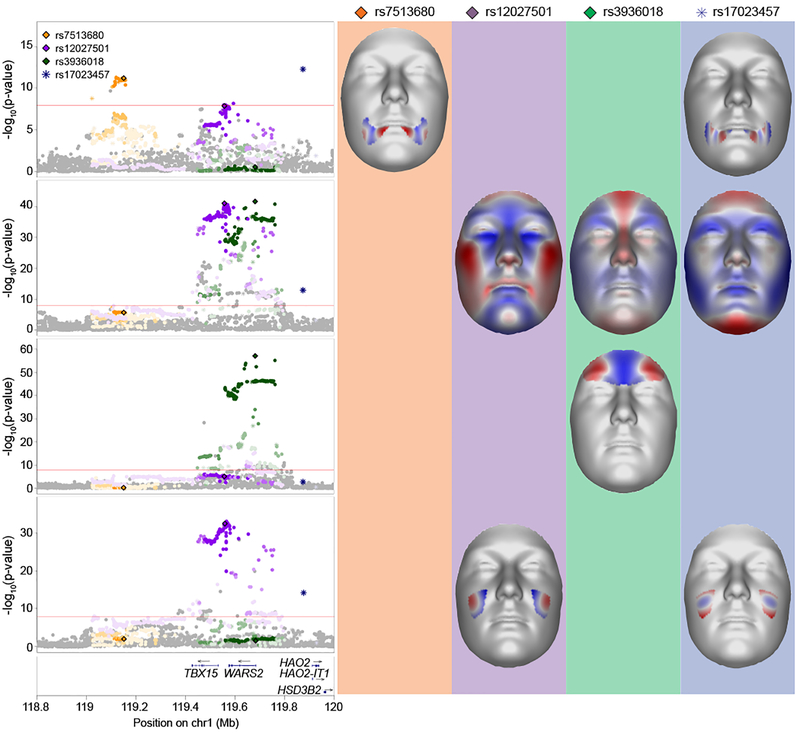
With our phenotyping and analysis framework, in many cases we are able to provide a more nuanced understanding of the underlying genetic architecture of facial variation. For example, variants at the TBX15-WARS2 locus (1p12; Fig. 4) were previously reported to be associated with forehead prominence16 and self-reported chin dimples11, already indicating that this locus has multiple spatially separated effects on the face. In our current analysis, we see the same influence on forehead morphology as previously reported by our group16, with lead SNP rs3936018, located in the promoter region of WARS2, reaching its lowest significance in segment 14 (PMeta-US(Seg. 14) = 8.01 × 10−58). Interestingly, this lead SNP overlaps in location with a SNP not originally identified in our peak selection approach, rs12027501 (PMeta-US(Seg. 1) = 1.03 × 10−41). The latter was most significant in segment 1, the full face, and is not a good proxy for the former (r2: 0.075, D’: 0.979), indicating it is likely an independent statistical signal. Another signal, approximately 275 kb upstream of TBX15 (rs7513680), was most significantly associated with morphology in segment 51 (PMeta-UK(Seg. 51) = 7.03 × 10⁻¹³), representing the cheek area around the corners of the mouth. Lastly, another GWAS peak is present approximately 301 kb downstream of WARS2 (rs17023457) with an effect in the upper cheeks (PMeta-UK(Seg. 48) = 3.26 × 10⁻¹⁵). Of interest, we observed twenty-four such loci with multiple genome-wide significant peaks that are each associated with different facial traits (Supplementary Table 5, Supplementary Data 1).
Figure 4. TBX15-WARS2 multi-peak locus.
LocusZoom33 plots and facial effects for four association signals near the TBX15-WARS2 locus. Clustering based on r2 was performed to separate non-correlated signals, resulting in the separation of four SNPs. Color for each SNP is based on cluster association, with saturation indicating r2 correlation with the most significant SNP in the cluster. SNPs represented by diamonds are the genome-wide significant lead SNPs also present in the 1000G Phase 3 dataset; SNPs represented by circles are adjacent SNPs also present in the 1000G Phase 3 dataset; SNPs represented by asterisks are those not present in the 1000G Phase 3 dataset. For the segment in which each lead SNP had its lowest effect, we plot the facial effects for the lead SNPs reaching significance in that segment as the normal displacement (displacement in the direction normal to the facial surface) in each quasi-landmark going from minor to major allele, with red colored areas shifting outward while blue colored areas shift inwards.
Genetic interactions impacting facial variation
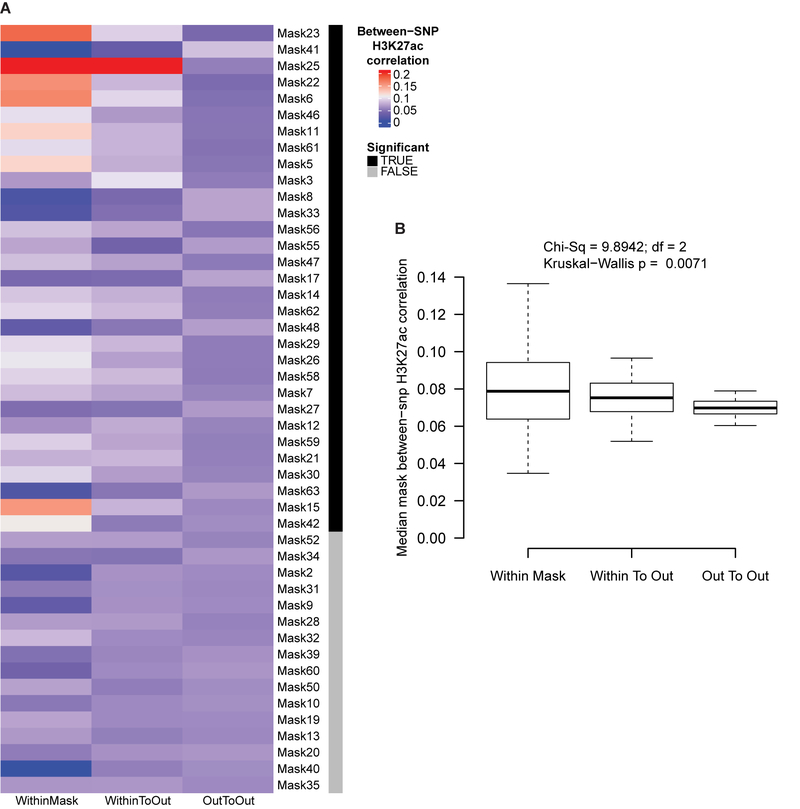
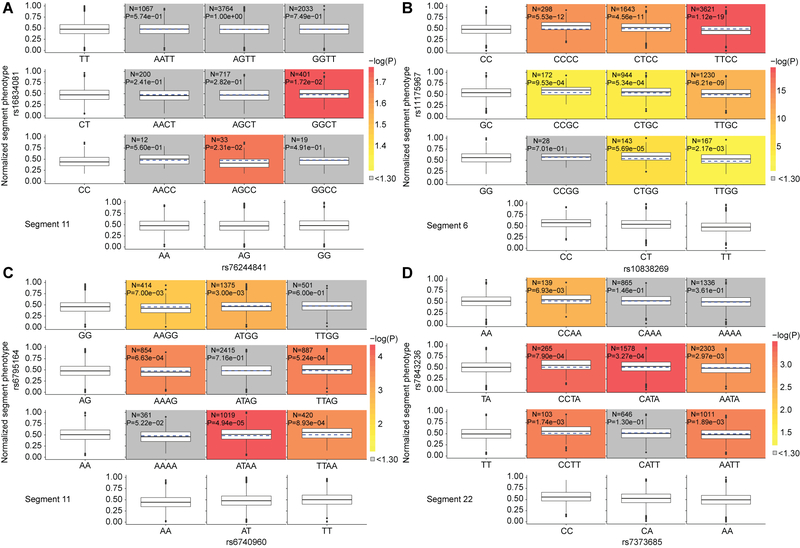
To better analyze and rank the effects of multiple genotypes on a facial trait, we utilized structural equation modeling (SEM) to refine our understanding of which groups of genome-wide significant variants best explain the variance observed in each facial segment. SEM is a multivariate statistical analysis technique that analyzes structural relationships between measured variables (e.g. genetic variants and covariates) and latent constructs (univariate phenotypes derived from the PCs of the analyzed facial segment). This was done in an iterative manner, resulting in 50 well-fitting SEM models (corresponding to 50 facial segments; Supplementary Data 2). For each of these 50 models, the output included a univariate latent variable and a list of variants ranked by their estimated contribution to that variable, highlighting the polygenic nature of facial variation captured by the latent variable. Higher correlations of cross-sample H3K27ac activity was found when comparing SNPs deemed significant by the same SEM model than when comparing SNPs non-significant in the same SEM model (Extended Data Fig. 7). Additionally, of the SEM-significant SNPs, four SNP combinations displayed evidence of pairwise epistatic interactions (Table 1; Fig. 5; Extended Data Fig. 8; Supplementary Note 3).
Table 1. Four SNPs with evidence of epistatic interactions.
For each of the 50 segments with a refined SEM model, we used the latent variables and SNP lists to test for evidence of epistasis using a two-sided linear regression epistasis test in Plink 1.9, with Bonferroni multiple testing correction. For the four SNP pairs with significant evidence of epistatic interactions, this table lists the epistasis P value, rsID, GRCh37 location, and gene annotation. The phenotypic and marginal distributions for the pairs are depicted as boxplots in Figure 5 and Extended Data Fig. 8.
| Segment | SNP 1 | SNP 2 | Test statistic | P value | ||||
|---|---|---|---|---|---|---|---|---|
| RSID | Location | Annot. Gene | RSID | Location | Annot. Gene | |||
| 6 | rs10838269 | 11:44378010 | ALX4 | rs11175967 | 12:66321344 | HMGA2 | 23.9422 | 9.94 × 10⁻⁷ |
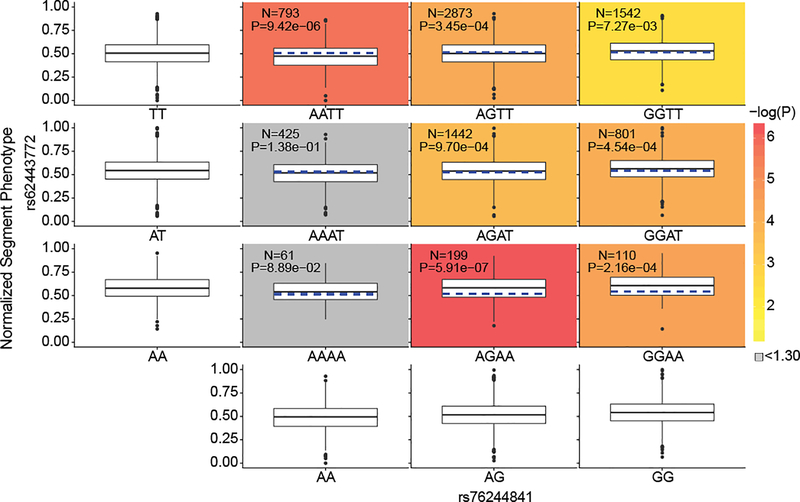
| 9 | rs76244841 | 1:2775953 | PRDM16 | rs62443772 | 7:42131949 | GLI3 | 16.5745 | 4.68 × 10⁻⁶ |
| 11 | rs6740960 | 2:42181679 | PKDCC | rs6795164 | 3:133885925 | SLCO2A1 | 16.3707 | 5.21 × 10⁻⁵ |
| 22 | rs7373685 | 3:128107020 | GATA2 | rs7843236 | 8:121980512 | SNTB1 | 15.7837 | 7.10 × 10⁻⁵ |
Figure 5. Phenotypic and marginal distributions for rs62443772 - rs76244841 epistatic pair.
Plotted in the first column and last row are the marginal phenotypic distributions of the genotypes, which shows the phenotypic distribution that would occur if the two genotypes were acting alone. The median phenotype was also calculated for each diplotype as the average of the marginal medians of the singular genotypes (blue dashed lines on the colored plots). The observed diplotype median (black line on the colored plots) was compared to the expected diplotype median (blue dashed lines on the colored blots) via Mood’s Median test42 with one degree of freedom. The resulting log transformed P value was used to color the boxplots to illustrate significance, unless the difference was non-significant, in which the color was automatically set to grey. Within each colored boxplot is the untransformed Mood’s median P value as well as the number of individuals used for significance testing. Boxplots plot the first and third quartiles, with a dark black line representing the median. Whiskers extend to the largest and smallest values no further than 1.5 × the inter-quartile range from the first and third quartiles, respectively.
Discussion
In their review, Atchley and Hall provided a framework with which we can better understand and describe the development of complex morphological structures. In this analysis, we have focused on one part of this framework and have identified intrinsic genetic factors contributing to normal-range variation in the structure of the human face. By implementing an open-ended multivariate association method, in which the inherent morphological variation within each of these segments drives the association, and by using both standard and modified-for-multivariate follow-up bioinformatic approaches, we describe the association between SNPs and facial traits as well as the likely cellular functions of the regions surrounding these SNPs. We also highlight regions with multiple SNPs affecting different facial phenotypes as well as evidence for multiple SNPs working in concert to produce a single phenotype. Taken in sum, our results illustrate an avenue for investigating the coordinated processes underlying complex morphological structures, like the human face, at a deeper level than single associations between genotype and univariate phenotype.
Overall, our association results reflect patterns from known biological processes. For instance, LD Score regression correlations between segments seem to reflect the shared embryological origins of different parts of the face, indicating that the hierarchical spectral clustering of the face based on structural correlations effectively partitions underlying genetic signals into biologically coherent groups. It is additionally clear from the large number of genome-wide significant SNPs reaching their strongest association in the full face and segment 2 (covering the nose and upper lip) that these facial regions are “hot-spots” for genomic signals (Fig. 1). In general, Quadrant II (representing the nose) and Quadrant IV (representing the forehead and eyes) had the most genome-wide significant lead SNPs reaching lowest significance in segments within each quadrant. This is unsurprising, given the close relationship between visible facial features in those areas and the underlying skeletal structure. Indeed, regions with less correspondence to underlying skeletal structure, like the upper lip (Quadrant I), had many fewer lead SNPs reaching lowest significance in the contained segments, and facial regions with some structural correspondence but still greatly impacted by age and adiposity, like the lower face and cheeks (Quadrant III), had only slightly more.
Reassuringly, the genes located within 500 kb of our genome-wide significant lead SNPs were highly enriched for processes and phenotypes associated with craniofacial development and morphogenesis in humans and mice (Extended Data Fig. 5). Notably, the top human phenotype was oral clefting, indicating a substantial overlap between the genes involved in normal facial variation and those implicated in the most common craniofacial birth defect in humans. Furthermore, many of the surrounding genes to which the genome-wide significant lead SNPs were annotated are known to be involved in pathways relevant for craniofacial development, such as the Wnt signaling and TGFβ pathways (Extended Data Fig. 5B). Our GWAS signals were also enriched for processes associated with limb development and related phenotypes, pointing to a shared genetic architecture between faces and limbs (Extended Data Fig. 5A) and a number of genes near our genome-wide significant loci (e.g. Dlx homeobox genes, BMP genes, and FGFR2) have well-established roles in limb development43. These findings are also supported by the large number of human syndromes that present with both facial and limb malformations44.
For the regions surrounding the 203 genome-wide significant lead SNPs, both CNCCs and embryonic craniofacial tissues showed the highest enrichment in H3K27ac signal (Fig. 2A). These observations are consistent with (a) activity of our 203 genome-wide significant lead SNPS in CNCCs and embryonic craniofacial tissues and (b) an embryonic origin for human facial variation across the timeline of facial development, as CNCCs represent an early time point in facial development whereas the craniofacial tissues represent progressively later time points. In both CNCCs and craniofacial tissue at all sampled developmental stages, regions in the vicinity of the 203 genome-wide significant lead SNPs were significantly enriched for predicted enhancers and not promoters (Fig. 2B and C). This is an especially intriguing result, as recent evidence has described the action of multiple enhancers, each showing different tissue or timing specificity, in modulating expression levels to affect craniofacial development45. Complementing our GREAT analysis results, indicating that some genes near our GWAS peaks are involved in both facial and limb development, a subset of genome-wide significant lead SNPs showed preferential activity in additional in vitro-derived cell types relevant to both the face and the rest of the skeletal system, including osteoblasts, chondrocytes, differentiating skeletal muscle myoblasts, fibroblasts, and keratinocytes (e.g. cluster 3; Fig. 3). Together, these results suggest that genetic variation underlying facial morphology operates by modulating enhancer activity across multiple cell types throughout the timeline of embryonic facial development.
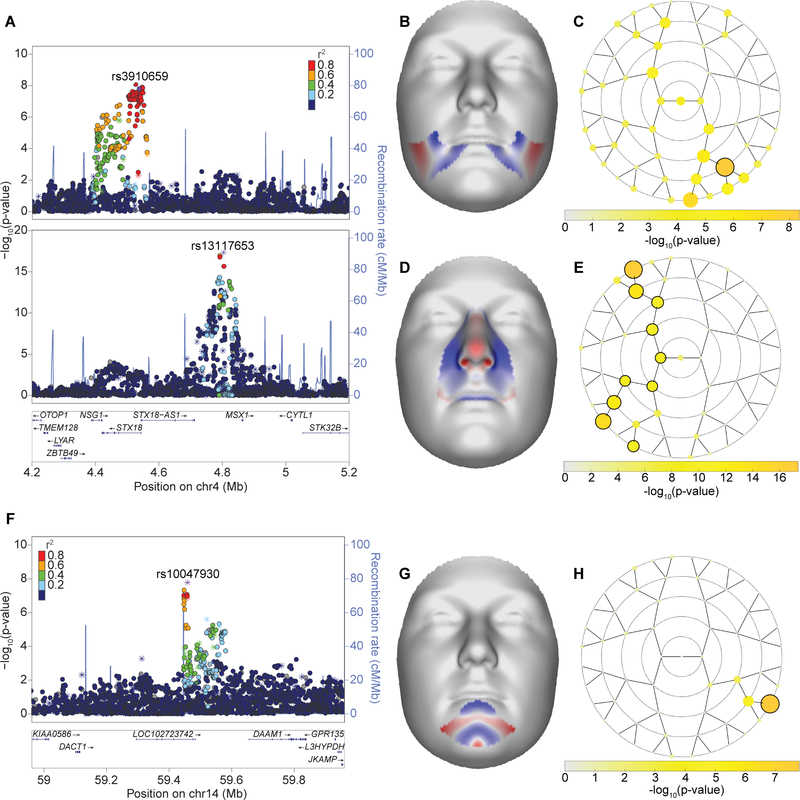
Sixty-one genome-wide significant peaks from our analysis did not overlap with the results of prior GWAS for normal-range facial morphology but were located nearby putative craniofacial genes implicated from human malformations or animal models. For instance, MSX1 has been implicated in orofacial clefting in humans46,47 and mice47,48, and is also widely expressed in lip and dental tissues during development49. We observed two distinct peaks at the MSX1 locus (4p16.2), one approximately 55 kb upstream of MSX1 with a pronounced effect on the lateral upper lip (lead SNP rs13117653; PMeta-US(Seg. 34) = 4.2 × 10⁻¹⁸) and a second peak, about 323 kb upstream of MSX1 and located in the intron of STX18, involving the lateral lower lip and mandible (lead SNP rs3910659; PMeta-UK(Seg. 25) = 4.45 × 10⁻⁹; Extended Data Fig. 9A–E). This result could indicate a potential role of STX18 in craniofacial development, though the STX18 protein is primarily important for functioning of the endoplasmic reticulum. Or this result could provide further evidence that complex phenotypic effects seen in our human sample could be due to the action of multiple regulatory elements within a single locus. In support of this, Attanasio et al., demonstrated that the activity of Msx1 in the second pharyngeal arch and maxillary process of the e11.5 mouse embryo is recapitulated by the combined activity of two separate enhancers45.
We also identified 53 genome-wide significant signals in regions harboring genes with no previously known role in craniofacial development or disease, though many of the implicated genes are known to have a general role in developmental processes critical to morphogenesis. For example, in the current study, variants at the DACT1 locus are associated with mandibular morphology (Extended Data Fig. 9F–H). DACT1 is an established antagonist of the Wnt signaling pathway, which is known to be involved in craniofacial development50, though DACT1 is mostly studied for its involvement in gastric cancer. However, DACT1 has also been shown to inhibit the delamination of neural crest cells, further supporting its involvement in facial development51. These novel signals are promising new candidates of potential roles in facial morphogenesis.
In addition to better understanding which parts of the face had the most signals, we capitalized on the utility of facial segmentation via hierarchical clustering to finely parse out the effect of a SNP even within a complex genomic region. Notably, we observed twenty-four loci with multiple genome-wide significant peaks each associated with different facial traits, suggesting that these variants might overlap with or be impacted by regulatory elements that affect the face in highly specific ways (Supplementary Table 5, Supplementary Data 1). An important consideration to our peak selection procedure is that it is statistical and heuristic in nature, being based on investigator-chosen thresholds of both distance and similarity of associated facial phenotypes, and thus is not perfect. Refining a peak selection approach based on combinations of distance, linkage disequilibrium (LD) patterns, and trait similarity was beyond the grasp of this paper, but we believe such an approach has potential for further interrogating the complex genetic architecture of facial variation, as we have illustrated using the TBX15-WARS2 locus (Fig. 4).
Given the complexity of the human face and its component traits, it is likely that the genetic architecture contributing to facial variation includes groups of genomic regions that contribute to the same facial trait, perhaps through actions in similar cell types or explicit interactions among variants. Importantly, genome-wide significant SNPs that significantly explained variance in the same segment, based on the structural equation model (SEM) for that segment, showed higher correlations of cross-sample H3K27ac activity than when compared to SNPs which did not, indicating that the SEM-refined lists of SNPs for each segment are likely those that are similar in either their spatial or temporal cellular activity (Extended Data Fig. 7). Tests for epistasis using the SEM-refined SNP lists for each segment identified four SNP combinations with significant evidence of pairwise epistatic interactions (Table 1). For example, rs76244841 (PRDM16 associated; PMeta-UK(Seg. 30) = 1.48 × 10⁻⁸) and rs62443772 (GLI3 associated; PMeta-UK(Seg. 22) = 5.35 × 10⁻¹⁶) were found to have a significant interaction in facial segment 9, which covers the premaxillary soft tissue from the base of the columella to the oral commissure (Table 1; Fig. 5). Interestingly, PRDM16 and GLI3 are both part of a tetrameric Hedgehog signaling complex in Drosophila melanogaster (Supplementary Note 3)52–54. Overall, these results indicate that the statistical evidence of SNP groups influencing polygenic facial variation identified through SEM, and explicit variant interactions suggested by the epistasis analysis, are potentially representative of true biological relationships but must be confirmed with further study.
In conclusion, with this work we have not only reported genomic variants influencing normal-range facial variation, but have also sought to use our in-depth facial phenotyping approach and bioinformatic tools to illustrate one way in which researchers without access to functional follow-up analyses can delve deeper into the genetic architecture of complex morphological traits. These results illustrate the potential to highlight spatial and temporal connections between SNPs, representing a major step forward in our ability to characterize the polygenic genetic architecture of complex morphological structures. In performing an open-ended and minimally restrictive study, we are optimistic that our results will be useful for other research efforts to better understand the biological forces that shape human and non-human morphology.
Methods
Sample and recruitment
The samples used for analysis included a combination of three independently collected datasets from the United States (US; nUS = 4,680) and one dataset from the United Kingdom (UK; nUK = 3,566), for a total sample size of n = 8,246. The US samples originated from the 3D Facial Norms cohort55 (3DFN) and studies at the Pennsylvania State University (PSU) and Indiana University-Purdue University Indianapolis (IUPUI). The UK dataset included samples from the Avon Longitudinal Study of Parents and their Children (ALSPAC)56,57. Institutional review board approval was obtained at each recruitment site, and all participants gave their written informed consent prior to participation. For children, written consent was obtained from a parent or legal guardian. Some individuals from the 3DFN and PSU samples were previously tested for associations with facial morphology in our prior work16. A breakdown of the samples used for analysis is shown in Supplementary Table 2 and further details are available in the Supplementary Methods. In all datasets, participants with missing information in sex, age, height, weight, or with insufficient image quality were removed.
Genotyping and imputation
Due to the several genotyping platforms used for the US cohort (details in the Supplementary Methods), we chose to impute the samples from each platform separately, then combine the imputed results58. For each dataset, standard data cleaning and quality assurance practices were performed based on the GRCh37 genome assembly. Phasing was performed using SHAPEIT2 (v2.r900)59 and imputation to the 1000G Phase 3 reference panel60 performed using the positional Burrows-Wheeler Transform61 pipeline (v3.1) of the Sanger Imputation Server (v0.0.6)62. After post-imputation quality control and intersection of imputed SNPs, a single merged dataset of all US participants was created with 7,417,619 SNPs for analysis.
The raw genotype data from ALSPAC were not available and restrictions are in place against merging the ALSPAC genotypes with any others. For this reason, ALSPAC genotypes, phased using SHAPEIT259 and imputed to the 1000G Phase 1 reference panel (Version 3)63 using IMPUTE264, were obtained directly from the ALSPAC database and held separately during the analysis. After post-imputation quality control, the ALSPAC dataset contained 8,629,873 SNPs for analysis.
For both datasets, SNPs on the X chromosome were coded 0/2 for hemizygous males, to match with the 0/1/2 coding for females12.
Ancestry axes and selection of European participants
From the post-imputation merged dataset of US participants, we identified the European participants by projecting them into a principal component (PC) space constructed using the 1000G Phase 3 dataset, first filtered for linkage disequilibrium and SNPs shared between both datasets. Further details are available in the Supplementary Methods. In the combined PC space, we calculated the ancestry axes for the US participants and the Euclidean distance between all US participants and the 1000G samples. Using a k-th nearest neighbor algorithm, we identified the five nearest 1000G neighbors for each US participant. The most common 1000G population label from these five nearest neighbors was then assigned to the US participant and participants assigned the 1000G European population labels of CEU, TSI, FIN, GBR, and IBS were selected for analysis.
Ancestry axes were calculated for the UK participants by projecting them into the 1000G Phase 3 dataset in a similar manner as described for the US participants. Since all ALSPAC participants available for this analysis were European, no additional ancestry refinement was performed.
3D image acquisition
For all datasets, 3D images were captured using either a digital facial stereophotogrammetry system or a laser scanning system. All participants were asked to have closed mouths and to maintain a neutral facial expression during image capture65. For the 3DFN sample, facial surfaces were acquired using the 3dMDface (3dMD, Atlanta, GA) camera system. PSU images were obtained with either the 3dMDface or Vectra H1 system (Canfield Scientific, Parsippany, NJ). The IUPUI sample was fully imaged using Vectra H1. The ALSPAC sample was imaged using a Konica Minolta Vivid 900 laser scanner (Konica Minolta Sensing Europe, Milton Keynes, UK). For this system, two high-resolution facial scans were taken and then processed, merged, and registered using a macro algorithm in Rapidform™ 2004 software (INUS Technology Inc., Seoul, South Korea).
3D image registration and quality control
3D surface images and their reflections were registered using the MeshMonk registration framework (v0.0.6)24 in Matlab 2017b. This process results in a homologous configuration of 7,160 spatially dense quasi-landmarks, allowing the image data from different individuals and camera systems to be standardized24. Images greatly differing from the norm or with large holes were manually investigated and either removed or re-processed, with details available in the Supplementary Methods. Although variation in asymmetric facial features is of interest, in this work we sought to only study variation in symmetric facial shape.
Segmentation of facial shape
To study global and local effects on facial variation, we performed a data-driven facial segmentation on the UK and US datasets combined, as described previously16. Before segmentation, images in the two datasets were separately adjusted for sex, age, age-squared, height, weight, facial size, the first four genomic ancestry axes, and the camera system, using PLSR (function plsregress from Matlab 2017b). As an illustration, the age adjustment is visualized in Supplementary Fig. 2. After adjustment, facial segments were defined by grouping vertices that are strongly correlated using hierarchical spectral clustering16,25. The strength of covariation between quasi-landmarks was defined using Escoufier’s RV coefficient66,67. The RV coefficient was then used to build a structural similarity matrix that defined the hierarchical construction of 63 facial segments, broken into five levels (Extended Data Fig. 1A). The configurations of each segment were then independently subjected to a Generalized Procrustes analysis68, after which a PCA was performed in combination with parallel analysis to capture the major variance in the facial segments with fewer variables26,27 (Extended Data Fig. 1B).
Multivariate genome-wide association meta-analyses
The meta-analysis framework utilized consists of three steps performed separately for each of the 63 segments: identification, verification, and meta-analysis (Extended Data Fig. 2). For all analyses, the genotypes were coded additively based on the presence of the major allele. In the identification step, for each of the 63 facial segments, each SNP was associated with phenotypic variation using canonical correlation analysis (CCA, canoncorr in Matlab 2017b). CCA is a multivariate analysis which extracts the linear combination of PCs, which represent the direction of phenotypic effect in shape space (i.e. a trait), that are maximally correlated with a SNP and returns a correlation value between those PCs and the SNP tested. Because CCA does not accommodate adjustments for covariates, we removed the effect of relevant covariates (sex, age, age-squared, height, weight, facial size, the first four genomic ancestry axes, and the camera system), on both the independent (SNP) and the dependent (facial shape) variables using PLSR (plsregress from Matlab 2017b), and thus performed the CCA under a reduced model with residualized variables. The correlation value between PCs and SNPs is tested for significance based on Rao’s F-test approximation69 (right tail, one-sided test). In sum, for each of the 63 segments, the CCA component of the identification step identifies the phenotypic trait most correlated with each SNP (TraitUS and TraitUK in Extended Data Fig. 2) and Rao’s F-test provides a P value (PCCA-US and PCCA-UK) representing the strength of the correlation. CCA has also been implemented in `mv-PLINK`70. Performance tests of mv-PLINK have found that it outperforms univariate methods and has similar power to other multivariate methods of association70–72, which generally have higher statistical power than univariate methods70–76.
In the verification step, the shape PCs of the non-identification dataset were projected onto the trait found in the identification stage, which returns a univariate variable (UniVarUS and UniVarUK). These univariate variables were then tested for genotype-phenotype associations in a standard linear regression (regstats in Matlab 2017b) with the SNP genotypes of the verification dataset as independent variable and the univariate trait projection score as the dependent variable. This function employs a t-statistic and a one-sided (right-tail) P value was obtained with the Student’s T cumulative distribution function77 (function tcdf in Matlab 2017b).
In the meta-analysis step, the identification P value (from Rao’s F-test on the canonical correlation) and the verification P value (from the univariate regression) were combined using Stouffer’s method28,29, chosen because a meta-analysis of beta values was not possible given that the CCA returns a positive correlation value, not beta statistic. The entire process was repeated, resulting in two meta-analysis P values (PMeta-US and PMeta-UK) accompanied by two identified traits per segment and per SNP: first using US in the identification stage and UK as verification (METAUS or US-driven), then using UK in the identification stage and US as verification (METAUK or UK-driven). A validation of our analysis pipeline is available in Supplementary Note 1.
Sharing of genome-wide signal between facial segments
To assess the extent to which genome-wide signals of association with facial variation were shared between a pair of facial segments, LD score regression30,31 was applied to the meta-analysis, after converting the meta P values to z-scores and ignoring the sign or direction of effect. The former was required because of the multivariate nature of our results and the latter was needed since CCA is a one-sided test with canonical correlations always between [0 1]. As a result, all resulting genetic correlations reported here are restricted to be positive as well. Further details on the calculation of LDSC values is available in the Supplementary Methods. This process was done twice, once each for the US- and UK-driven meta-analyses. A high degree of congruence (rS = 0.95) between the results based on the US- and UK-driven meta-analyses was observed, and the average correlation of both between each pair of facial segments was reported. The 63 × 63 matrix of average correlations was visualized on top of the facial segmentation hierarchy to assess correlation both within and between facial quadrants (Extended Data Fig. 3) and used to perform average-linkage hierarchical clustering (Extended Data Fig. 4).
GWAS peak selection
The analysis strategy yielded 126 meta-analysis P values and 126 traits for every SNP, representing the 63 segments × two meta-analysis tracks. Per SNP, the lowest P value was selected, and we noted in which meta-analysis track (METAUS or METAUK; “Best meta-analysis track”) and segment (“Best Segment”) this P value occurred. The study-wide Bonferroni threshold (P ≤ 6.96 × 10⁻¹⁰) was calculated as 5 × 10⁻⁸ / (1.0042 × 1.6631 × 43.0145), with the denominator values representing the number of independent tests per SNP, across both meta-analysis tracks, and across all segments, respectively. These values were calculated using 10,000 permutations each of 1,000 random SNPs, with more details available in Supplementary Note 2 and the permutation outcomes available in the FigShare repository for this manuscript34. Though a study-wide threshold was calculated, we chose to annotate lead SNPs reaching at least genome-wide threshold to retain as many potentially biologically meaningful results as possible. The FigShare repository also provides information on all SNPs reaching suggestive significance (P = 5 × 10⁻⁷) as well as QQ-plots for each segment in all stages of the analysis34. For the initial peak selection, we chose to group SNPs below genome-wide threshold by genomic position and the SNP with the lowest P value per genomic region was selected as the lead SNP. Within a ± 500-kb window of the resulting genome-wide significant lead SNPs, we further refined the selection by performing a regression of slopes on the traits defined in the identification stage (in Best meta-analysis track and Best Segment) to determine if adjacent SNPs showed consistent effects with the lead SNP, resulting in 218 genome-wide significant lead SNPs. Of these 218 lead SNPs, 203 showed consistent traits in the US and UK datasets in the Best Segment (Supplementary Table 3), with more details in the Supplementary Methods. Visual representations of the LocusZoom33 and effect plots for each of the 203 genome-wide significant SNPs are available in the FigShare repository34. The 203 lead SNPs were mapped to 138 cytogenetic bands (i.e. loci) using the Ensembl GRCh37 locations78. This method of peak selection is statistical in nature and is thus not perfect. For example, our inspection of the LocusZoom33 plots for the TBX15-WARS2 locus led to the identification of two clusters of SNPs, based on r2 correlation, sharing the same genomic positions and affecting different facial segments, but separating these two clusters was not possible in our initial peak selection and they were considered a single signal until manual investigation. To comprehensively identify SNPs within a locus contributing to facial morphology, and the specific facial segments affected, fine mapping and other detailed investigations are needed.
Gene annotation
Genes ±500 kb of the genome-wide significant lead SNPs were identified using the Table Browser of the UCSC Genome Browser79. The most likely candidate gene per lead SNP was identified based on a three-step system using first literature searches, then the results from Hooper et al., on the transcriptomics of mouse facial development80, then the FUMA gene prioritization algorithm (v1.3.3)37. Further details are available in the Supplementary Methods. Using the available literature, we classified the lead SNP into one of five categories: “Region previously implicated in normal-range facial morphology,” “Region previously implicated in normal-range facial morphology using other analyses of these data,” “Candidate gene implicated in craniofacial morphology through animal model,” “Region or candidate gene implicated in craniofacial morphology through human dysmorphology,” and “No previous association.” To the best of our knowledge, all links with facial morphology from the literature are provided in Supplementary Table 3.
To investigate the potential roles of the identified genome-wide significant lead SNPs, analyses using FUMA (v1.3.3)37, which can test for enrichment of a set of genes in pre-defined pathways, and GREAT (v3.0.0)36, which predicts the function of cis-regulatory regions, were performed using preset parameters (Extended Data Fig. 5). In this manuscript, we focus on the top FUMA and GREAT results, based on P value, and have provided the full export of GREAT results in the FigShare repository34.
Cell-type-specific enhancer enrichment
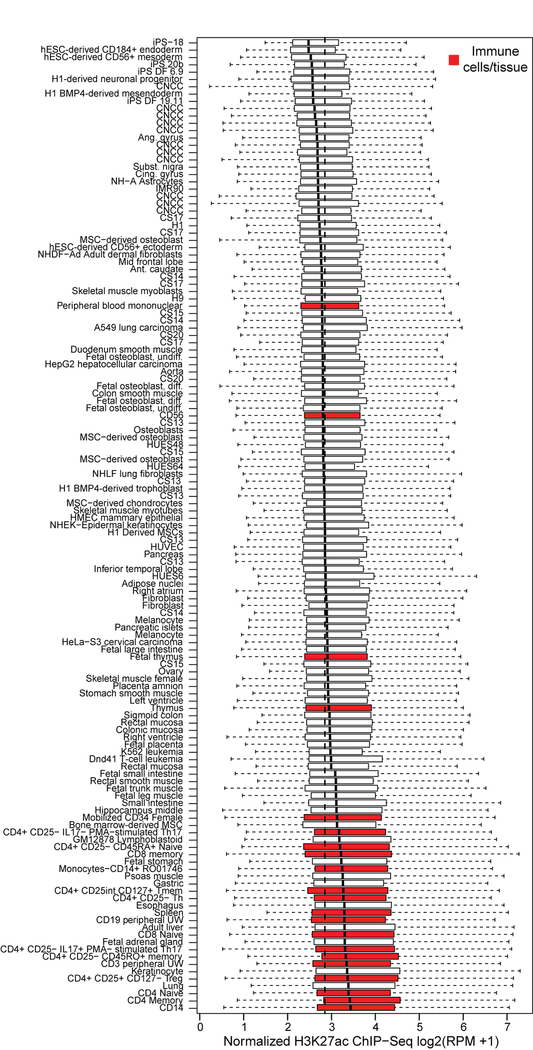
To assess activity of the 203 genome-wide significant lead SNPs in various cell types and tissues (further details in the Supplementary Methods), we analyzed signals of acetylation of histone H3 on lysine 27 (H3K27ac). Across cell types and tissues, we compared 20-kb windows containing the 203 genome-wide significant lead SNPs, 203 random SNPs matched for minor allele frequency and distance to the nearest gene using SNPsnap81, or 619 Crohn’s disease-associated SNPs from the NCBI-EBI GWAS catalog82. Regions in the vicinity of SNPs associated with Crohn’s disease showed the highest H3K27ac signal in various immune cell types, serving as a positive control for both our approach and dataset (Extended Data Fig. 10). A two-sided Wilcoxon rank-sum test was used to compare the H3K27ac signal between the 203 genome-wide significant lead and random SNPs, within each cell type and tissue analyzed. K-means clustering was performed on the lead SNP H3K27ac signal across all cell-types and tissues with k = 6, as we found that this value maximized the number of clusters without significantly impacting cluster quality, as measured by silhouette width (Fig. 3).
Chromatin state association in CNCCs and embryonic craniofacial tissue
Lists of human CNCC regulatory elements were annotated based on multiple chromatin marks by Prescott et al.41 and embryonic craniofacial chromHMM states were computed in combined data from each Carnegie stage by Wilderman et al.40. For each set of regulatory regions, all regions within 20 kb of either genome-wide significant lead SNPs or the above-described 203 random SNPs were considered. Enrichment/depletion of each class of regulatory region for lead SNPs versus random SNPs was computed using a two-sided Fisher’s exact test (Fig. 2B, C).
Structural Equation Modeling
To better define the cause-effect relationships between the significant genotypes and their collective traits, both the US and UK participants were used as input for structural equation modeling (SEM) using the lavaan package (v0.6–3) in R (≥ 3.5.0)83, which reports a two-sided P value. For our analyses, separate SEM models were constructed for each segment using each of the 203 genome-wide significant lead SNPs and the shape PCs for all participants, with additional information available in the Supplementary Methods.
For each of the 50 SEM models where the refinement process was successful (details in the Supplementary Methods), final model fit indices and model parameter estimates are provided in Supplementary Data 2. Reassuringly, for segments that are closely related in the segmentation hierarchy (i.e. segments 5, 11, 23, and 47) there is an average overlap of 46% of the variants meeting the P < 0.05 cutoff for SEM significance, compared to 13.6% average overlap for non-hierarchically related segments (i.e. segments 5 and 6). The H3K27ac activity across all cell types was compared for significant variants both within and between segments using Spearman’s rho using two-sided Kruskal-Wallis tests (Extended Data Fig. 7).
Epistasis Analysis
We additionally used the univariate latent variable and the variants passing the P < 0.05 significance cutoff from the final 50 refined SEM models (P < 0.1 for segments 7, 16, and 25) to assess whether interactions between genotypes increase or decrease the distribution of the latent variable. For each segment, the effect on the latent variable of all diplotype combinations of variants were assessed via a linear regression epistasis analysis in Plink 1.984. After Bonferroni correction for multiple testing, four SNP pairs were significant at P < 0.05 (Table 1). For these four pairs, the nine diplotype combinations and their normalized phenotypic and marginal distributions were plotted (Fig. 5; Extended Data Fig. 8) to assess the genotypic contribution to epistatic masking (i.e. the combination of two variants reduce the phenotype) and boosting (i.e. the combination of two variants increase the phenotype). For each diplotype combination, the marginal phenotypic medians of the singular genotypes were averaged to visualize the predicted phenotypic distribution that would occur if the two genotypes were acting independently and this average median was compared to the medians of the combined diplotypes. Significance testing was performed using a two-sided Mood’s Median test42 with one degree of freedom. These steps were performed using the R packages agricolae (v1.3–0), cowplot (v1.0.0), ggplot2 (v3.1.1), ggpubr (v0.2), gridExtra (v2.3), gtable (v0.3.0), grid (v3.6.2), Hmisc (v4.2–0), psych (v1.8.12), and data.table (v1.12.0).
Data and code availability statement:
All of the genotypic markers for the 3DFN dataset are available to the research community through the dbGaP controlled-access repository (http://www.ncbi.nlm.nih.gov/gap) at accession #phs000949.v1.p1. The raw source data for the phenotypes - the 3D facial surface models in .obj format - are available through the FaceBase Consortium (https://www.facebase.org) at accession #FB00000491.01. Access to these 3D facial surface models requires proper institutional ethics approval and approval from the FaceBase data access committee. Additional details can be requested from S.M.W.
The participants making up the PSU and IUPUI datasets were not collected with broad data sharing consent. Given the highly identifiable nature of both facial and genomic information and unresolved issues regarding risk to participants, we opted for a more conservative approach to participant recruitment. Broad data sharing of the raw data from these collections would thus be in legal and ethical violation of the informed consent obtained from the participants. This restriction is not because of any personal or commercial interests. Additional details can be requested from M.D.S. and S.W. for the PSU and IUPUI datasets, respectively.
The ALSPAC (UK) data will be made available to bona fide researchers on application to the ALSPAC Executive Committee (http://www.bris.ac.uk/alspac/researchers/data-access). Ethical approval for the study was obtained from the ALSPAC Ethics and Law Committee and the Local Research Ethics Committees.
KU Leuven provides the MeshMonk (v0.0.6) spatially dense facial mapping software, free to use for academic purposes (https://github.com/TheWebMonks/meshmonk). Matlab 2017b implementations of the hierarchical spectral clustering to obtain facial segmentations are available from a previous publication25 (https://doi.org/10.6084/m9.figshare.7649024).
The statistical analyses in this work were based on functions of the statistical toolbox in Matlab 2017b, SHAPEIT2 (v2.r900), Sanger Imputation Server (v0.0.6), PBWT pipeline (v3.1), MeshMonk (v0.0.6), LDSC (v1.0.1), FUMA (v1.3.3), GREAT (v3.0.0), Plink 1.9, lavaan (v0.6–3), R (>v3.4), agricolae (v1.3–0), cowplot (v1.0.0), ggplot2 (v3.1.1), ggpubr (v0.2), gridExtra (v2.3), gtable (v0.3.0), grid (v3.6.2), Hmisc (v4.2–0), psych (v1.8.12), data.table (v1.12.0), Genotype Harmonizer (v1.4.20), KING (v2.1.3), bowtie2 (v2.3.4.2), bedtools (v2.27.1), and Bioconductor (v3.7), as mentioned throughout the Methods. Publicly available data used were: the 1000G Phase 3 data (ftp://ftp.1000genomes.ebi.ac.uk/vol1/ftp/release/20130502/), the list of HapMap 3 SNPs excluding the MHC region (http://ldsc.broadinstitute.org/static/media/w_hm3.noMHC.snplist.zip), and ChIP-seq files from Prescott et al.41 (GSE70751), Najafova et al.85 (GSE82295), Baumgart et al.86 (GSE89179), Nott et al.87 (https://genome.ucsc.edu/s/nottalexi/glassLab_BrainCellTypes_hg19), Pattison et al.88 (GSE119997), Wilderman et al.40 (GSE97752), and the Roadmap Epigenomics Project89 (https://egg2.wustl.edu/roadmap/data/byFileType/alignments/consolidated/). Meta-analysis GWAS statistics are available on GWAS Catalog (GCP000044). All relevant data to run future replications and meta-analysis efforts are provided in the FigShare repository for this work34, along with additional figures (https://doi.org/10.6084/m9.figshare.c.4667261). Items available in the FigShare repository are: (1) Anthropometric mask: a Matfile of the anthropometric mask used; (2) Association statistics and effects of the 203 lead SNPs: Facial effects, LocusZoom plots, and association statistics from each stage of the analysis for the 203 lead SNPs; (3) Calculation of study-wide significance threshold: Script and permutation outcomes needed to replicate the calculation of the study-wide significance threshold; (4) Facial segment assignments: Segment assignments for each quasi landmark in the anthropometric mask; (5) Figure 2A labeled: A larger version of Figure 2A, with all cell types and tissues labeled; (6) GREAT Export: Raw output of the GREAT analysis; (7) PCA shape constructs: PCA shape spaces for all 63 facial segments; (8) QQ plots: QQ plots for each segment in all stages of the analysis; (9) Script to explore facial segments and GWAS hits: MatLab script for select data exploration functions; (10) SNPs reaching suggestive significance in either meta-analysis track: Association statistics of all SNPs with P < 5 × 10⁻⁷ in METAUS or METAUK tracks; (11) Source data for manuscript figures: Source data in Excel format for all figures, where possible.
Extended Data
Extended Data Fig. 1: Hierarchical spectral clustering of facial shape.
(A) Global to local facial segmentation of all 3D images (nTotal = 8,246), obtained using hierarchical spectral clustering. Segments are colored in teal and identical to those in Figure 1. Roman numerals represent “quadrants” of facial segments. (B) The number of principal components retained after parallel analysis for each facial segment.
Extended Data Fig. 2: Study design.
Sample Wrangling: Images and genotypes from each study were intersected and unrelated participants of European ancestry, with quality-controlled images, covariates, and imputed genetic data were selected to obtain the analyzed data. Identification: For each facial segment, canonical correlation analysis (CCA) and Rao’s F test approximation was used to identify the multivariate combination of facial principal components most correlated with the genotypes, which led to a P value (PCCA-US or PCCA-UK) and multivariate phenotypic trait most correlated with each SNP (TraitUS and TraitUK). Verification: The principal components of the other dataset were then projected onto this trait to obtain a univariate variable representing the distribution of participants from the verification dataset for the trait identified in the identification dataset (UniVarUK and UniVarUS). The genotypes of the verification dataset are then tested against this variable via linear regression, resulting in an additional P value (PUniVar-UK and PUniVar-US). Meta-Analysis: The P values from identification and verification are meta-analyzed using Stouffer’s method, resulting in the final set of P values from each meta-analysis track (PMETA-US and PMETA-UK).
Extended Data Fig. 3: Genomic signal correlations.
LDSC correlations between segments. (A) Correlations between segments from different quadrants, ranging from 0.8 to 0.88, which seem to reflect both physical proximity of segments on the face and shared embryological origins. (B) Correlations ranging from 0.88 to 1, which are mostly between segments within the same facial quadrant.
Extended Data Fig. 4: Clustering of facial segments on the basis of shared genetic signals.
Correlations between facial segments on the basis of SNP P values were calculated using LDSC, as described in Methods, and average linkage hierarchical clustering was performed using the matrix of correlation values. Quadrant colors in legend refer to the quadrant of the polar dendrogram in which the facial segment lies in, also represented by the facial images at the top, and embryonic facial prominences are assigned to each facial segment.
Extended Data Fig. 5: GREAT and FUMA analyses showing enrichment for craniofacial and limb development.
(A) GREAT analysis. For the top ten GO terms in each category, plotted is the binomial test Bonferroni-corrected P value (red; negative values) and binomial region fold enrichment (blue; positive values). Behind every GO term, in parentheses we indicate the number of genes in the test set with the annotation (Observed) and the total number of genes in the genome with the annotation (Total), with the format (Observed/Total). Dashed line represents significance at P = log10(0.05) = −1.3. (B) FUMA analysis, indicating the KEGG pathways that were significantly enriched in our results. Multiple pathways are relevant for craniofacial development. The right panel shows the genes that are involved in the pathways.
Extended Data Fig. 6: H3K27ac signal is significantly different in 203 lead vs. 203 random SNPs for relevant facial tissues.
For all cell-types and tissues, each represented by a point above, the median difference between H3K27ac RPM signal between the 203 lead SNPs vs. 203 random SNPs was tested for significance using a two-sided Wilcoxon rank-sum test. The thin dashed line represents the 5% false discovery rate P value of 0.0094, using the Benjamini-Hochberg method. Relative to the random, MAF-matched SNPs, the lead SNPs are significantly enriched for H3K27ac signal in many cell types, with the highest magnitude differences being from CNCCs (blue) and embryonic craniofacial tissues (orange). Test statistics used to create this plot are available in Supplementary Table 4.
Extended Data Fig. 7: Correlation of H3K27ac activity among SEM models.
(A) For all segments (aka “masks”), we compared the H3K27ac activity for significant SNPs from the refined SEM model for variation in that facial segment. Plotted is the Spearman’s rho correlation between pairs of SNPs significant in the same SEM model (“Within Mask”); pairs of SNPs where one is from the SEM model and the other is not (“Within To Out”), and where both SNPs in the pair are from a different SEM model (“Out To Out”). Segments where the distribution of correlation across all cell types was significantly different (Benjamini-Hochberg adjusted P < 0.05) based on a two-sided Kruskal-Wallis test are indicated in black. (B) For all cell types, the median correlation across all segments is plotted for each of the three SNP groupings. Significance between the means was determined using a two-sided Kruskal-Wallis test. Boxplots plot the first and third quartiles, with a dark black line representing the median. Whiskers extend to the largest and smallest values no further than 1.5 × the inter-quartile range from the first and third quartiles, respectively.
Extended Data Fig. 8: Phenotypic and marginal distributions for diplotype combinations.
For a random SNP pairing (A) and each significant epistasis pair (B-D), boxplots are plotted to visualize the epistatic effect on the phenotype. The marginal phenotypic medians of the singular genotypes (non-shaded boxplots) were used to calculate and visualize the predicted diplotype phenotypic distribution that would occur if the two genotypes were acting alone. The median phenotype was also calculated for each diplotype as the average of the marginal medians of the singular genotypes (blue dashed lines on the colored plots). This median was compared to the observed medians of the diplotypes (solid black lines; colored boxplots) via Mood’s Median test with one degree of freedom. Log transformed P values were used to color boxplots if there was a significant (P < 0.05; log(P) > 1.30) difference between the expected phenotype of the combined genotype and observed diplotype. Boxplots plot the first and third quartiles, with a dark black line representing the median. Whiskers extend to the largest and smallest values no further than 1.5 × the inter-quartile range from the first and third quartiles, respectively.
Extended Data Fig. 9: MSX1 and DACT1 loci.
LocusZoom plots for the two association signals nearby MSX1 (A), which has previously been implicated in orofacial clefting in humans and mice, and DACT1 (F), which is a novel result. Points represent one-sided -log10(P) of the METAUK meta-analysis track for the facial segment illustrated in the normal displacement figures (B, D, G) and are colored based on linkage disequilibrium with the labeled SNP. Asterisks indicate genotyped SNPs and circles indicate imputed SNPs. Facial effects for the two association signals nearby MSX1: rs3910659 (B) and rs13117653 (D) and the signal nearby DACT1: rs10047930 (G). Effects are the normal displacement (displacement in the direction locally normal to the facial surface) in each quasi landmark of the lowest facial segment reaching genome-wide significance in METAUK, going from the minor to the major allele. Blue indicates inward depression; red indicates outward protrusion. Yellow rosette plots depict the -log10(P) of the meta-analysis P value (one-sided, right-tailed) per facial segment in METAUK track. Black-encircled facial segments have reached genome-wide significance (P = 5 × 10⁻⁸). (C) rs3910659; (E) rs13117653; (H) rs10047930.
Extended Data Fig. 10: Regions nearby previously published SNPs associated with risk for Crohn’s disease are preferentially active in immune cells and tissues.
Each boxplot represents the distribution of H3K27ac signal in 20 kb regions around 619 Crohn’s disease-associated SNPs from the NCBI-EBI GWAS catalog in one sample. See Methods for details on calculation of H3K27ac signal. Samples corresponding to immune cells and tissues are highlighted in red. Thin dashed line at ~2.9 is the median level of signal across all cell-types and tissues. Boxplots plot the first and third quartiles, with a dark black line representing the median. Whiskers extend to the largest and smallest values no further than 1.5 × the inter-quartile range from the first and third quartiles, respectively.
Supplementary Material
Acknowledgements
We are extremely grateful to all the individuals and families who took part in this study, the midwives for their help in recruiting them, and the whole ALSPAC team, which includes interviewers, computer and laboratory technicians, clerical workers, research scientists, volunteers, managers, receptionists and nurses. We are also very grateful to all of the US participants for generously donating their time to our research, and to present and former laboratory members who worked tirelessly to make these analyses possible.
Pittsburgh personnel, data collection, and analyses were supported by the National Institute of Dental and Craniofacial Research (U01-DE020078, PD/PIs: Marazita/Weinberg; R01-DE016148, PD/PIs: Marazita/Weinberg; and R01-DE027023, PD/PIs: Weinberg/Shaffer). Funding for genotyping by the National Human Genome Research Institute (X01-HG007821 and X01-HG007485, PD/PI: Marazita) and funding for initial genomic data cleaning by the University of Washington provided by contract HHSN268201200008I from the National Institute for Dental and Craniofacial Research awarded to the Center for Inherited Disease Research (https://www.cidr.jhmi.edu/).
Penn State personnel, data collection, and analyses were supported by Procter & Gamble, Company (UCRI-2015–1117-HN-532, PD/PIs: Norton), the Center for Human Evolution and Development at Penn State, the Science Foundation of Ireland Walton Fellowship (04.W4/B643, PD/PI: Shriver), the US National Institute of Justice (2008-DN-BX-K125, PD/PI: Shriver; and 2018-DU-BX-0219, PD/PIs: Walsh), and by the US Department of Defense.
IUPUI personnel, data collection, and analyses were supported by the National Institute of Justice (2015-R2-CX-0023, 2014-DN-BX-K031, and 2018-DU-BX-0219, PD/PI: Walsh).
University of Cincinnati personnel and data collection were supported by Procter & Gamble, Company (UCRI-2015–1117-HN-532, PD/PI: Norton).
The UK Medical Research Council and Wellcome (Grant ref: 102215/2/13/2) and the University of Bristol provide core support for ALSPAC. The publication is the work of the authors and K.I. and P.C. will serve as guarantors for the contents of this paper. A comprehensive list of grants funding is available on the ALSPAC website (http://www.bristol.ac.uk/alspac/external/documents/grant-acknowledgements.pdf). ALSPAC GWAS data was generated by Sample Logistics and Genotyping Facilities at Wellcome Sanger Institute and LabCorp (Laboratory Corporation of America) using support from 23andMe.
The KU Leuven research team and analyses were supported by the National Institute of Dental and Craniofacial Research (R01-DE027023, PD/PIs: Weinberg/Shaffer), The Research Fund KU Leuven (BOF-C1, C14/15/081 and C14/20/081, PD/PI: Claes), The Research Program of the Research Foundation – Flanders (FWO, G078518N, PD/PI: Claes), and a Senior Clinical Investigator Fellowship of The Research Foundation – Flanders (G078714N, PD/PI: Hens).
Stanford University personnel and analyses were supported by the National Institute of Dental and Craniofacial Research (R01-DE027023, PD/PIs: Weinberg/Shaffer; and U01-DE024430, PD/PIs: Wysocka/Selleri), the Howard Hughes Medical Institute, and the March of Dimes Foundation (1-FY15–312, PD/PI: Wysocka).
Footnotes
Competing Interests
H.L.N. has received $6,000 in consulting fees from Procter & Gamble, Company. Procter & Gamble, Company had no role in the conceptualization, design, data analysis, decision to publish, or preparation of this manuscript. All other authors declare no competing interests.
References
- 1.Atchley WR & Hall BK A model for development and evolution of complex morphological structures. Biol. Rev. 66, 101–157 (1991). [DOI] [PubMed] [Google Scholar]
- 2.Gratten J, Wray NR, Keller MC & Visscher PM Large-scale genomics unveils the genetic architecture of psychiatric disorders. Nat. Neurosci. 17, 782–790 (2014). [DOI] [PMC free article] [PubMed] [Google Scholar]
- 3.Timpson NJ, Greenwood CMT, Soranzo N, Lawson DJ & Richards JB Genetic architecture: the shape of the genetic contribution to human traits and disease. Nat. Rev. Genet. 19, 110–124 (2018). [DOI] [PubMed] [Google Scholar]
- 4.Weinberg SM et al. Hunting for genes that shape human faces: Initial successes and challenges for the future. Orthod. Craniofac. Res. 22, 207–212 (2019). [DOI] [PMC free article] [PubMed] [Google Scholar]
- 5.Weinberg SM, Cornell R & Leslie EJ Craniofacial genetics: Where have we been and where are we going? PLOS Genet. 14, e1007438 (2018). [DOI] [PMC free article] [PubMed] [Google Scholar]
- 6.Dixon MJ, Marazita ML, Beaty TH & Murray JC Cleft lip and palate: understanding genetic and environmental influences. Nat. Rev. Genet. 12, 167–178 (2011). [DOI] [PMC free article] [PubMed] [Google Scholar]
- 7.Paternoster L et al. Genome-wide association study of three-dimensional facial morphology identifies a variant in PAX3 associated with nasion position. Am. J. Hum. Genet. 90, 478–485 (2012). [DOI] [PMC free article] [PubMed] [Google Scholar]
- 8.Liu F et al. A Genome-Wide Association Study Identifies Five Loci Influencing Facial Morphology in Europeans. PLOS Genet. 8, e1002932 (2012). [DOI] [PMC free article] [PubMed] [Google Scholar]
- 9.Jacobs LC et al. Intrinsic and Extrinsic Risk Factors for Sagging Eyelids. JAMA Dermatol. 150, 836–843 (2014). [DOI] [PubMed] [Google Scholar]
- 10.Adhikari K et al. A genome-wide association scan implicates DCHS2, RUNX2, GLI3, PAX1 and EDAR in human facial variation. Nat. Commun. 7, 1–11 (2016). [DOI] [PMC free article] [PubMed] [Google Scholar]
- 11.Pickrell JK et al. Detection and interpretation of shared genetic influences on 42 human traits. Nat. Genet. 48, 709–717 (2016). [DOI] [PMC free article] [PubMed] [Google Scholar]
- 12.Shaffer JR et al. Genome-Wide Association Study Reveals Multiple Loci Influencing Normal Human Facial Morphology. PLOS Genet. 12, 1–21 (2016). [DOI] [PMC free article] [PubMed] [Google Scholar]
- 13.Cole JB et al. Genomewide Association Study of African Children Identifies Association of SCHIP1 and PDE8A with Facial Size and Shape. PLOS Genet. 12, e1006174 (2016). [DOI] [PMC free article] [PubMed] [Google Scholar]
- 14.Lee MK et al. Genome-wide association study of facial morphology reveals novel associations with FREM1 and PARK2. PLOS ONE 12, 1–13 (2017). [DOI] [PMC free article] [PubMed] [Google Scholar]
- 15.Crouch DJM et al. Genetics of the human face: Identification of large-effect single gene variants. Proc. Natl. Acad. Sci. U. S. A. 115, E676–E685 (2018). [DOI] [PMC free article] [PubMed] [Google Scholar]
- 16.Claes P et al. Genome-wide mapping of global-to-local genetic effects on human facial shape. Nat. Genet. 50, 414–423 (2018). [DOI] [PMC free article] [PubMed] [Google Scholar]
- 17.Endo C et al. Genome-wide association study in Japanese females identifies fifteen novel skin-related trait associations. Sci. Rep. 8, (2018). [DOI] [PMC free article] [PubMed] [Google Scholar]
- 18.Cha S et al. Identification of five novel genetic loci related to facial morphology by genome-wide association studies. BMC Genomics 19, 481 (2018). [DOI] [PMC free article] [PubMed] [Google Scholar]
- 19.Howe LJ et al. Investigating the shared genetics of non-syndromic cleft lip/palate and facial morphology. PLOS Genet. 14, e1007501 (2018). [DOI] [PMC free article] [PubMed] [Google Scholar]
- 20.Qiao L et al. Genome-wide variants of Eurasian facial shape differentiation and a prospective model of DNA based face prediction. J. Genet. Genomics 45, 419–432 (2018). [DOI] [PubMed] [Google Scholar]
- 21.Wu W et al. Whole-exome sequencing identified four loci influencing craniofacial morphology in northern Han Chinese. Hum. Genet. 138, 601–611 (2019). [DOI] [PMC free article] [PubMed] [Google Scholar]
- 22.Li Y et al. EDAR, LYPLAL1, PRDM16, PAX3, DKK1, TNFSF12, CACNA2D3, and SUPT3H gene variants influence facial morphology in a Eurasian population. Hum. Genet. 138, 681–689 (2019). [DOI] [PubMed] [Google Scholar]
- 23.Xiong Z et al. Novel genetic loci affecting facial shape variation in humans. eLife 8, e49898 (2019). [DOI] [PMC free article] [PubMed] [Google Scholar]
- 24.White JD et al. MeshMonk: Open-source large-scale intensive 3D phenotyping. Sci. Rep. 9, 6085 (2019). [DOI] [PMC free article] [PubMed] [Google Scholar]
- 25.Sero D et al. Facial recognition from DNA using face-to-DNA classifiers. Nat. Commun. 10, 2557 (2019). [DOI] [PMC free article] [PubMed] [Google Scholar]
- 26.Hayton JC, Allen DG & Scarpello V Factor Retention Decisions in Exploratory Factor Analysis: a Tutorial on Parallel Analysis. Organ. Res. Methods 7, 191–205 (2004). [Google Scholar]
- 27.Franklin SB, Gibson DJ, Robertson PA, Pohlmann JT & Fralish JS Parallel Analysis: A Method for Determining Significant Principal Components. J. Veg. Sci. 6, 99–106 (1995). [Google Scholar]
- 28.Stouffer SA, Suchman EA, Devinney LC, Star SA & Williams RM Jr. The American soldier: Adjustment during army life vol. 1 (Princeton Univ. Press, 1949). [Google Scholar]
- 29.Willer CJ, Li Y & Abecasis GR METAL: fast and efficient meta-analysis of genomewide association scans. Bioinforma. Oxf. Engl. 26, 2190–2191 (2010). [DOI] [PMC free article] [PubMed] [Google Scholar]
- 30.Bulik-Sullivan B et al. An atlas of genetic correlations across human diseases and traits. Nat. Genet. 47, 1236–1241 (2015). [DOI] [PMC free article] [PubMed] [Google Scholar]
- 31.Bulik-Sullivan BK et al. LD Score regression distinguishes confounding from polygenicity in genome-wide association studies. Nat. Genet. 47, 291–295 (2015). [DOI] [PMC free article] [PubMed] [Google Scholar]
- 32.Som PM, Streit A & Naidich TP Illustrated review of the embryology and development of the facial region, part 3: an overview of the molecular interactions responsible for facial development. Am. J. Neuroradiol. 35, 223–229 (2014). [DOI] [PMC free article] [PubMed] [Google Scholar]
- 33.Pruim RJ et al. LocusZoom: regional visualization of genome-wide association scan results. Bioinformatics 26, 2336–2337 (2010). [DOI] [PMC free article] [PubMed] [Google Scholar]
- 34.White J & Indencleef K Insights into the genetic architecture of the human face. (2020) doi: 10.6084/m9.figshare.c.4667261. [DOI] [PMC free article] [PubMed] [Google Scholar]
- 35.Krzywinski MI et al. Circos: An information aesthetic for comparative genomics. Genome Res. 19, 1639–1645 (2009). [DOI] [PMC free article] [PubMed] [Google Scholar]
- 36.McLean CY et al. GREAT improves functional interpretation of cis-regulatory regions. Nat. Biotechnol. 28, 495–501 (2010). [DOI] [PMC free article] [PubMed] [Google Scholar]
- 37.Watanabe K, Taskesen E, Bochoven A, van & Posthuma D. Functional mapping and annotation of genetic associations with FUMA. Nat. Commun. 8, 1826 (2017). [DOI] [PMC free article] [PubMed] [Google Scholar]
- 38.Rada-Iglesias A et al. A unique chromatin signature uncovers early developmental enhancers in humans. Nature 470, 279–283 (2011). [DOI] [PMC free article] [PubMed] [Google Scholar]
- 39.Creyghton MP et al. Histone H3K27ac separates active from poised enhancers and predicts developmental state. Proc. Natl. Acad. Sci. U. S. A. 107, 21931–21936 (2010). [DOI] [PMC free article] [PubMed] [Google Scholar]
- 40.Wilderman A, VanOudenhove J, Kron J, Noonan JP & Cotney J High-Resolution Epigenomic Atlas of Human Embryonic Craniofacial Development. Cell Rep. 23, 1581–1597 (2018). [DOI] [PMC free article] [PubMed] [Google Scholar]
- 41.Prescott SL et al. Enhancer divergence and cis-regulatory evolution in the human and chimp neural crest. Cell 163, 68–83 (2015). [DOI] [PMC free article] [PubMed] [Google Scholar]
- 42.Brown GW & Mood AM On Median Tests for Linear Hypotheses in Proceedings of the Second Berkeley Symposium on Mathematical Statistics and Probability (ed. Neyman J) 159–166 (University of California Press, 1951). [Google Scholar]
- 43.Kraus P & Lufkin T Dlx homeobox gene control of mammalian limb and craniofacial development. Am. J. Med. Genet. A. 140, 1366–1374 (2006). [DOI] [PubMed] [Google Scholar]
- 44.Hennekam RCM, Krantz ID & Allanson JE Gorlin’s Syndromes of the Head and Neck. (Oxford University Press, Inc., 2010). [Google Scholar]
- 45.Attanasio C et al. Fine Tuning of Craniofacial Morphology by Distant-Acting Enhancers. Science 342, 1241006 (2013). [DOI] [PMC free article] [PubMed] [Google Scholar]
- 46.Beaty TH et al. Testing candidate genes for non-syndromic oral clefts using a case-parent trio design. Genet. Epidemiol. 22, 1–11 (2002). [DOI] [PubMed] [Google Scholar]
- 47.Alappat S, Zhang ZY & Chen YP Msx homeobox gene family and craniofacial development. Cell Res. 13, 429–442 (2003). [DOI] [PubMed] [Google Scholar]
- 48.Satokata I & Maas R Msx1 deficient mice exhibit cleft palate and abnormalities of craniofacial and tooth development. Nat. Genet. 6, 348–356 (1994). [DOI] [PubMed] [Google Scholar]
- 49.Nakatomi M et al. Genetic interactions between Pax9 and Msx1 regulate lip development and several stages of tooth morphogenesis. Dev. Biol. 340, 438–449 (2010). [DOI] [PubMed] [Google Scholar]
- 50.Wang J-L et al. TGF-β signaling regulates DACT1 expression in intestinal epithelial cells. Biomed. Pharmacother. 97, 864–869 (2018). [DOI] [PubMed] [Google Scholar]
- 51.Rabadán MA et al. Delamination of neural crest cells requires transient and reversible Wnt inhibition mediated by Dact1/2. Development 143, 2194–2205 (2016). [DOI] [PMC free article] [PubMed] [Google Scholar]
- 52.Stegman MA et al. Identification of a tetrameric hedgehog signaling complex. J. Biol. Chem. 275, 21809–21812 (2000). [DOI] [PubMed] [Google Scholar]
- 53.Méthot N & Basler K Suppressor of fused opposes hedgehog signal transduction by impeding nuclear accumulation of the activator form of Cubitus interruptus. Development 127, 4001–4010 (2000). [DOI] [PubMed] [Google Scholar]
- 54.Monnier V, Dussillol F, Alves G, Lamour-Isnard C & Plessis A Suppressor of fused links fused and Cubitus interruptus on the hedgehog signalling pathway. Curr. Biol. CB 8, 583–586 (1998). [DOI] [PubMed] [Google Scholar]
Methods-only References
- 55.Weinberg SM et al. The 3D Facial Norms Database: Part 1. A Web-Based Craniofacial Anthropometric and Image Repository for the Clinical and Research Community. Cleft Palate. Craniofac. J. 53, e185–e197 (2016). [DOI] [PMC free article] [PubMed] [Google Scholar]
- 56.Boyd A et al. Cohort Profile: the ‘children of the 90s’--the index offspring of the Avon Longitudinal Study of Parents and Children. Int. J. Epidemiol. 42, 111–127 (2013). [DOI] [PMC free article] [PubMed] [Google Scholar]
- 57.Fraser A et al. Cohort Profile: the Avon Longitudinal Study of Parents and Children: ALSPAC mothers cohort. Int. J. Epidemiol. 42, 97–110 (2013). [DOI] [PMC free article] [PubMed] [Google Scholar]
- 58.Verma SS et al. Imputation and quality control steps for combining multiple genome-wide datasets. Front. Genet. 5, 370 (2014). [DOI] [PMC free article] [PubMed] [Google Scholar]
- 59.Delaneau O, Zagury J-F & Marchini J Improved whole-chromosome phasing for disease and population genetic studies. Nat. Methods 10, 5–6 (2013). [DOI] [PubMed] [Google Scholar]
- 60.The 1000 Genomes Project Consortium. A global reference for human genetic variation. Nature 526, 68–74 (2015). [DOI] [PMC free article] [PubMed] [Google Scholar]
- 61.Durbin R Efficient haplotype matching and storage using the positional Burrows-Wheeler transform (PBWT). Bioinforma. Oxf. Engl. 30, 1266–1272 (2014). [DOI] [PMC free article] [PubMed] [Google Scholar]
- 62.McCarthy S et al. A reference panel of 64,976 haplotypes for genotype imputation. Nat. Genet. 48, 1279–1283 (2016). [DOI] [PMC free article] [PubMed] [Google Scholar]
- 63.1000 Genomes Project Consortium et al. An integrated map of genetic variation from 1,092 human genomes. Nature 491, 56–65 (2012). [DOI] [PMC free article] [PubMed] [Google Scholar]
- 64.Howie B, Marchini J & Stephens M Genotype Imputation with Thousands of Genomes. G3 Genes Genomics Genet. 1, 457–470 (2011). [DOI] [PMC free article] [PubMed] [Google Scholar]
- 65.Heike CL, Upson K, Stuhaug E & Weinberg SM 3D digital stereophotogrammetry: a practical guide to facial image acquisition. Head Face Med. 6, 18 (2010). [DOI] [PMC free article] [PubMed] [Google Scholar]
- 66.Robert P & Escoufier Y A Unifying Tool for Linear Multivariate Statistical Methods: The RV- Coefficient. J. R. Stat. Soc. Ser. C Appl. Stat. 25, 257–265 (1976). [Google Scholar]
- 67.Klingenberg CP Morphometric integration and modularity in configurations of landmarks: tools for evaluating a priori hypotheses. Evol. Dev. 11, 405–421 (2009). [DOI] [PMC free article] [PubMed] [Google Scholar]
- 68.Rohlf FJ & Slice D Extensions of the Procrustes Method for the Optimal Superimposition of Landmarks. Syst. Biol. 39, 40–59 (1990). [Google Scholar]
- 69.Olson CL On choosing a test statistic in multivariate analysis of variance. Psychol. Bull. 83, 579–586 (1976). [Google Scholar]
- 70.Ferreira MAR & Purcell SM A multivariate test of association. Bioinformatics 25, 132–133 (2009). [DOI] [PubMed] [Google Scholar]
- 71.Galesloot TE, van Steen K, Kiemeney LALM, Janss LL & Vermeulen SH A Comparison of Multivariate Genome-Wide Association Methods. PLOS ONE 9, e95923 (2014). [DOI] [PMC free article] [PubMed] [Google Scholar]
- 72.Porter HF & O’Reilly PF Multivariate simulation framework reveals performance of multi-trait GWAS methods. Sci. Rep 7, 38837 (2017). [DOI] [PMC free article] [PubMed] [Google Scholar]
- 73.O’Reilly PF et al. MultiPhen: joint model of multiple phenotypes can increase discovery in GWAS. PloS One 7, e34861 (2012). [DOI] [PMC free article] [PubMed] [Google Scholar]
- 74.Korte A et al. A mixed-model approach for genome-wide association studies of correlated traits in structured populations. Nat. Genet 44, 1066–1071 (2012). [DOI] [PMC free article] [PubMed] [Google Scholar]
- 75.Stephens M A Unified Framework for Association Analysis with Multiple Related Phenotypes. PLOS ONE 8, e65245 (2013). [DOI] [PMC free article] [PubMed] [Google Scholar]
- 76.Zhou X & Stephens M Efficient multivariate linear mixed model algorithms for genome-wide association studies. Nat. Methods 11, 407–409 (2014). [DOI] [PMC free article] [PubMed] [Google Scholar]
- 77.Devroye L Non-uniform random variate generation. (Springer-Verlag, 1986). [Google Scholar]
- 78.Zerbino DR et al. Ensembl 2018. Nucleic Acids Res. 46, D754–D761 (2018). [DOI] [PMC free article] [PubMed] [Google Scholar]
- 79.Karolchik D et al. The UCSC Table Browser data retrieval tool. Nucleic Acids Res. 32, D493–496 (2004). [DOI] [PMC free article] [PubMed] [Google Scholar]
- 80.Hooper JE et al. Systems biology of facial development: contributions of ectoderm and mesenchyme. Dev. Biol. 426, 97–114 (2017). [DOI] [PMC free article] [PubMed] [Google Scholar]
- 81.Pers TH, Timshel P & Hirschhorn JN SNPsnap: a Web-based tool for identification and annotation of matched SNPs. Bioinformatics 31, 418–420 (2015). [DOI] [PMC free article] [PubMed] [Google Scholar]
- 82.Buniello A et al. The NHGRI-EBI GWAS Catalog of published genome-wide association studies, targeted arrays and summary statistics 2019. Nucleic Acids Res. 47, D1005–D1012 (2019). [DOI] [PMC free article] [PubMed] [Google Scholar]
- 83.Rosseel Y lavaan: An R Package for Structural Equation Modeling. J. Stat. Softw. 48, 1–36 (2012). [Google Scholar]
- 84.Chang CC et al. Second-generation PLINK: rising to the challenge of larger and richer datasets. GigaScience 4, 7 (2015). [DOI] [PMC free article] [PubMed] [Google Scholar]
- 85.Najafova Z et al. BRD4 localization to lineage-specific enhancers is associated with a distinct transcription factor repertoire. Nucleic Acids Res 45, 127–141 (2017). [DOI] [PMC free article] [PubMed] [Google Scholar]
- 86.Baumgart SJ et al. CHD1 regulates cell fate determination by activation of differentiation-induced genes. Nucleic Acids Res 45, 7722–7735 (2017). [DOI] [PMC free article] [PubMed] [Google Scholar]
- 87.Nott A et al. Brain cell type-specific enhancer-promoter interactome maps and disease risk association. Science 366, 1134–1139 (2019). [DOI] [PMC free article] [PubMed] [Google Scholar]
- 88.Pattison JM et al. Retinoic Acid and BMP4 Cooperate with TP63 to alter Chromatin Dynamics during Surface Epithelial Commitment. Nat. Genet 50, 1658–1665 (2018). [DOI] [PMC free article] [PubMed] [Google Scholar]
- 89.Roadmap Epigenomics Consortium et al. Integrative analysis of 111 reference human epigenomes. Nature 518, 317–330 (2015). [DOI] [PMC free article] [PubMed] [Google Scholar]
Associated Data
This section collects any data citations, data availability statements, or supplementary materials included in this article.
Supplementary Materials
Data Availability Statement
All of the genotypic markers for the 3DFN dataset are available to the research community through the dbGaP controlled-access repository (http://www.ncbi.nlm.nih.gov/gap) at accession #phs000949.v1.p1. The raw source data for the phenotypes - the 3D facial surface models in .obj format - are available through the FaceBase Consortium (https://www.facebase.org) at accession #FB00000491.01. Access to these 3D facial surface models requires proper institutional ethics approval and approval from the FaceBase data access committee. Additional details can be requested from S.M.W.
The participants making up the PSU and IUPUI datasets were not collected with broad data sharing consent. Given the highly identifiable nature of both facial and genomic information and unresolved issues regarding risk to participants, we opted for a more conservative approach to participant recruitment. Broad data sharing of the raw data from these collections would thus be in legal and ethical violation of the informed consent obtained from the participants. This restriction is not because of any personal or commercial interests. Additional details can be requested from M.D.S. and S.W. for the PSU and IUPUI datasets, respectively.
The ALSPAC (UK) data will be made available to bona fide researchers on application to the ALSPAC Executive Committee (http://www.bris.ac.uk/alspac/researchers/data-access). Ethical approval for the study was obtained from the ALSPAC Ethics and Law Committee and the Local Research Ethics Committees.
KU Leuven provides the MeshMonk (v0.0.6) spatially dense facial mapping software, free to use for academic purposes (https://github.com/TheWebMonks/meshmonk). Matlab 2017b implementations of the hierarchical spectral clustering to obtain facial segmentations are available from a previous publication25 (https://doi.org/10.6084/m9.figshare.7649024).
The statistical analyses in this work were based on functions of the statistical toolbox in Matlab 2017b, SHAPEIT2 (v2.r900), Sanger Imputation Server (v0.0.6), PBWT pipeline (v3.1), MeshMonk (v0.0.6), LDSC (v1.0.1), FUMA (v1.3.3), GREAT (v3.0.0), Plink 1.9, lavaan (v0.6–3), R (>v3.4), agricolae (v1.3–0), cowplot (v1.0.0), ggplot2 (v3.1.1), ggpubr (v0.2), gridExtra (v2.3), gtable (v0.3.0), grid (v3.6.2), Hmisc (v4.2–0), psych (v1.8.12), data.table (v1.12.0), Genotype Harmonizer (v1.4.20), KING (v2.1.3), bowtie2 (v2.3.4.2), bedtools (v2.27.1), and Bioconductor (v3.7), as mentioned throughout the Methods. Publicly available data used were: the 1000G Phase 3 data (ftp://ftp.1000genomes.ebi.ac.uk/vol1/ftp/release/20130502/), the list of HapMap 3 SNPs excluding the MHC region (http://ldsc.broadinstitute.org/static/media/w_hm3.noMHC.snplist.zip), and ChIP-seq files from Prescott et al.41 (GSE70751), Najafova et al.85 (GSE82295), Baumgart et al.86 (GSE89179), Nott et al.87 (https://genome.ucsc.edu/s/nottalexi/glassLab_BrainCellTypes_hg19), Pattison et al.88 (GSE119997), Wilderman et al.40 (GSE97752), and the Roadmap Epigenomics Project89 (https://egg2.wustl.edu/roadmap/data/byFileType/alignments/consolidated/). Meta-analysis GWAS statistics are available on GWAS Catalog (GCP000044). All relevant data to run future replications and meta-analysis efforts are provided in the FigShare repository for this work34, along with additional figures (https://doi.org/10.6084/m9.figshare.c.4667261). Items available in the FigShare repository are: (1) Anthropometric mask: a Matfile of the anthropometric mask used; (2) Association statistics and effects of the 203 lead SNPs: Facial effects, LocusZoom plots, and association statistics from each stage of the analysis for the 203 lead SNPs; (3) Calculation of study-wide significance threshold: Script and permutation outcomes needed to replicate the calculation of the study-wide significance threshold; (4) Facial segment assignments: Segment assignments for each quasi landmark in the anthropometric mask; (5) Figure 2A labeled: A larger version of Figure 2A, with all cell types and tissues labeled; (6) GREAT Export: Raw output of the GREAT analysis; (7) PCA shape constructs: PCA shape spaces for all 63 facial segments; (8) QQ plots: QQ plots for each segment in all stages of the analysis; (9) Script to explore facial segments and GWAS hits: MatLab script for select data exploration functions; (10) SNPs reaching suggestive significance in either meta-analysis track: Association statistics of all SNPs with P < 5 × 10⁻⁷ in METAUS or METAUK tracks; (11) Source data for manuscript figures: Source data in Excel format for all figures, where possible.


