Abstract
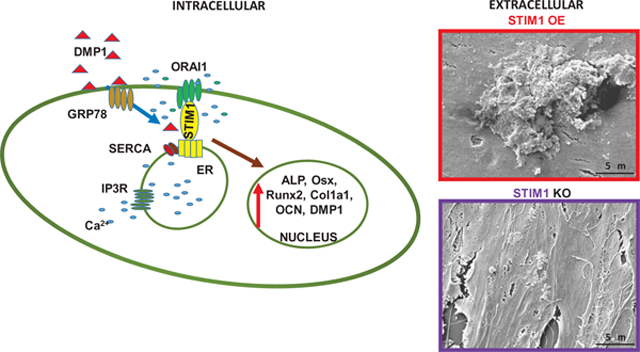
Osteoblasts and odontoblasts, are non-excitable cells and facilitate mass calcium transport during matrix mineralization. A sophisticated Ca2+ sensing mechanism is used to maintain Ca2+ homeostasis. STIM1 (Stromal interaction molecule 1) is a calcium sensor protein localized in the ER membrane and maintains calcium homeostasis by initiating the store-operated Ca2+ entry (SOCE) process, following store depletion. The role of STIM1 in dentin mineralization is yet to be elucidated. Therefore, transgenic DPSCs were generated in which overexpression or knockdown of STIM1 was achieved to study its function in matrix mineralization. Gene expression analysis and Alizarin Red staining assay demonstrated upregulation of genes involved in odontogenic differentiation and matrix mineralization with increased calcium deposition with STIM1 overexpression. Topology of the ECM examined by Field Emission Scanning Electron Microscopy (FESEM) showed the presence of large amounts of extracellular microvesicles with mineral deposits. Interestingly, silencing STIM1 resulted in fewer vesicles and less mineral deposits in the ECM. Analysis of the dentin-pulp complex of STIM1- deficient mice by micro-CT show reduced dentin thickness, malformed and highly porous alveolar bone, suggesting a cell intrinsic role for STIM1 in dentin mineralization. Confocal microscopy showed that DMP1-mediated depletion of store Ca2+ resulted in aggregation or “puncta-formation” of STIM1 at the plasma membrane indicative of a gating arrangement with Orai1 for Ca2+ influx. Together, our data provide evidence for an important role for STIM1 in dentin and alveolar bone mineralization by influencing intracellular Ca2+ oscillations that could provide signals for a wide array of cellular functions.
Keywords: Dentin matrix protein 1, STIM1, tissue mineralization, extracellular vesicle, calcium signaling, DPSCs, dentin
Graphical Abstract
1. Introduction
During bone and dentin formation, calcium mobilization and calcium entry across the plasma membrane by osteoblasts and odontoblasts are key physiological events. Ca2+ is a versatile signaling molecule that controls diverse physiological process that ranges from several short-term cellular functions to long term processes such as proliferation and differentiation [1, 2]. The cytosolic Ca2+ concentration is tightly regulated and its concentration varies depending on its location. At resting state, cytoplasmic Ca2+ concentration is maintained at ~10−7 M, while calcium is resident at higher levels in the extracellular milieu (~10−3 M). In organelles such as the ER, Ca 2+ can accumulate and maintain a higher concentration than the cytoplasm (1–5 × 10⁻⁴ M) [3]. Stimulation by diverse growth factors can also promote release of calcium from the ER stores or Ca2+ influx from the extracellular space, leading to rise in elevated intracellular Ca2+ levels. Dynamic cellular machineries maintain the Ca2+ gradients between organelles, cytoplasm and extracellular environment. In calcified tissues, aberrant intracellular Ca2+ leads to the loss of Ca2+ homeostasis, resulting in abnormal calcium metabolism and bone disorders [4]. In order to maintain the spatial distribution of the Ca2+ gradient, cells utilize various spatially distributed calcium pumps and channels at the plasma membrane to maintain calcium homeostasis and the localized nature of Ca2+ -mediated signal transduction [5, 6].
Store-operated calcium entry (SOCE) is an important Ca2+ influx pathway in non-excitable cells [7–9]. This process involves activation of Ca2+ influx across the plasma membrane in response to a decrease in the ER Ca2+ concentration. The two essential components of this physiological activity are STIM1 an ER Ca2+ sensor protein and Orai1 a protein that forms the ion-conducting pore in the plasma membrane to aid Ca2+ influx from the extracellular space [10–13]. STIM1 functions in cells as dynamic coordinators of cellular Ca2+ signals and senses a variety of cellular stresses to regulate SOCE [14–16]. Upon Ca2+ depletion in the ER lumen, STIM1 oligomerizes and forms clusters or puncta below Orai1 in the plasma membrane, where it tethers and gate the highly calcium selective Orai1 channel leading to SOCE activation [16]. In bone and dentin, we have demonstrated that DMP1, a key regulatory protein in the extracellular matrix binds to its receptor on the plasma membrane, resulting in signal transduction events that triggers ER Ca2+ release [17]. ER Ca2+ store depletion is the initial trigger for STIM1 activation; therefore, it is of interest to determine a role for STIM1 in calcified tissue formation.
The odontoblasts, principal cells that synthesize the dentin matrix express functional SOCE channels and can mediate Ca2+-mediated signaling pathways [18, 19]. This suggests that an organized calcium transport and signaling system is operative during the assembly of the calcium enriched dentin matrix. Formation of crystalline hydroxyapatite, the mineral phase of the dentin matrix requires the odontoblasts to transfer Ca2+ into the ECM in a well-regulated manner without the initiation of cellular stress however; the cellular mechanisms associated with mode of calcium uptake and transport is poorly understood.
Recent studies have shown that patients with loss–of-function mutations in STIM1 and ORAI1 genes have impaired SOCE and develop amelogenesis imperfecta with hypomineralized enamel [20–24]. Clinical data showed that both the primary and permanent teeth were affected and were attributed to this phenotype [23]. Further, these patients showed several other clinical manifestations such as SCID-like (severe combined immunodeficiency) disease with recurrent and chronic infections, autoimmunity, ectodermal dysplasia and muscular hypotonia [23].
The overarching goal of this study is to identify a role for STIM1 during the differentiation of dental pulp stem cells into functional odontoblasts and formation of mineralized dentin matrix. We demonstrate that molecular knockdown or overexpression of STIM1 results in impairment or amplification of differentiation markers and matrix mineralization.
2. Material and Methods
2.1. Immunohistochemistry
2-month-old mouse mandibles were dissected and fixed in 10% neutral buffered formalin at 4°C for 1 day and demineralized with 14 % EDTA solution, pH 7.5 at 4°C for 3 weeks. The tissues were then dehydrated with gradient ethanol, embedded in paraffin and sectioned at 5 m as published earlier [25]. Day 5 mouse heads were also processed in a similar manner. The following primary antibodies used were against STIM1 (610954, BD Biosciences, San Jose, CA), Orai1 & GRP-78 (sc68895 & sc376768 respectively, Santa Cruz Biotechnology, Dallas, TX), Runx2 (ab76956, Abcam, Cambridge, MA), Col1a1 (ab34710, Abcam), OPN (711215, Invitrogen), DMP1 and DPP (in house generated). Immunohistochemistry was conducted by using the VECTASTAIN ABC HRP kit (Vector Laboratories, Inc., Burlingame, CA) or the Mouse on Mouse Elite Peroxidase Kit (Vector Laboratories per manufacturer’s instructions. Colorimetry-based immunodetection was performed. For fluorescent immunocytochemistry, the secondary antibodies were Alexa Fluor 594 (ab 150080, abcam), Alexa Fluor 488 (ab 150113, Abcam) followed by the manufacturer’s protocol for further processing. Images were captured using Carl Zeiss AG Axio Observer D1 light microscope. The images were analyzed with ImageJ (1.50c) with IHC Profiler plugin to quantify positive staining. Data extracted from at least 6 images per sample were used for statistical analysis.
2.2. Subcellular Localization of STIM1-CFP and Orai1-YFP by Confocal & Live cell Imaging
T3 cells used in this study were immortalized preodontoblast cell line established from rat tooth germ cells [26]. DPSC cells were a kind gift from Dr. Songtao Shi (University of Pennsylvania). pORAI1-YFP and pSTIM1-CFP plasmids were a kind gift from Dr. Murali Prakriya, (Northwestern University) and pSTIM1-GFP a kind gift from Dr. Chinnaswamy Tiruppathi (UIC). Recombinant DMP1 (rDMP1) protein was produced in Escherichia coli and purified as described previously [27].T3 cells were seeded on cover glass and grown to 60% confluency in α MEM with 10% FBS and 1% Antibiotic-Antimycotic (Invitrogen, Carlsbad, CA). They were then transfected with pSTIM1-CFP and pOrai1-YFP with Lipofectamine 2000 (Invitrogen) according to manufacturer’s instructions. Similarly, DPSC cells were transfected with pGFP-STIM1 grown on a cover glass.
For live-cell imaging, DPSC-STIM1 OE cells were seeded on a 35mm collagen coated glass bottom dish (Mat Tek Corporation, Ashland, MA, U.S.A) and grown to 70% confluency in α MEM with 10% FBS and 1% Antibiotic-Antimycotic. 12–16 hour before treatment, these cells were cultured in α MEM supplemented with 1% FBS. These cells were washed with PBS once and then stimulated with rDMP1 at a final concentration of 500 ng/ml in PBS. The STIM1-CFP fluorescence signals were immediately captured at one second intervals with 3% laser power for a total duration of 10 min with a Zeiss LSM 710 Confocal Microscope at UIC core.
2.3. Generation of STIM1 overexpressing and silenced DPSC cells
The pSTIM1-CFP was used to construct a vector expressing STIM1-CFP for lentiviral packaging. The expression vector and viral transduction were performed as previously described [28]. DPSC cells were transduced with the viral particles. DPSCs transduced with the STIM1 were selected after treatment with 10 μg/ml puromycin for five days. The puromycin resistant cells were pooled and used as DPSC-STIM1OE cells.
Stable cell-line with ShRNA against STIM1 were constructed as described above. Briefly, the MISSSION SHRNA constructs TRCN0000358719 (targeting CDS of human STIM1, Sigma-Aldrich, St. Louis, MO) were transduced in DPSC cells and puromycin resistant cells expressing ShSTIM1 (DPSC-STIM1KO) were pooled and used for further experiments.
2.4. Cytosolic Ca2+ Measurement
The cytosolic Ca2+ concentration was measured using the Ca2+-sensitive fluorescent dye Fura-2 AM (Invitrogen) as previously published [17]. Briefly, DPSC, DPSC-STIM1 OE and DPSC-STIM1 KO cells were grown to 80 to 90% confluence on tissue culture glass coverslips, and then incubated with 3 μM Fura-2 AM for 30 min at 37 °C. After washing with HBSS, the coverslips were mounted to a perfusion chamber and imaged. 250ng/ml rDMP1 was added to the cells at 60 seconds, followed by addition of 1.5 mM Ca2+ at around 150 seconds. A dual excitation at 340 and 380 nm was used and emission was collected at 520 nm. The Axio-Vision physiology software module was used to acquire the images at 1-s intervals and the data was analyzed off-line. In each experiment, 20–40 cells were selected to record the mobilization of intracellular Ca2+
2.5. Alizarin-Red staining to assess matrix mineralization
Alizarin red staining was performed as described previously [29] on DPSC, DPSC – STIM1 OE and DPSC-STIM1 KO cells cultured under differentiation conditions (MEM with 10% FBS, 1% Antibiotic-Antimycotic, 100 g/ml ascorbic acid (Invitrogen), 10 mM -glycerol phosphate, and 10 nM dexamethasone) at indicated time points. Briefly, the cells were fixed in ice-cold methanol for 30 min, washed with PBS twice, and then stained with 2% Alizarin red S (Sigma-Aldrich). After 30 min, excessive dye was removed by washing with water. The plates were imaged with a scanner (HP Scanjet 8250, Palo Alto, CA, USA) or a Zeiss microscope (Thornwood, NY, USA). For quantification of the Alizarin Red stain, the dye “bound” with mineral nodules were extracted with 10 % acetic acid solution at 21°C for 1 hr followed by 85°C for 2 hrs. The mixture was then centrifuged at 12,000 rpm for 10 min, and the supernatant was collected. 1/5th volume of ammonium water (10%) was added to the solution and the sample absorbance at 405 nm was obtained with a BioTek II plate reader (BioTek Instruments, Winooski, VT). Alizarin red S was used to generate a standard curve for quantification.
2.6. Gene expression analysis by quantitative real time PCR (RT-qPCR)
Total RNA was extracted from DPSC, DPSC-STIM1 OE and DPSC-KO cells using RNeasy Plus Mini Kit (QIAGEN, Carlsbad, CA) according to the manufacturer’s protocol. cDNA was synthesized and real-time PCR were described previously [29]. qPCR was carried out using FastStart Universal SYBR Green Master reagent (Roche, South San Francisco, CA) and primer pairs as needed on an ABI StepOnePlus instrument (Applied Biosystems, Foster City, CA). Gene expression levels were estimated by the 2−ΔΔCT method with GAPDH gene expression level as an internal control. Primers were synthesized by IDT (Integrated DNA technologies, Inc., Coralville, IA) and the primer sequences are presented in Tables 1 and 2.
Table 1.
DNA oligoes for quantitative PCR of human samples.
| Gene Name | Accession | Sequence |
|---|---|---|
| hSTIMl | NM_001277961 | AGT CAC AGT GAG AAG GCG AC |
| CAA TTC GGC AAA ACT CTG CTG | ||
| hORAI1 | NM_032790 | GAC TGG ATC GGC CAG AGT TAC |
| GTC CGG CTG GAG GCT TTA AG | ||
| hALP | NM_001127501 | AAC ATC AGG GAC ATT GAC GTG |
| GTA TCT CGG TTT GAA GCT CTT CC | ||
| hOsx | NM_152860.2 | GCC AGA AGC TGT GAA ACC TC |
| GCT GCA AGC TCT CCA TAA CC | ||
| hRunx2 | NM_001015051 | TGG TTA CTG TCA TGG CGG GTA |
| TCT CAG ATC GTT GAA CCT TGC TA | ||
| hColla1 | NM_000088 | GAG GGC CAA GAC GAA GAC ATC |
| CAG ATC ACG TCA TCG CAC AAC | ||
| hColX | NM_000493 | ATG CTG CCA CAA ATA CCC TTT |
| GGT AGT GGG CCT TTT ATG CCT | ||
| hOPG | NM_002546 | CAA AGT AAA CGC AGA GAG TGT AGA |
| GAAGGTGAGGTTAGCATGTCC | ||
| hOCN | NM_199173 | CAC TCC TCG CCC TAT TGG C |
| CCC TCC TGA TTG GAC ACA AAG | ||
| hBMP2 | NM_001200 | ACT ACC AGA AAC GAG TGG GAA |
| GCA TCT GTT CTC GGA AAA CCT | ||
| hDMP1 | NM_004407.3 | AAT TCT TTG TGA ACT ACG GAG GG |
| CAC TGC TCT CCA AGG GTG G | ||
| hGAPDH | NM_001357943 | GGA GCG AGA TCC CTC CAA AAT |
| GGC TGT TGT CAT ACT TCT CAT GG |
Table 2.
DNA oligoes for quantitative PCR of mouse samples
| Gene Name | Accession | Sequence |
|---|---|---|
| mSTIM1 | NM_009287.5 | TGA AGA GTC TAC CGA AGC AGA |
| AGG TGC TAT GTT TCA CTG TTG G | ||
| mORAI1 | NM_175423 | GAT CGG CCA GAG TTA CTC CG |
| TGG GTA GTC ATG GTC TGT GTC | ||
| mALP | NM_007431 | GAT CAT TCC CAC GTT TTC AC |
| TGC GGG CTT GTG GGA CCT GC | ||
| mCol1a1 | NM_007742 | GCT CAG CTT TGT GGA TAC GCG |
| GTC AGA ATA CTG AGC AGC AAA G | ||
| mFN1 | NM_010233 | GAT GTC CGA ACA GCT ATT TAC CA |
| CCT TGC GAC TTC AGC CAC T | ||
| mBSP | NM_008318 | CAG GGA GGC AGT GAC TCT TC |
| AGT GTG GAA AGT GTG GCG TT | ||
| mMMP9 | NM_008610 | CAA GTT CCC CGG CGA TGT C |
| TTC TGG TCA AGG TCA CCT GTC | ||
| mOCN | NM_007541 | CTC CTG A GA GTC TGA CAA AGC CTT |
| GCT GTG ACA TCC ATT ACT TGC | ||
| mBMP2 | NM_007553 | CGG GAA CAG ATA CAG GAA GC |
| GCT GTT TGT GTT TGG CTT GA | ||
| mVEGFA | NM_009505 | GCA CAT AGA GAG AAT GAG CTT CC |
| CTC CGC TCT GAA CAA GGC T | ||
| mOPN | NM_001204201 | AGC AAG AAA CTC TTC CAA GCA A |
| GTG AGA TTC GTC AGA TTC ATC CG | ||
| mOSX | NM_130458 | AGC GAC CAC TTG AGC AAA CAT C |
| CGG CTG ATT GGC TTC TTC TTC C | ||
| mRunx2 | NM_001145920 | CCT GAA CTC TGC ACC AAG TC |
| GAG GTG GCA GTG TCA TCA TC | ||
| mDMP1 | NM_016779 | CCC AAA GGA ACA CAA GGA GA |
| TTC GCT GAG GTT TTG ACC TT | ||
| mSOST | NM_175423 | AGC CTT CAG GAA TGA TGC CAC |
| CTT TGG CGT CAT AGG GAT GGT | ||
| mGAPDH | NM_001289726 | AGG TCG GTG TGA ACG GAT TTG |
| TGT AGA CCA TGT AGT TGA GGT CA |
2.7. FESEM
DPSC, DPSC-STIM1 OE & DPSC-STIM1 KO cells were seeded on a cover glass (12 mm, Invitrogen) and cultured under growth media (GM) (MEM with 10 % FBS and Antibiotic-Antimycotic till 80 % confluent. Cells were then incubated in differentiation media (DM is GM containing 100 g/ml ascorbic acid (Sigma-Aldrich), 10 mM -glycerolphosphate (Sigma-Aldrich), 10 nM dexamethasone (Sigma-Aldrich), and were replaced with fresh DM every 2 days until harvest at the indicated time points (7 Day, 14 Day). At each time point, the cells were washed with PBS, and subsequently fixed in 10 % neutral buffered formalin for 2 h at room temperature. The cells were washed extensively with water, and dehydrated with gradient ethanol, then treated with hexamethyldisilazane (Electron Microscopy Sciences, Hatfield, PA) and dried. The cover glass with the cells were mounted on a M4 aluminum specimen mount (Ted Pella, Inc., Redding, CA), coated with 10nm gold/palladium metal film with a Polaron E5100 sputter coater (Polaron Instruments, Inc., Doylestown, PA). The topography and element data were obtained with a scanning electron microscope (JEOL JSM-IT500HR, JEOL USA, Inc., Peabody, MA) equipped with an Oxford EDS (Energy dispersive x-ray spectroscopy) detector (Oxford Instruments USA, Concord, MA). The following conditions were used to acquire the images, accelerating voltage: 3kV, working distance: 10 mm, probe current: 35, objective lens aperture: 3, secondary electrons capture duration: 80 seconds. To obtain EDS data the conditions used were, accelerating voltage 10 kV, working distance10 mm, and dead time 38%. The EDS data were analyzed using the accompanying Aztec software for element identification.
To quantify vesicles, particles with size between 50–250nm were identified in FESEM images and counted. Data from at least 6 images per sample were used for statistical analysis.
2.8. Generation of STIM1 KO mouse
The homozygous STIM1flox/flox mice were kindly provided by Dr. Tiruppathi (University of Illinois at Chicago). To silence STIM1 in bones and teeth, homozygous DMP1-Cre: DMP1-Cre mouse (Dmp1-Cre: Dmp1-cre) 1Jqfe/BwdJ) was obtained from Jackson laboratory (Jackson laboratory, Bar Harbor, ME). The STIM1flox/flox mice were used to mate with DMP1-Cre: DMP1-Cre mice to generate DMP1-Cre, STIM1flox/wt mice (F1). The F1 mice were then mated with STIM1flox/flox. Their off springs with genotype DMP1-Cre, STIMflox/flox or STIM1flox/flox were used for experiments as STIM1 KO or WT, respectively. All animal studies were performed as per the animal use protocol approved by the UIC animal care committee (Assurance number 16–178). All animal studies were performed as per the animal use protocol approved by the UIC animal care committee (Assurance number 16–178).
2.9. X-ray radiography and micro-computed tomography
The mouse mandibles were dissected out and fixed in 10% neutral buffered formalin for 48 hr., washed and stored in PBS until use. Faxitron imaging and Micro CT scanning were conducted with samples immersed in PBS solution. For Faxtiron imaging, the dissected hemimandibles were imaged by X-ray radiography (MX-40, Faxitron, Lincolnshire, IL). The samples were placed on the sagittal plane to image the mandibles. The imaging settings used were power at 35 kV and exposure duration for 360 seconds.
The micro-computed tomography (CT) analysis were done using a CT40 imaging system with accompanying software suite (Scano Medical, Basserdorf, Switzerland). The hemi mandibles were scanned as described before [30]. Morphological analysis of the alveolar bone containing the first mandibular molar was performed according to published protocols [30]. Analysis of dentin thickness were calculated from the mesio-distal views of the first mandibular molar by contouring a 0.150 mm (0.120mm to 0.200mm) region of dentin located at the central portion between the crest of bone to the start of the crown. The grey threshold cutoff was set at 270 for all samples for 3D segmentation and bone volumetric calculation. All CT parameters are reported using conventional nomenclature [31]. Micro CT scans were performed for 6 samples in each group and the data used for statistical analysis.
2.9. Isolation of total RNA from mouse tooth tissue
The molars of 1- month old mice WT and KO mice were extracted and soft tissue thoroughly removed, then washed in PBS twice. The molars were ground to a fine powder with a mortar and pestle under liquid nitrogen. The total RNA from the powdered molars were isolated with TRIzol reagent (Invitrogen).
2.10. Statistical Analyses
For gene expression in cultured cells, alizarin red quantification, vesicle numbers or micro CT morphometric data for alveolar bone, the statistical analysis and p values were calculated using ANOVA with post-hoc Tukey HSD test. p<0.5 was considered significant. For comparison of gene expression in tooth tissue, dentin morphometric data or quantification of the color intensity in the mandible sections by immunohistochemistry, Student’s t-Test was used and p< 0.05 was considered significant.
3. Results
3.1. Expression pattern of STIM1 and ORAI1 in the dentin-pulp complex
Immunohistochemical analysis performed on sections from 2-month mandible showed specific localization of STIM1 in the cytoplasm of the odontoblasts, the dental pulp cells and the osteoblasts of the alveolar bone (Fig 1A). Expression of STIM1 was greatly attenuated in STIM1-KO mice (Suppl Fig 1A &B). Orai1 expression was strictly restricted to the plasma membranes of the odontoblasts, the dental pulp cells and the osteoblasts of the alveolar bone (Fig 1B).These results show the expression of the molecular components involved in SOC entry expressed in the cells forming the dentin-pulp complex.
Fig 1. Localization of STIM1 and Orai1 during tooth development:
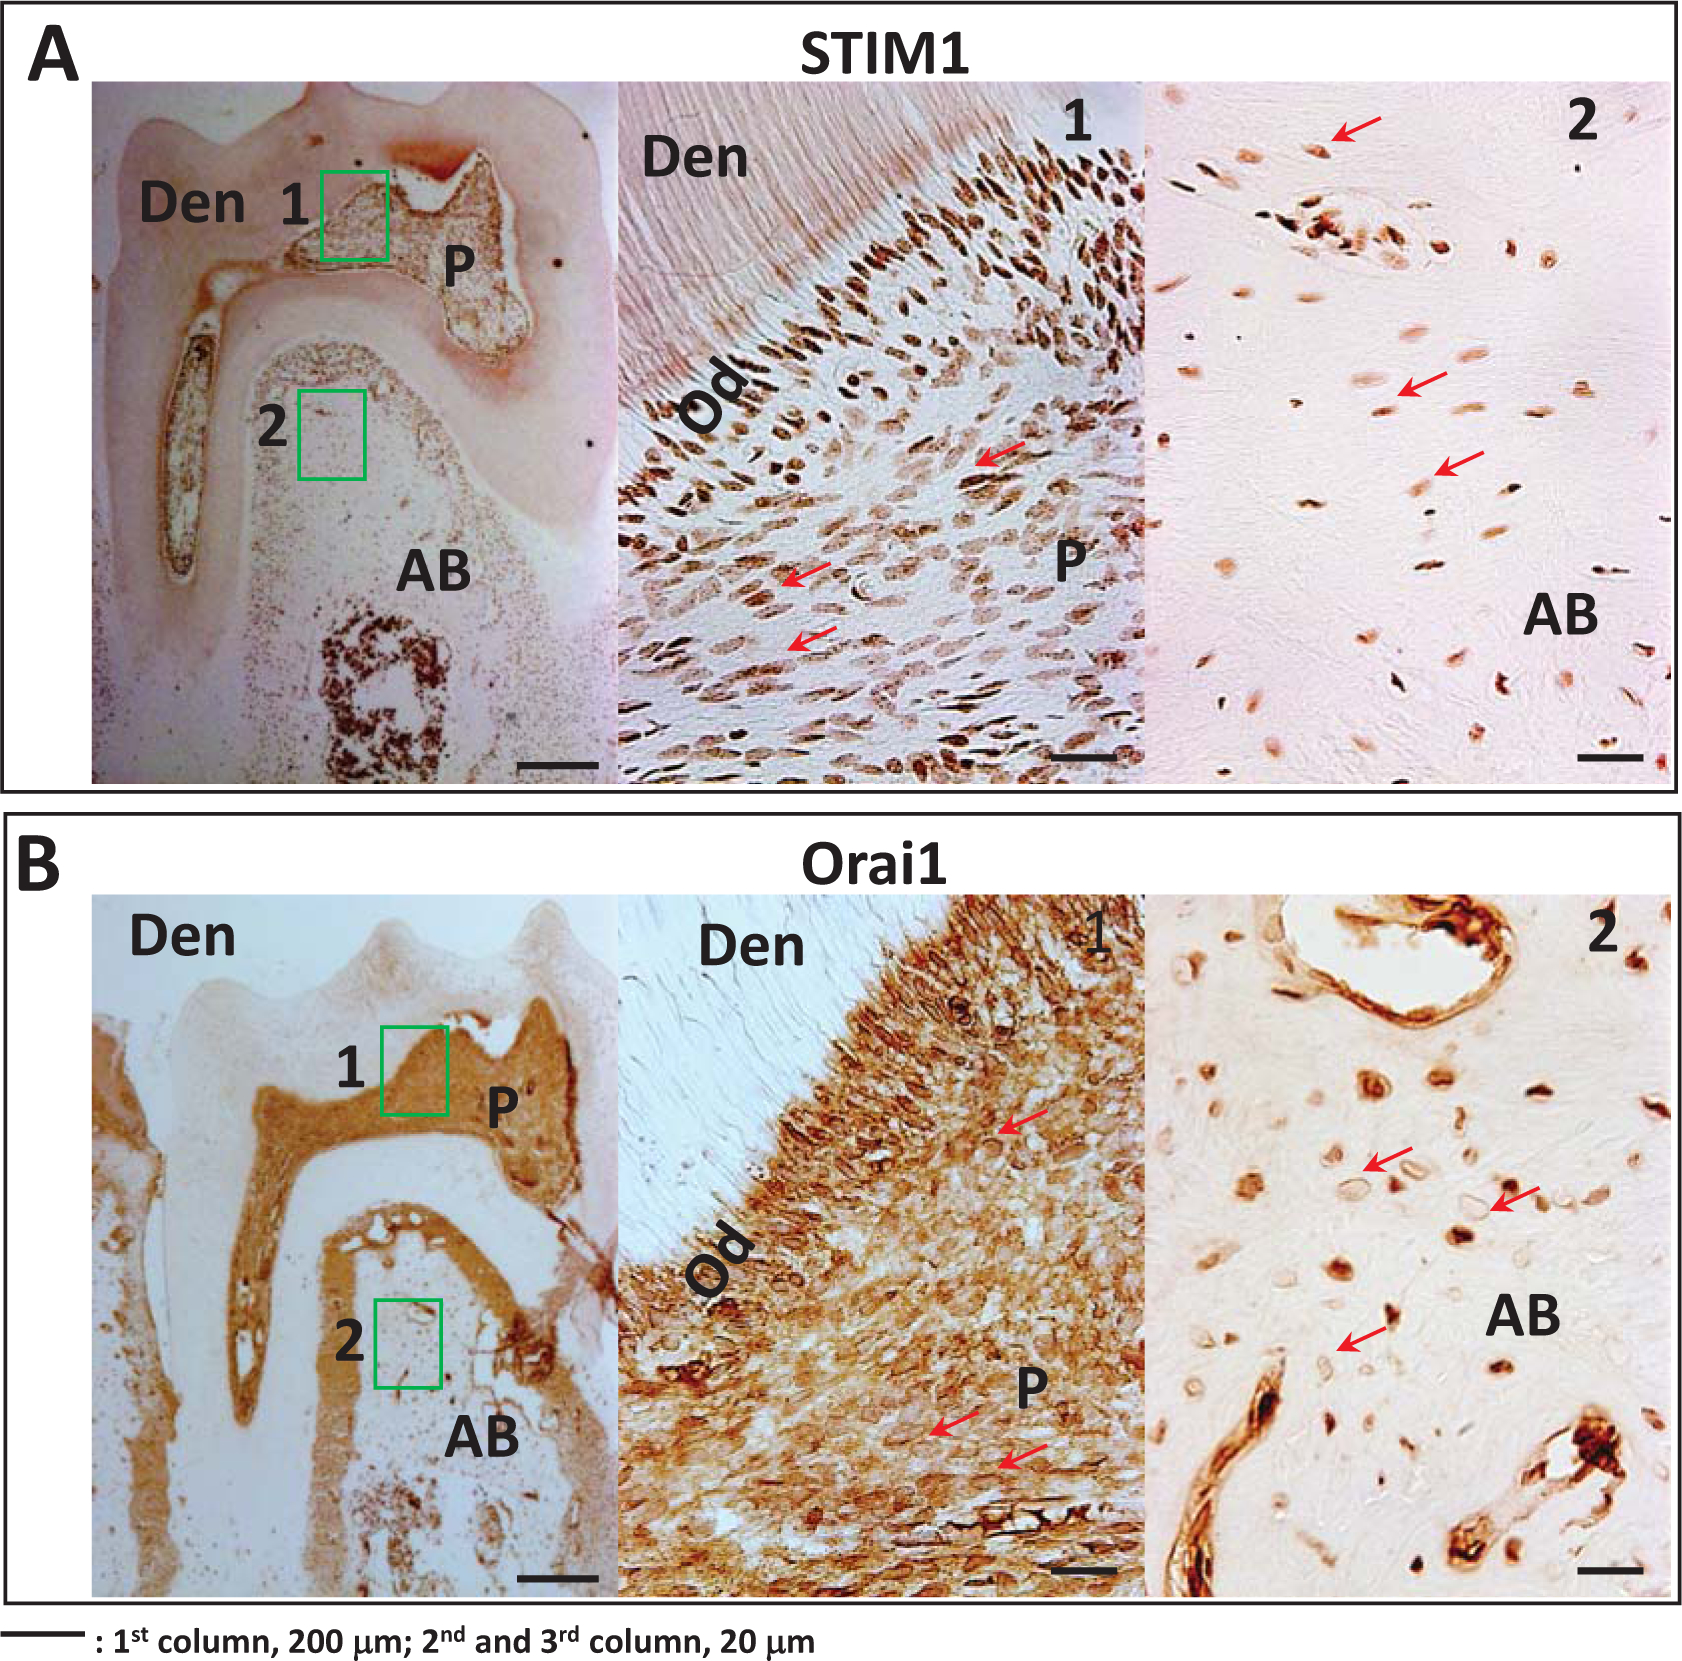
A. Expression of STIM1 in the differentiating odontoblasts, alveolar bone and dental pulp cells in 2-month old mouse heads. Boxes indicated as 1 and 2 have been magnified and the corresponding images are shown in the panel. Arrows point to STIM1 positive cells in the pulp and bone. P=pulp; OD=odontoblasts, Den = dentin and AB=alveolar bone.
B. Expression of Orai1 in the odontoblasts, alveolar bone and dental pulp cells. Note localization of Orai1 at the plasma membrane of the odontoblasts and dental pulp cells. Arrows point to the membrane localization of Orai1 in the pulp and bone cells. P=pulp, OD=odontoblasts, Den = dentin and AB=alveolar bone.
3.2. Subcellular localization of STIM1 and ORAI1 in preodontoblast cells with depletion of ER Ca2+
In order to assess the localization of STIM1 and Orai1, we ectopically expressed CFP-STIM1 and YFP-ORAI1 in preodontoblast T3 cells. Results in Fig 2A show distinct spatial localization intracellularly. When stimulated with rDMP1 to deplete ER Ca2+ and activate SOCE, STIM1 was observed to migrate and localize at the plasma membrane in close proximity with Orai1 (Fig 2B. This confirms that in preodontoblasts, the two molecular components of SOCE, namely STIM1 and Orai1 are in close proximity as shown in Fig 2B (red square region) and the colocalization in the ‘z’ stack image in Fig 2C). Immunocytochemistry confirmed the colocalization of Stim1 and Orai 1 in the dental pulp (Suppl Fig 1C).
Fig 2. Subcellular localization of YFP-Orai1 and CFP-STIM1 with and without DMP1 stimulation to trigger ER Ca2+ release:
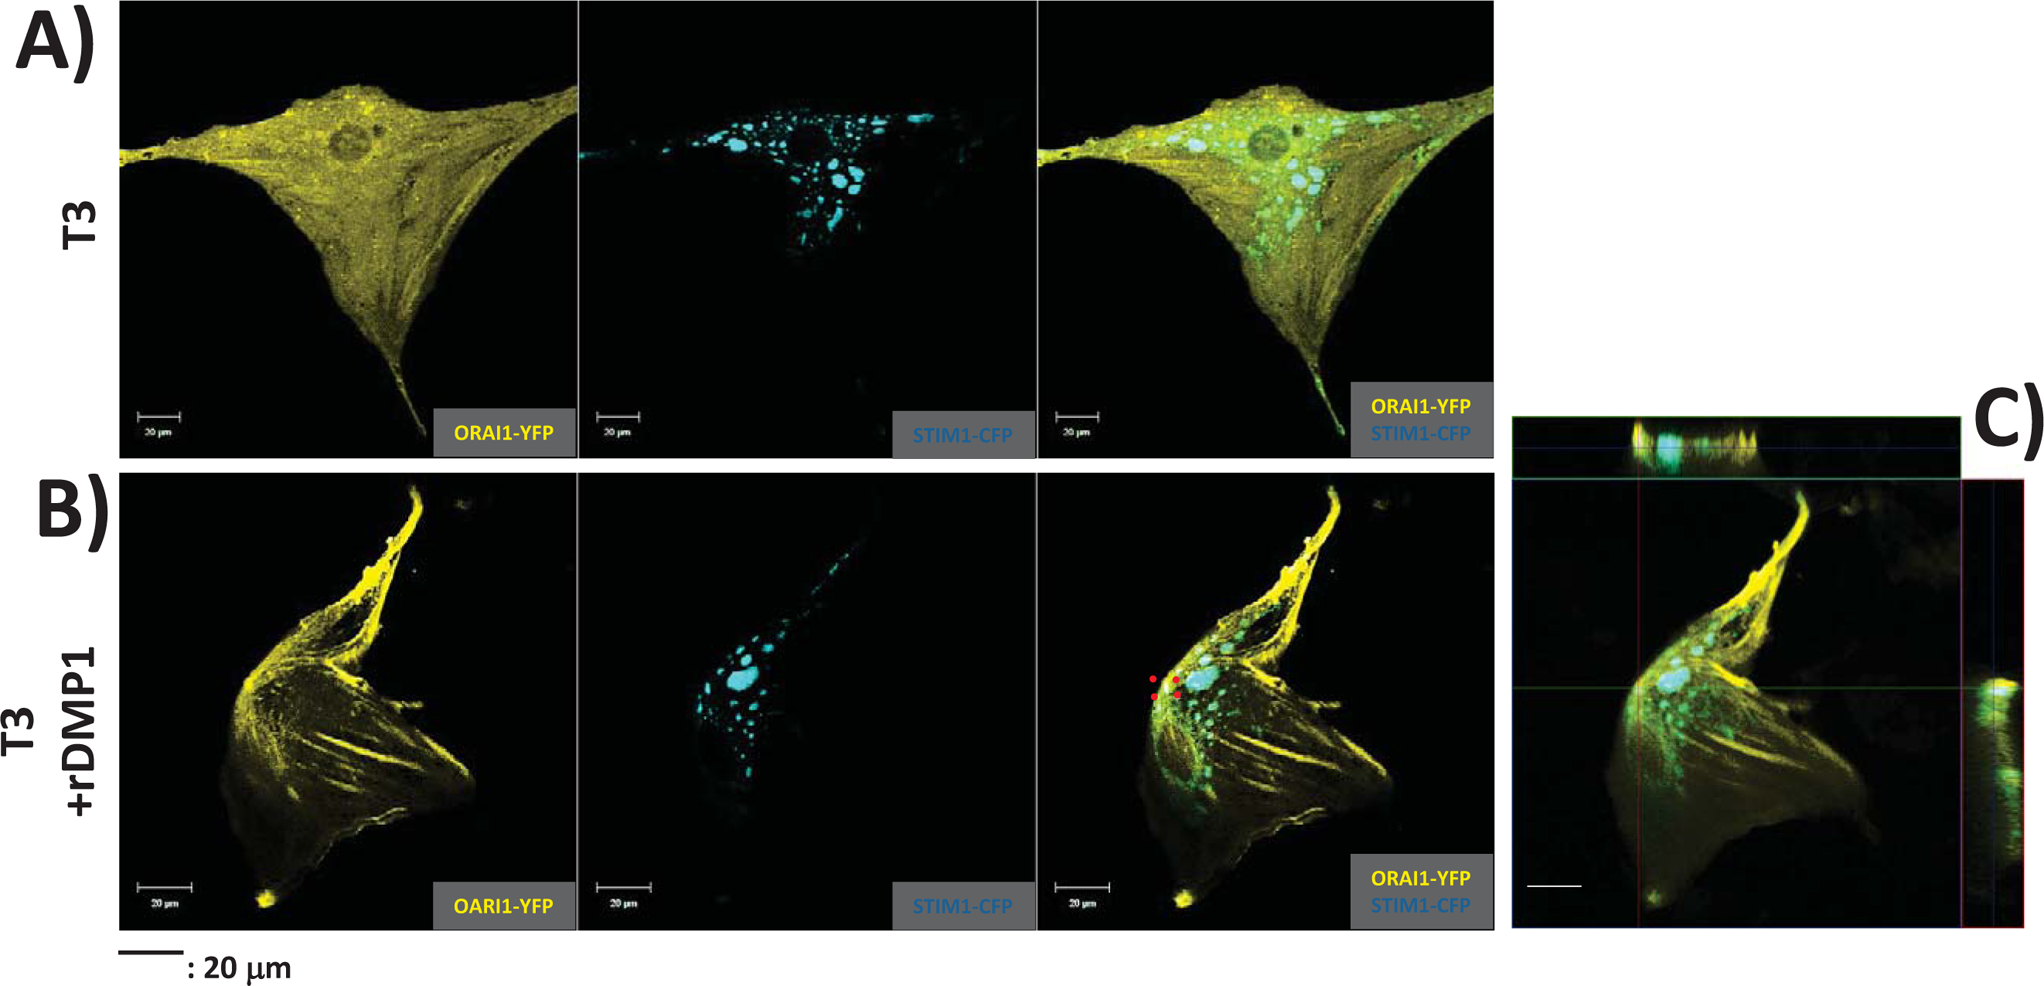
(A) Preodontoblasts T3 cells transfected with YFP-Orai1 and CFP-STIM1 were cultured in growth media, fixed and imaged using confocal microscopy. Composite image shows distinct spatial localization of Orai1 and STIM1.
(B) T3 cells transfected with YFP-Orai1 and CFP-STIM1were stimulated with DMP1 to initiate ER Ca2+ release and imaged. Confocal images show colocalization of Orai1 and STIM1 with ER Ca2+ release as indicated by the red-boxed region.
(C) Z-stack image of the transfected cell showing the orthogonal view to demonstrate colocalization of YFP-ORAI1 and CFP-STIM1 with ER Ca2+ release.
3.3. ER Ca2+ depletion promotes oligomerization and mobilization of STIM1
To further delineate the role of STIM1 in SOCE during dentinogenesis, we ectopically expressed CFP-STIM1 in DPSCs and used live-cell confocal imaging to observe mobilization of STIM1 with DMP1 stimulation to deplete ER - Ca2+ store. Analysis of the time course of puncta formation presented in Fig 3A demonstrate that upon ER Ca2+ depletion, CFP-STIM1 fluorescence appears as multiple discreet puncta in a time-dependent manner. STIM1 puncta appeared as early as 100sec after DMP1 stimulation, reached a maximum at 400sec, and persisted over a period of 600sec. In addition, activation of DMP1-mediated SOCE promoted the formation of multiple long cellular processes within 150 sec of DMP1 stimulation (Fig, 3B & Suppl. Fig 5). These results indicate that ER Ca2+ depletion show STIM1 accumulation in puncta and Ca2+ signaling activated by SOCE can promote cellular viability and formation of long cellular processes.
Fig 3. Time course of spatial mobilization and puncta formation of STIM1 with ER Ca2+ depletion.
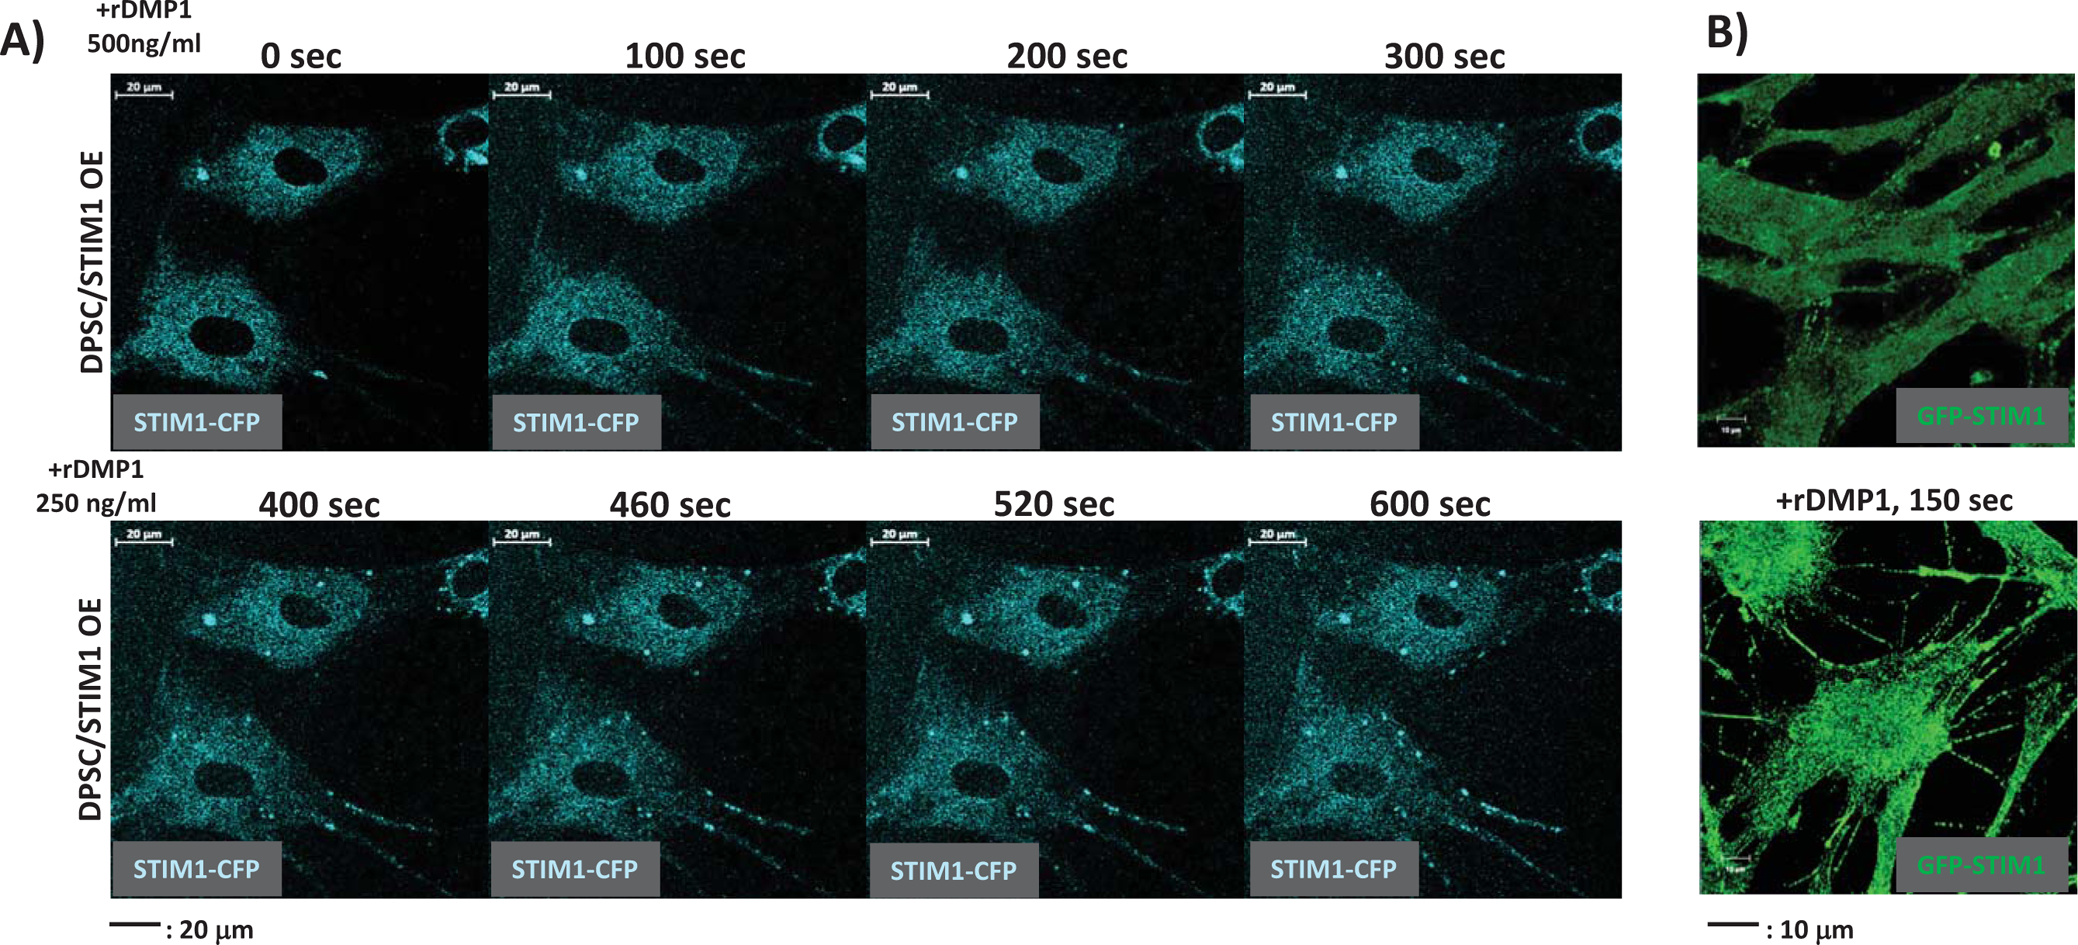
(A) Dental pulp stem cells transfected with CFP-STIM1 were stimulated by 500 ng/ml DMP1 for various time periods to trigger ER Ca2+ release. Oligomerization and mobilization of STIM1 were monitored by live-cell imaging using confocal microscopy. Note “puncta” formation with ER store depletion.
(B) Changes in cell morphology of DPSC–GFP-STIM1 overexpressing cells with ER Ca2+ release triggered by the addition of DMP1. Note formation of extensive cellular process.
3.4. Generation of a cell culture model to assess the role of STIM1- mediated Ca2+ influx
To assess the role of STIM1 in odontogenic differentiation and mineralized matrix formation, we monitored changes in Ca2+ influx with molecular overexpression or knockdown of STIM1 in DPSCs. Establishment of the genetically modified cell-lines were confirmed by RTPCR. Fold change of expression of exogenous STIM1 was 19 fold higher than the control and the fold change for the knockdown was 0.21 fold (data not shown). Western blot analysis (Fig 4A) confirmed high expression levels of STIM1-CFP fusion protein with a molecular size of ~115kDa. Similarly, stable expression of STIM1-specific ShRNA in DPSCs (DPSC-STIM1 KO) resulted in reduced expression levels of endogenous STIM1 (Fig 4B). To determine whether molecular overexpression and down-regulation of STIM1 influences Ca2+ influx through store-operated Ca2+ channels, we measured Fura-2 AM 340/380 ratio. Basal Ca2+ levels were the same in the control and genetically modified cells, interestingly, after addition of DMP1 to deplete ER Ca2+ stores, DPSC-STIM1OE cells showed a 2-fold increase in intracellular Ca2+ levels when compared with DPSC-STIM1KO and control DPSC cells (Fig 4C). Next addition of Ca2+ to trigger SOCE after depleting ER Ca2+ store, demonstrated induction of robust calcium influx in STIM1-OE cells and markedly reduced in STIM1-KO cells (Fig. 4C). These findings show changes in the overall magnitude of SOC entry with changes in STIM1 expression. The increased Ca2+ flux in STIM1 overexpressing cells can upregulate signaling events and promote odontogenic differentiation of DPSCs.
Fig 4. Generation of transgenic DPSC cell-lines and imaging of DMP1 induced SOCE:
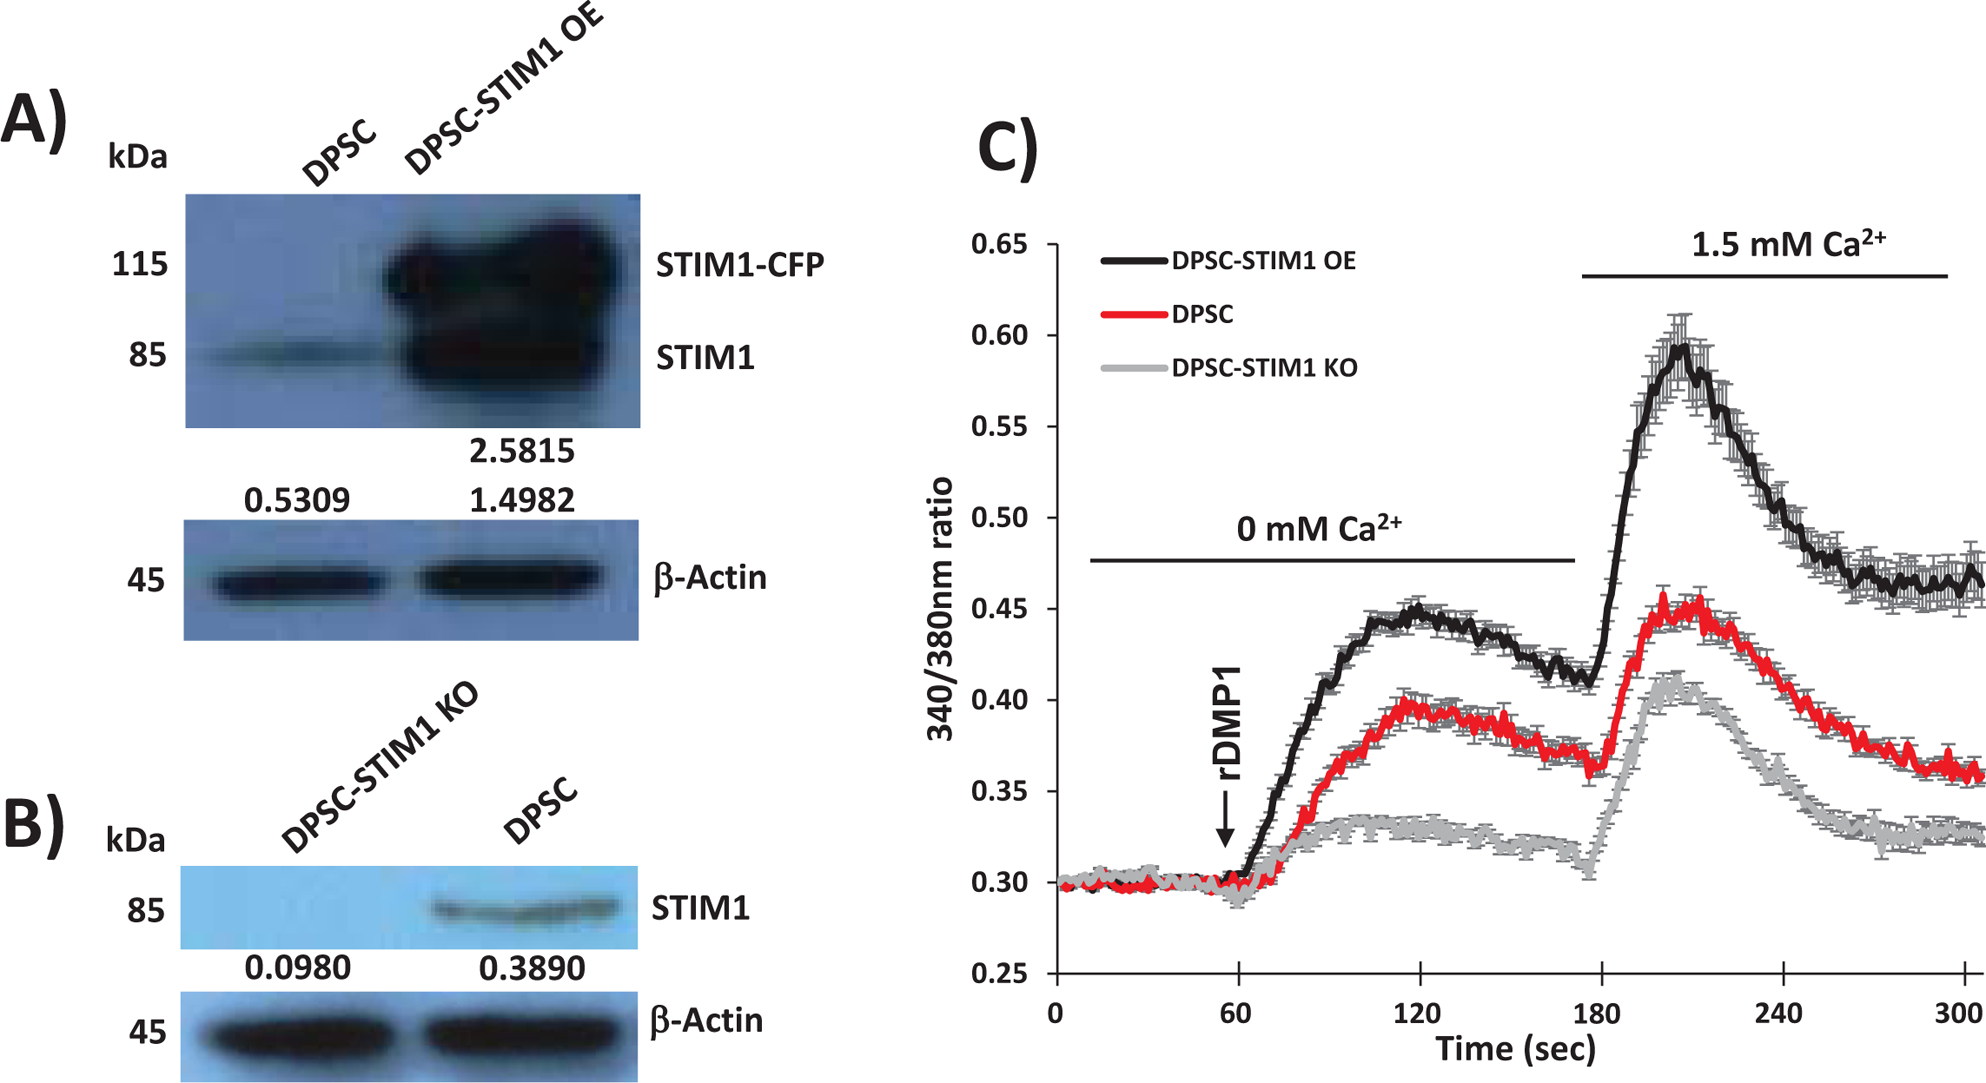
(A) Western blotting to demonstrate the overexpression of STIM1 (DPSC-STIM1OE). The relative STIM1 densities to β-actin are shown. Note presence of exogenous CFP-STIM1.
(B) Western blotting to demonstrate the knockdown of STIM1 (DPSC-STIM1 KO). The relative STIM1 densities to β –actin are shown. Note lower expression level of endogenous STIM1.
(C) [Ca2+]i release was measured in Fura-2AM-loaded control DPSCs and the transgenic cell lines as described in “Materials and Methods”. Representative traces show the average changes in intracellular Ca2+ (F 340/380) recorded simultaneously in a number of individual cells. DMP1 was added (indicated by the arrow) in the absence of Ca2+ to deplete Ca2+ stores followed by addition of 1.5mM Ca2+ to trigger SOCE to replenish the intracellular Ca2+. Note higher calcium release and influx in DPSC-STIM1OE cells when compared with DPSC-STIM1KO and control DPSC cells.
3.5. Odontogenic differentiation and mineralization of DPSCs, DPSC-STIM1OE and DPSC-STIM1KO cells
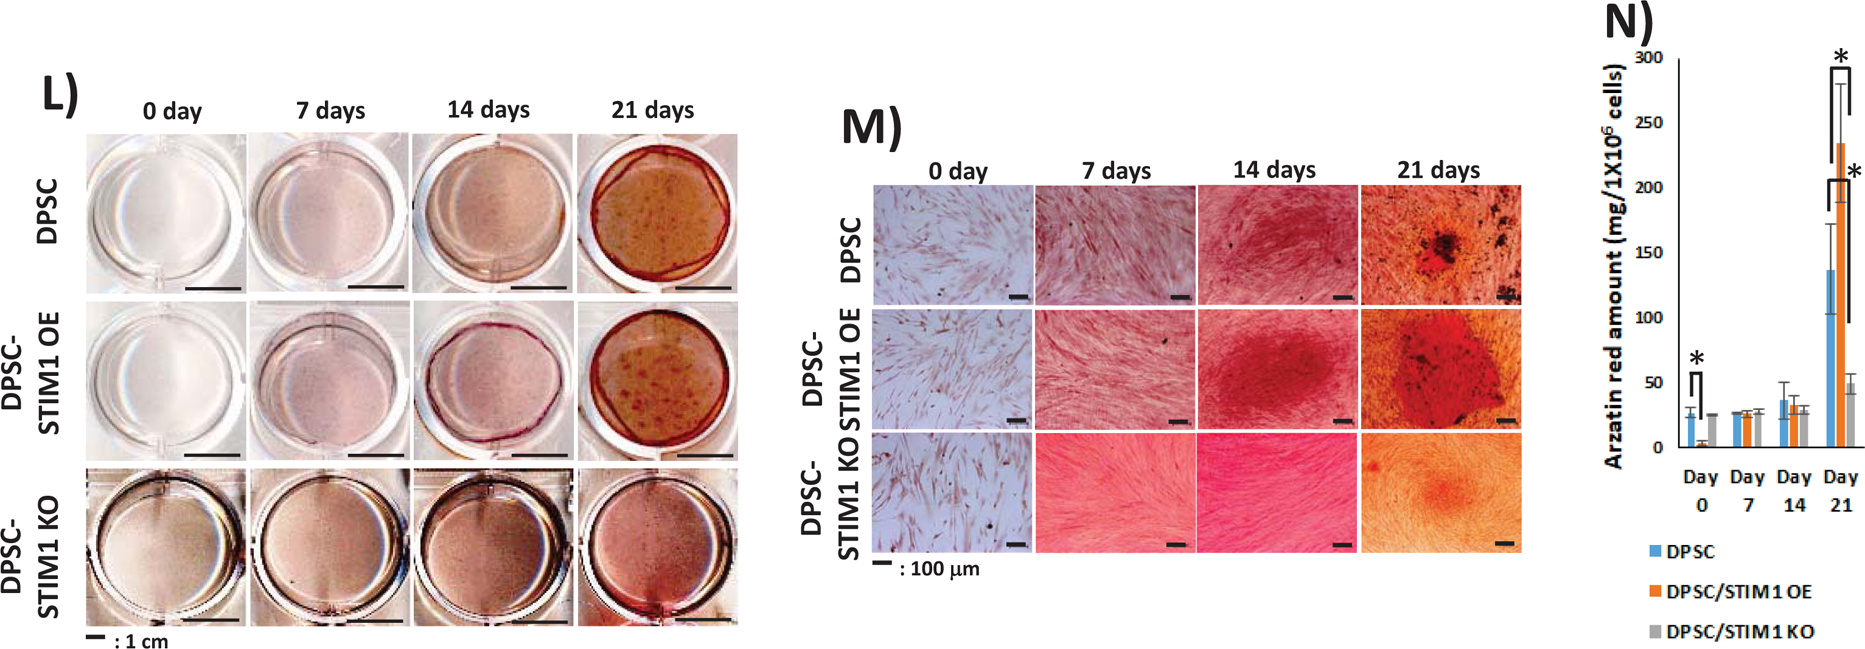
Having confirmed that STIM1 plays a role in refilling and maintenance of Ca2+ homeostasis, after ER Ca2+ depletion, we then examined if STIM1 activates odontoblast differentiation of DPSCs. In order to assess the influence of STIM1 on the odontogenic differentiation of DPSCs, the cells were cultured in mineralization medium for 0, 7, 14 and 21 days. Baseline expression levels at day 0 were first determined (Suppl Fig 2). RT-qPCR results in Fig5A &B show higher expression of STIM1 and Orai1 at 7 days, however, STIM1 remained upregulated until 21 days and Orai1 remained unchanged with fold changes from 0.68 to 1.27 in STIM1-OE cells. Expression of early genes such as ALP (Alkaline phosphatase) a key enzyme required for matrix mineralization and transcription factors such as osterix and Runx2 exhibited higher expression levels in STIM1-OE cells and lower levels in knocked down cells (Fig 5C,D & E). Matrix genes such as Col1a1, Col X and OCN (osteocalcin) exhibited a similar trend (Fig 5F, G & I). OPG (Osteoprotegrin) plays an important role in bone metabolism and gene expression in STIM1-OE cells showed higher expression than control DPSC cells, which was low at 7 and 14 days while DPSC-STIM1-KO cells had lower expression levels at 21 days (Fig 5H). Expression of BMP2 was higher in DPSC-STIM1 OE cells at 7 & 14 days while lower in DPSC-STIM1 KO cells (Fig 5J). Interestingly, DMP1 a key matrix protein in bone and dentin was highly expressed in DPSC-STIM1 OE cells at all-time points and downregulated in DPSC-STIM1 KO cells (Fig 5K). Along with elevated gene expression levels of key mineralization-related proteins, Alizarin–red staining confirmed the presence of calcified matrix at 14 & 21 days (Fig. 5L&M). Quantification of the calcium deposits at 21 days showed a significant increase of 1.7 fold in DPSC-STIM1 OE cells when compared with DPSC cells and a significant decrease (2.78 fold) in KO cells when compared with the mineral deposits of DPSC cells at the same time point (Fig. 5N). Thus, DPSC-STIM1 OE cells demonstrated increased mineralization potential, while knockdown of STIM1 resulted in attenuated mineral deposition.
Fig 5. Gene expression analysis and differentiation potential of transgenic DPSCs:
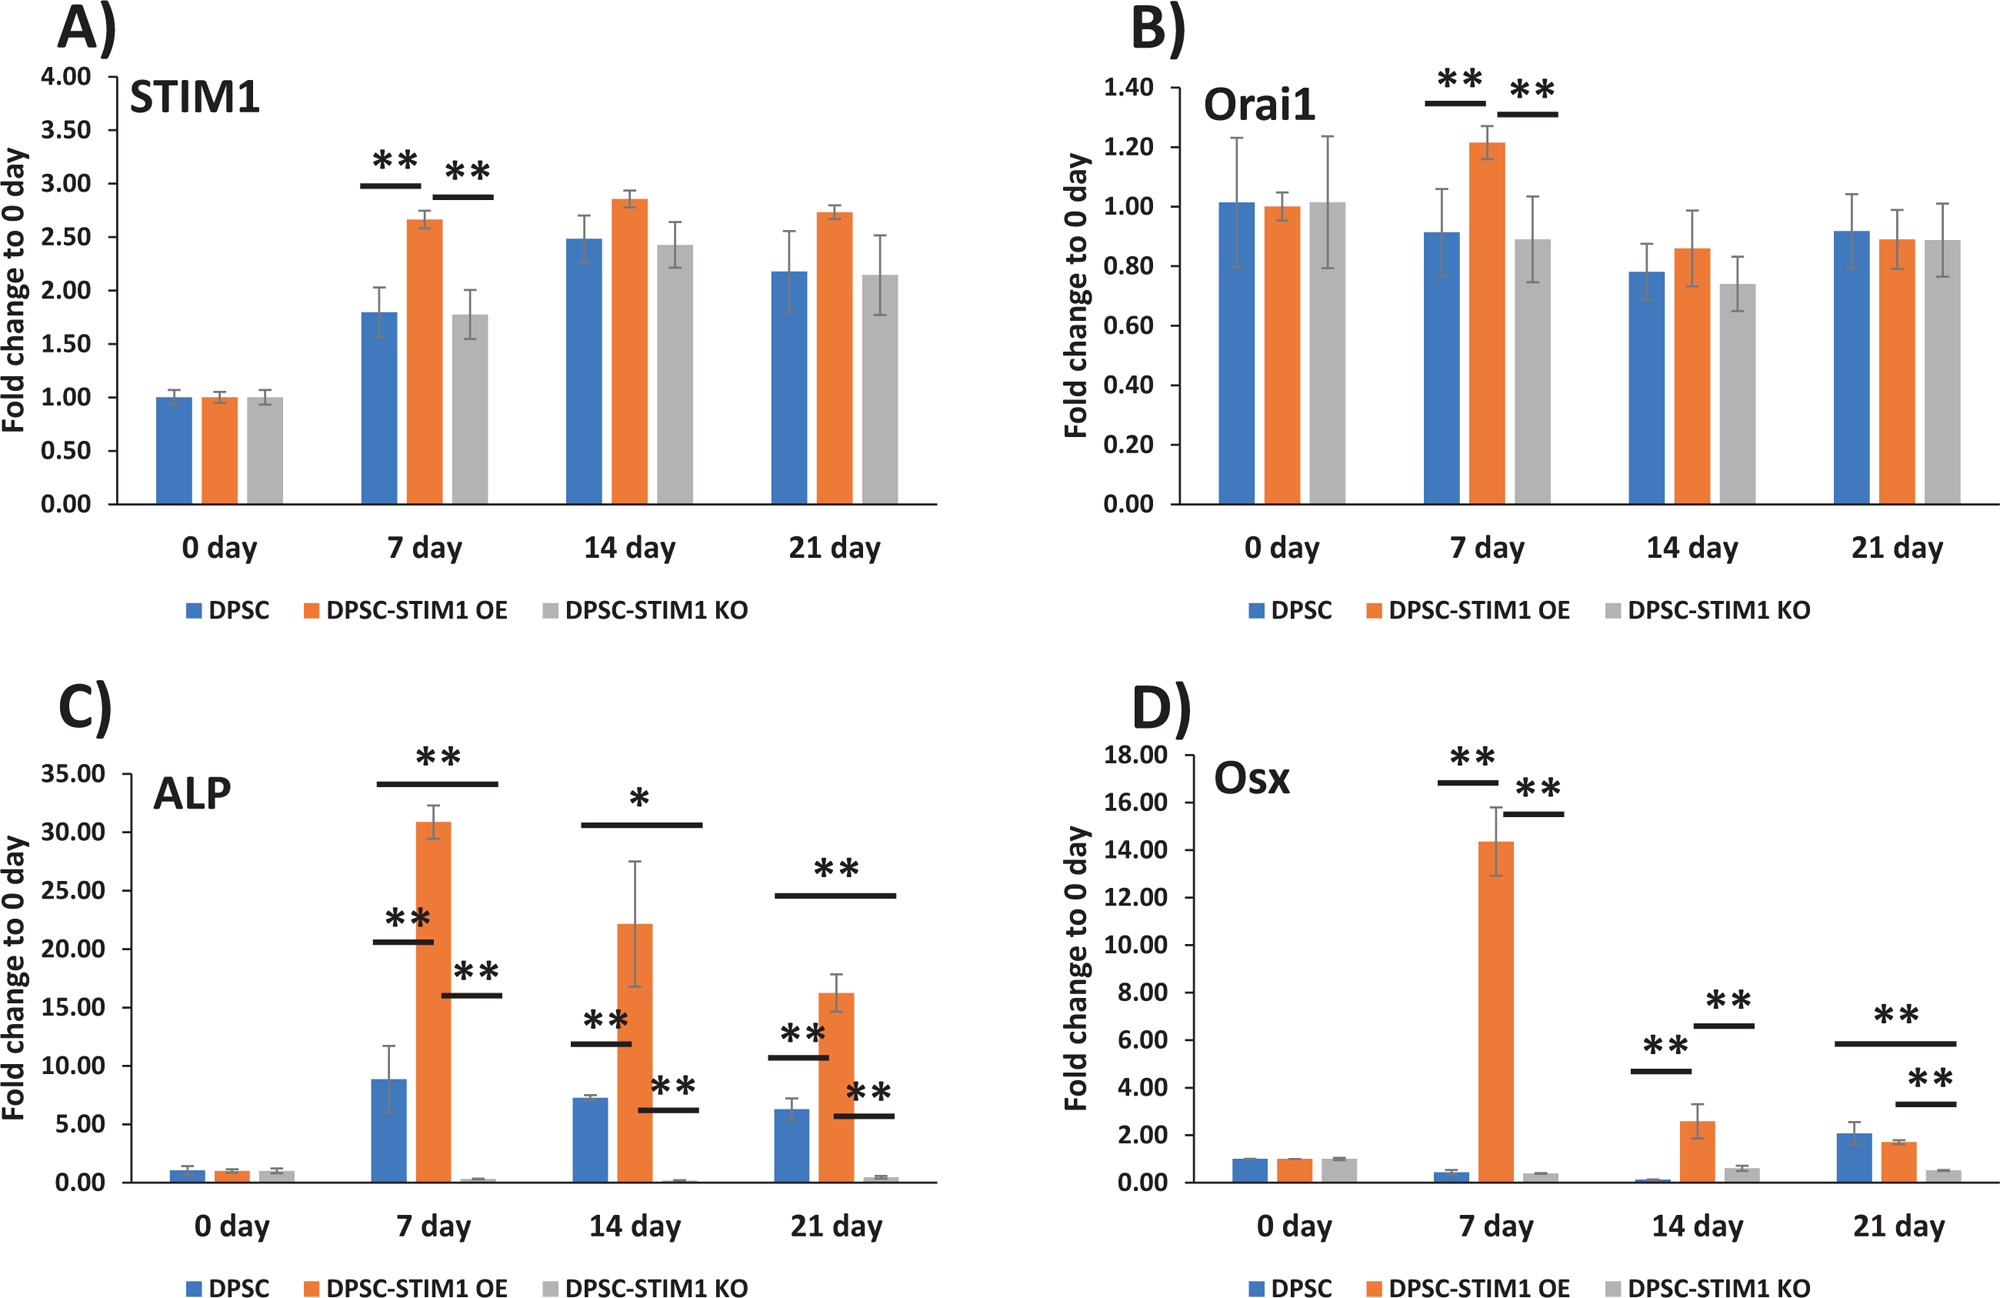
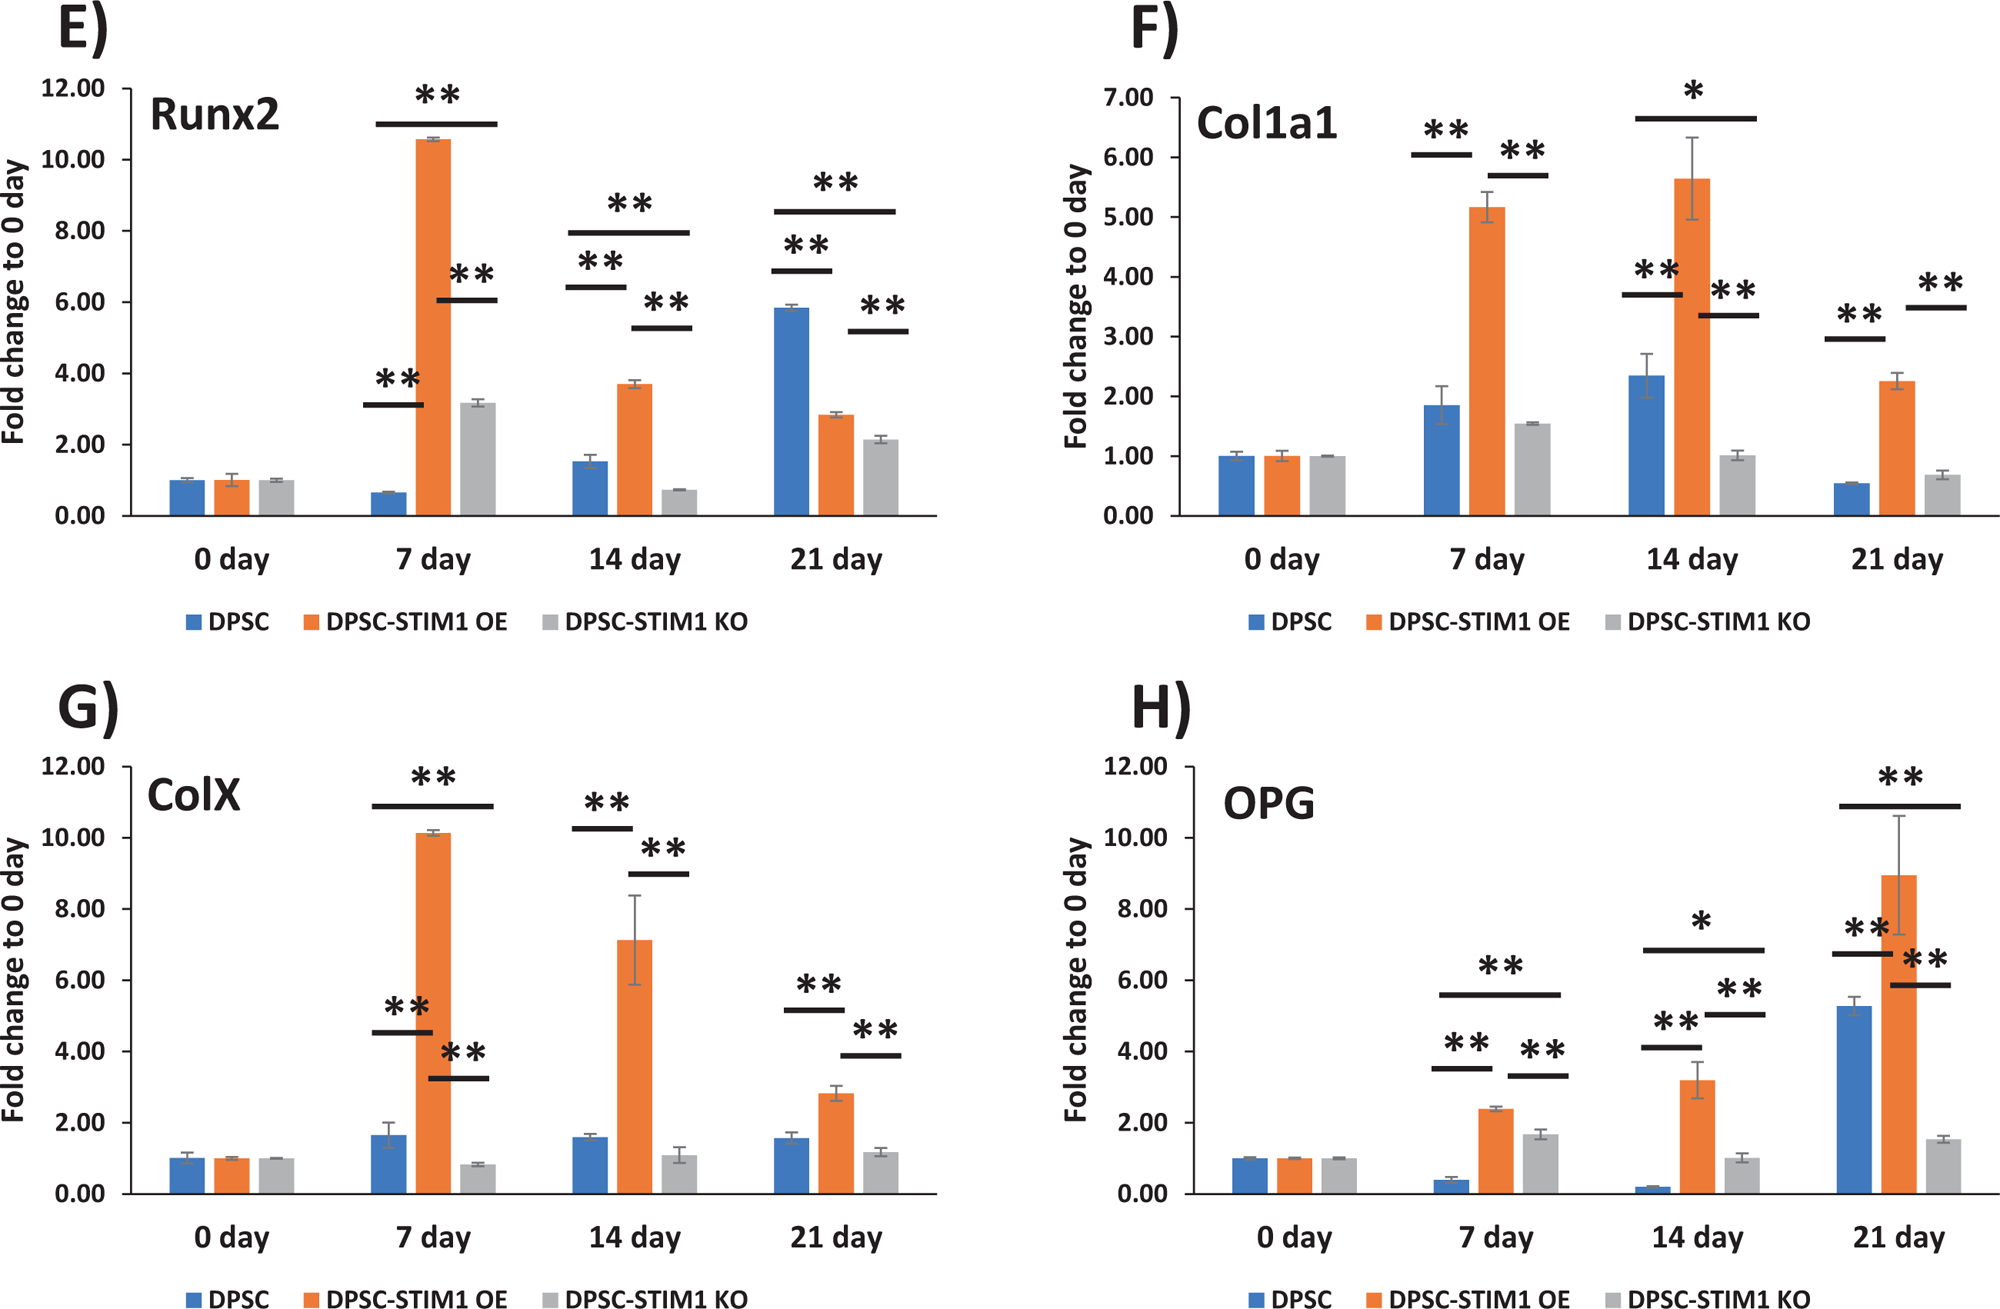
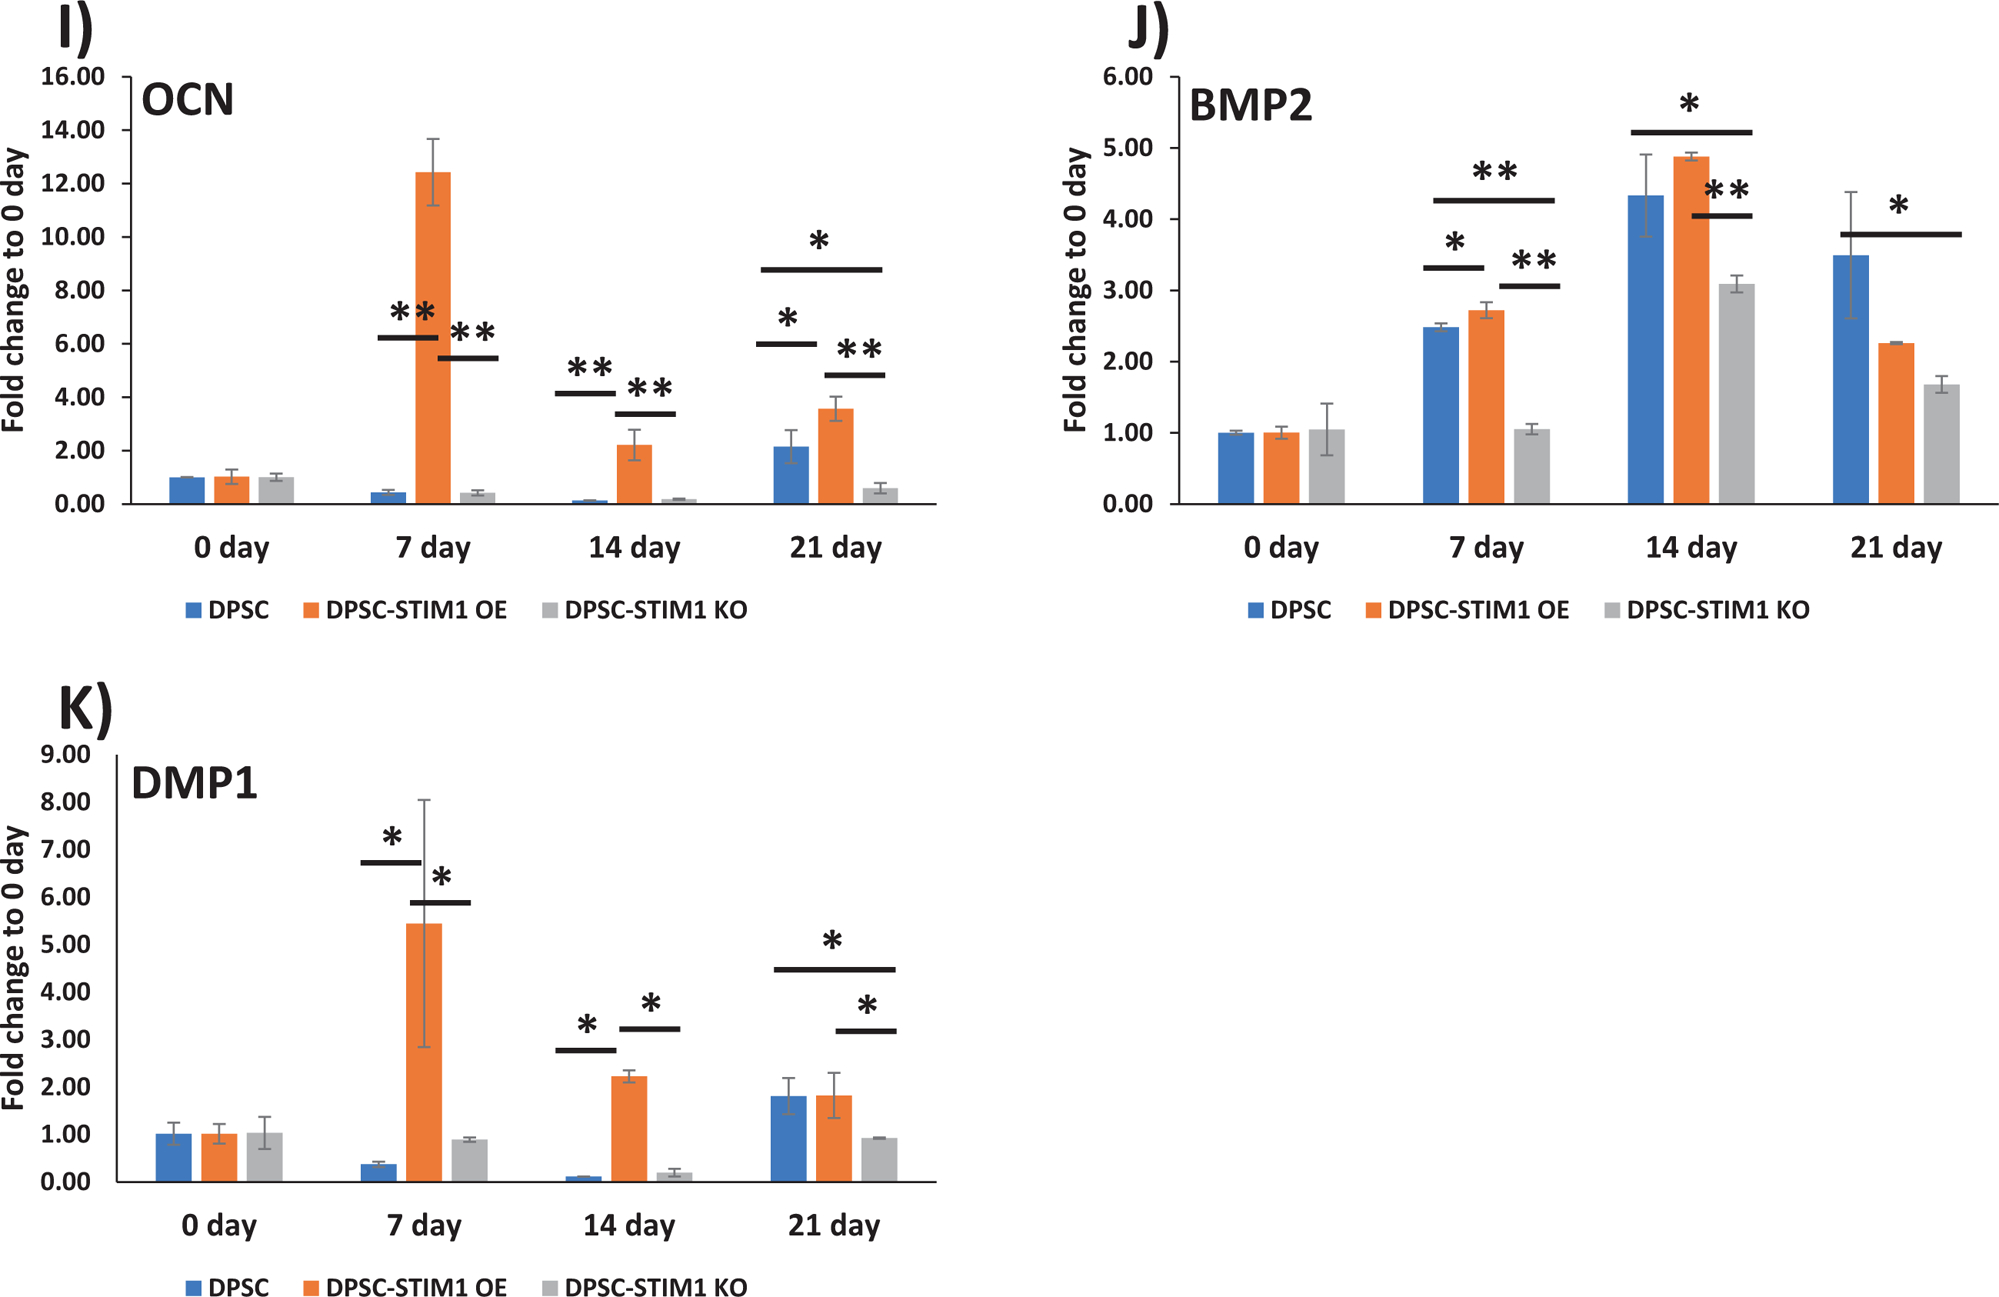
(A to K) Gene expression analysis of the “early” and “late” differentiation markers expressed in control and genetically modified DPSCs cultured under differentiation conditions at 7, 14 &21 days. GAPDH expression was used as an internal control. Changes in gene expression were assessed by comparing to day 0 and means and SDs of changes compared to day 0 are shown. Statistically significant differences are indicated. *: p<0.05, **: p<0.01.
(L) Differentiation of DPSCs, DPSC-STIM1OE and DPSC-STIM1KO cells were assessed by growing under osteogenic differentiation conditions over a period of 0,7,14 & 21 days and mineralized nodules containing calcium was visualized using Alizarin red staining.
(M) Higher magnification show calcium deposits in the mineralization cultures at various time points.
(N) Quantification of the alizarin stain. Statistically significant differences are indicated at day 0 & 21. *: p<0.05.
3.6. Characterization of the structural features of the ECM deposited by DPSC and genetically modified DPSCs by FESEM
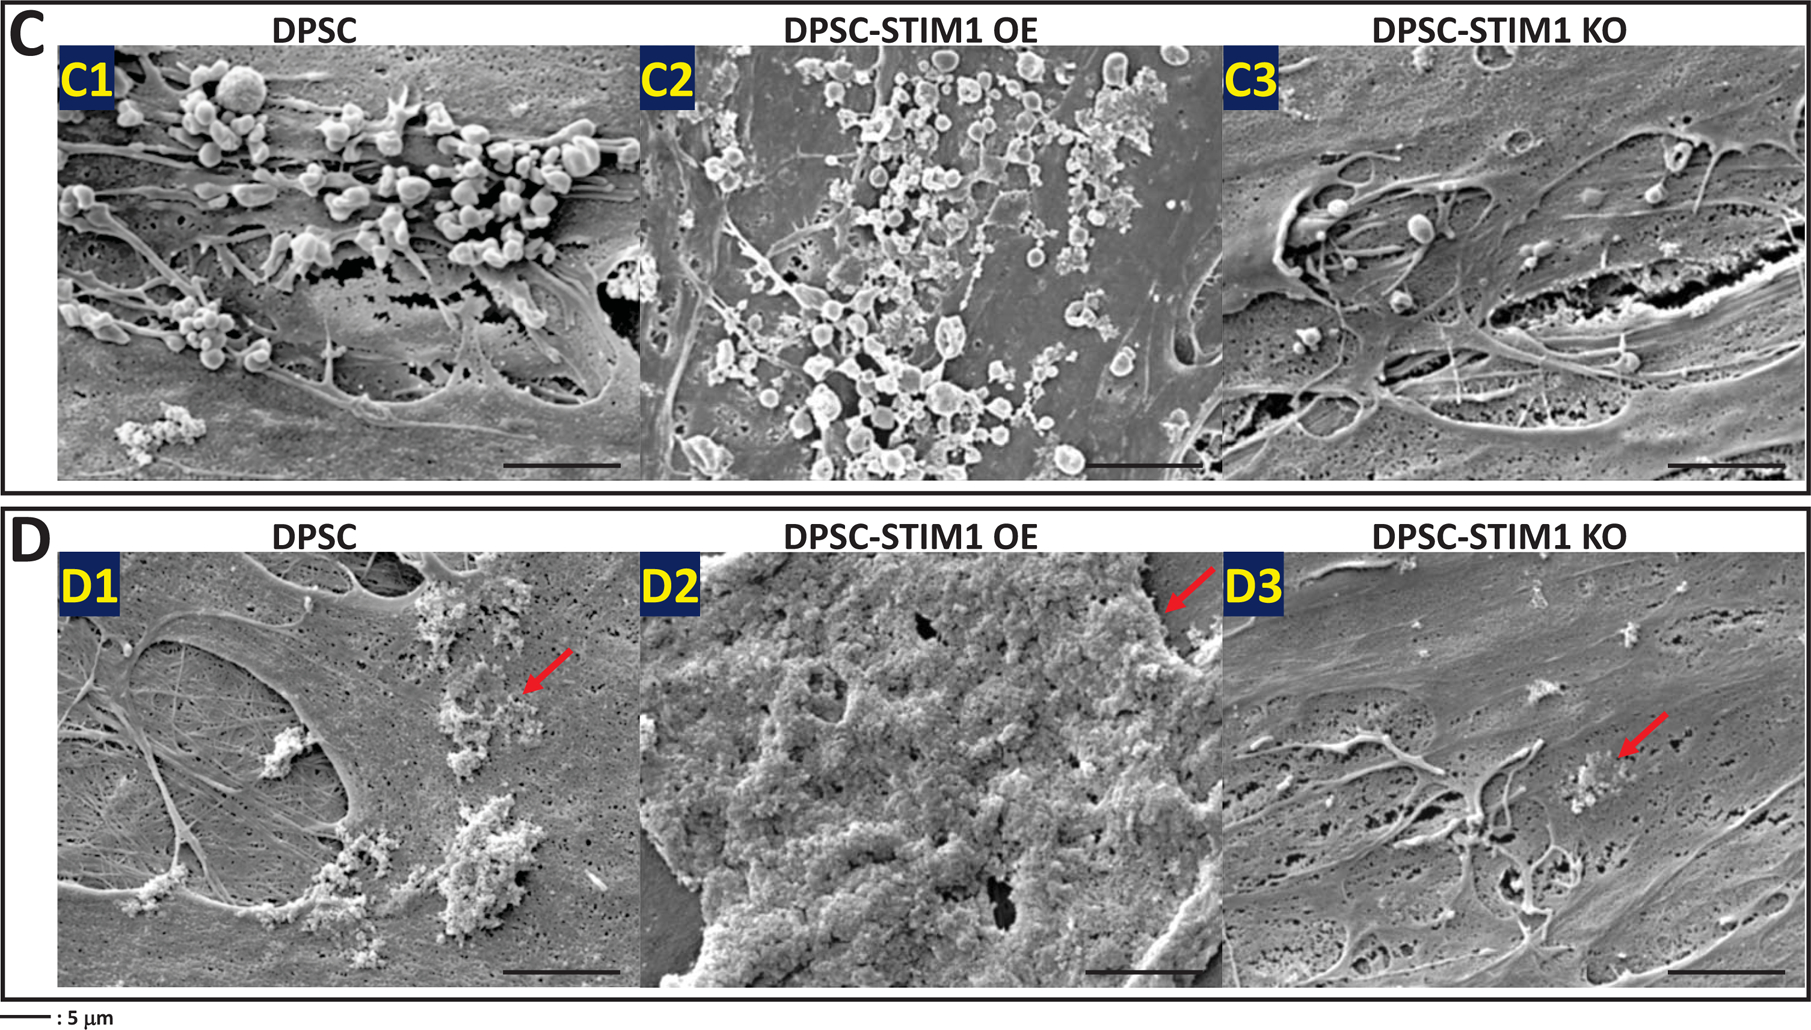
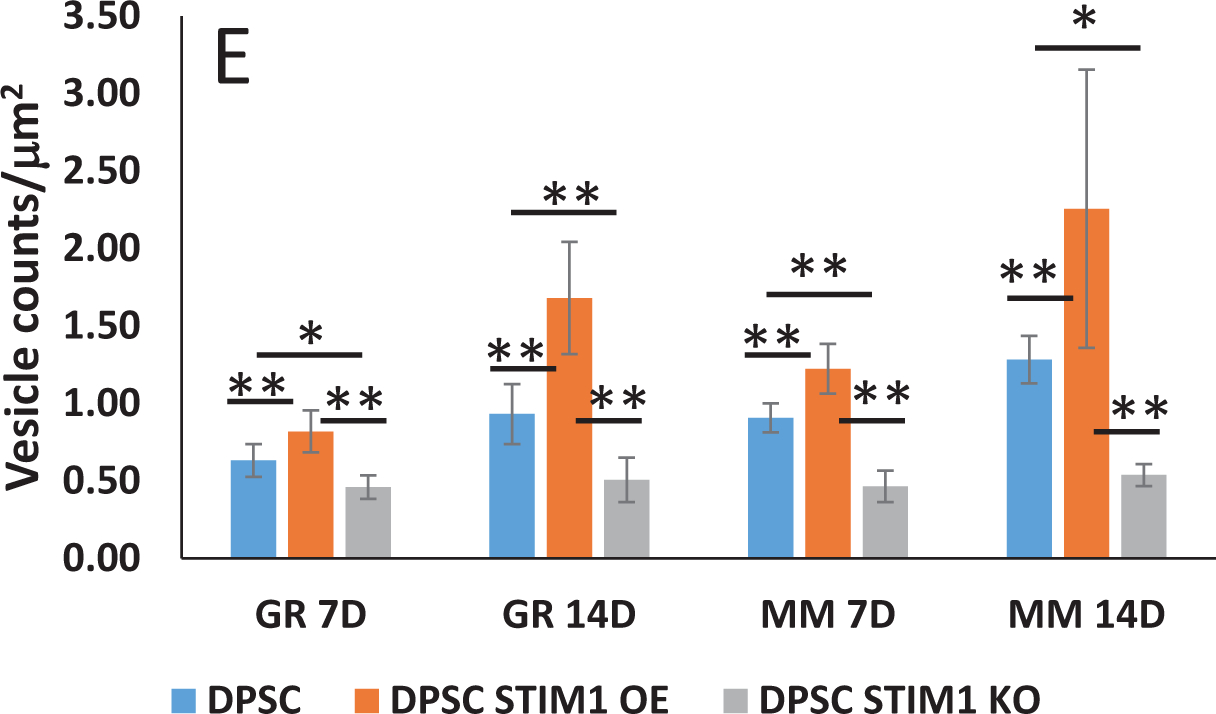
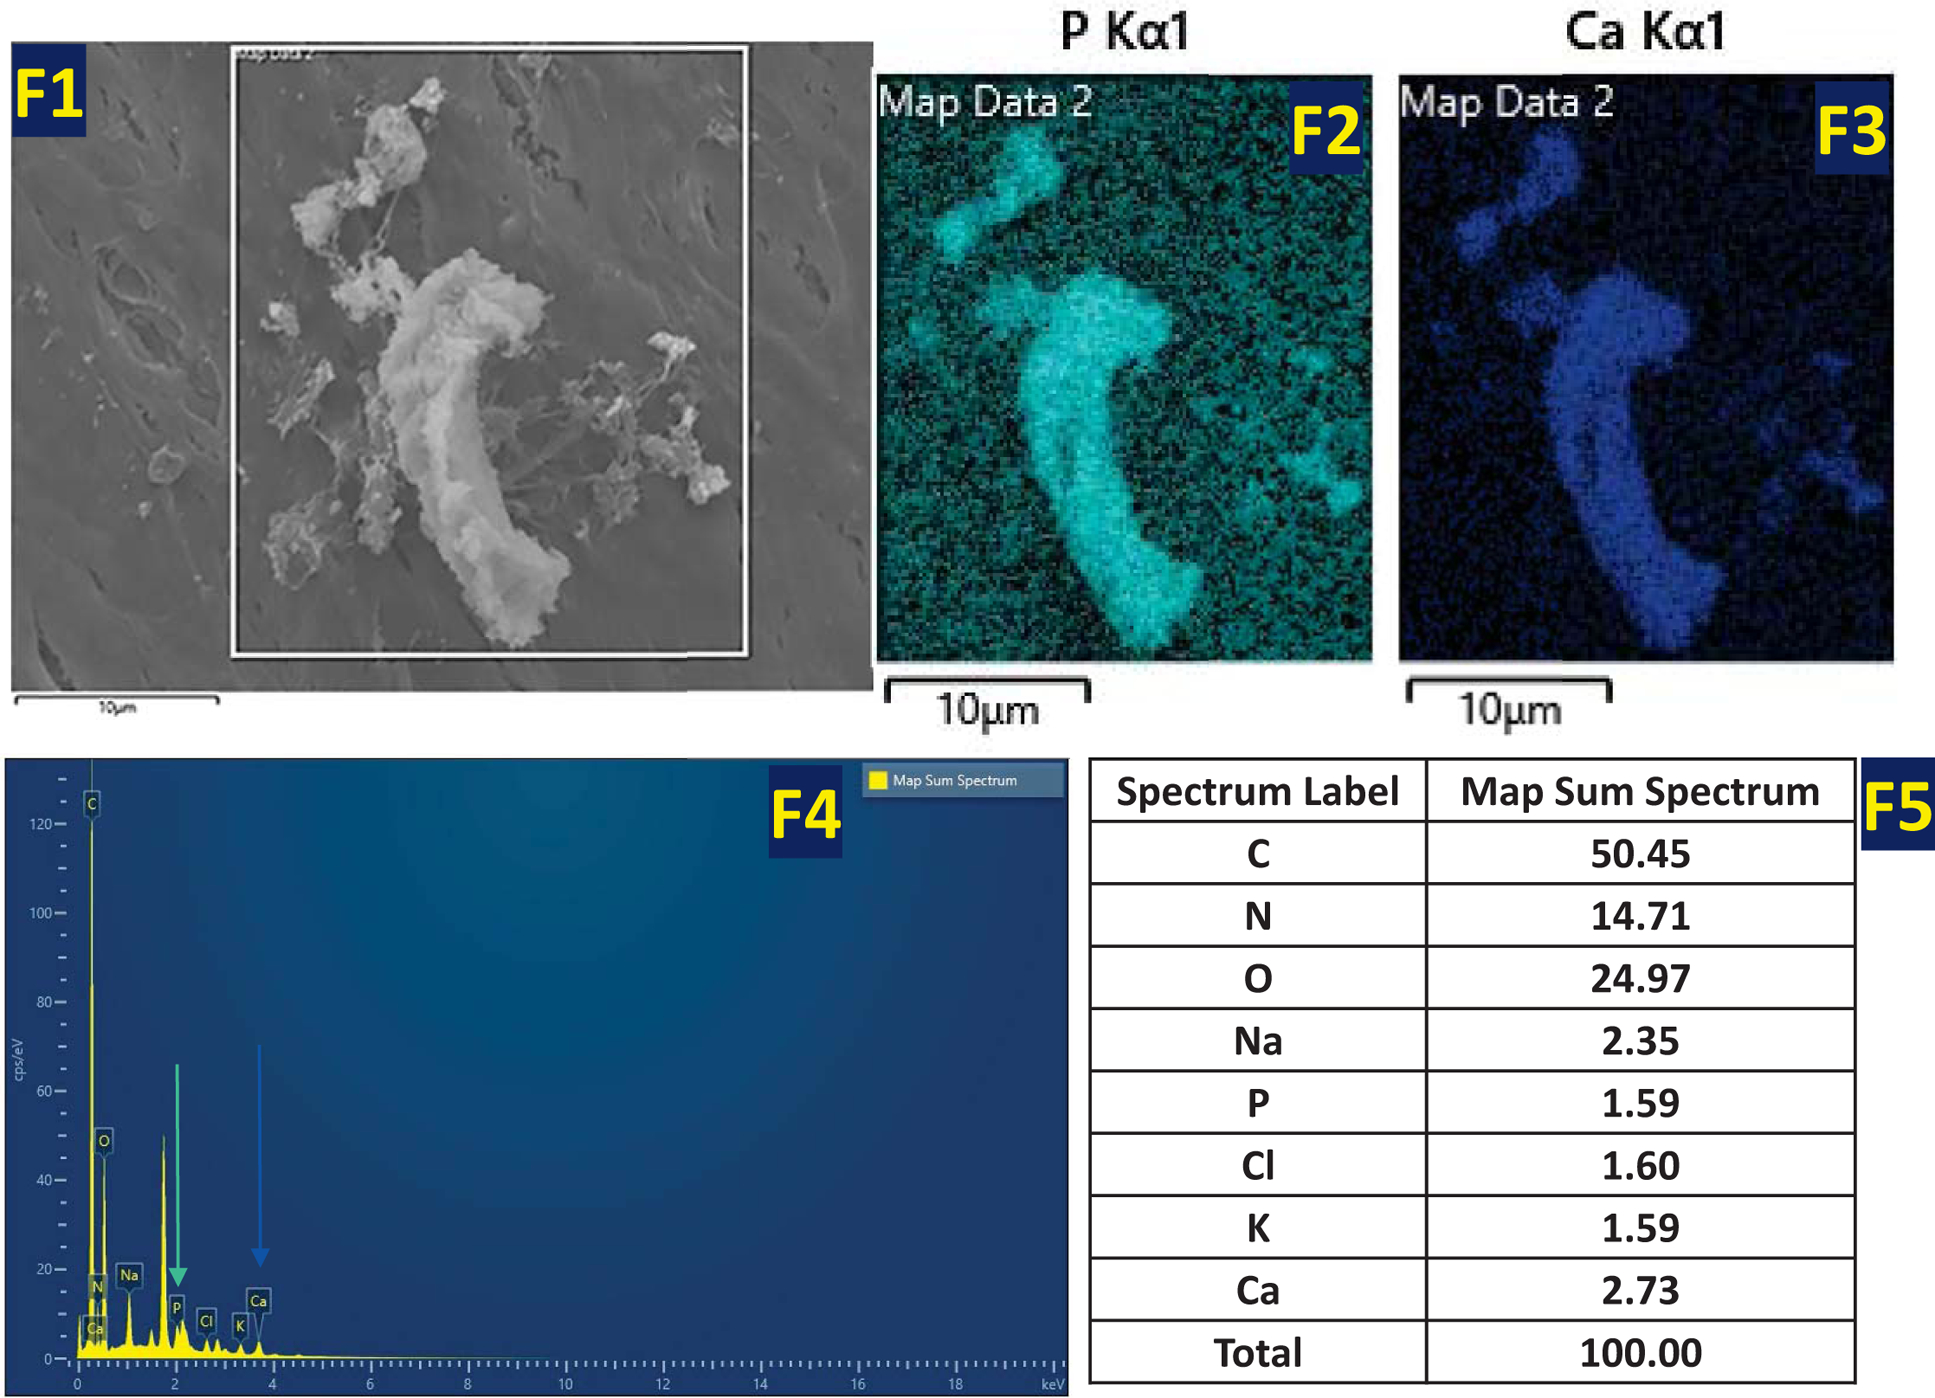
FESEM images were obtained under both growth and differentiation conditions at 14 days. Fig 6A (A1–A3) & 6B (B1–B3) show the presence of vesicles in DPSCs, DPSC-STIM1 OE and STIM1-KO cells under growth conditions. However, higher amounts of vesicles and mineral deposits were observed in STIM1 overexpressing cells. Development of several long cellular processes and a highly dense ECM was also observed with DPSC-STIM1 OE cells. Under differentiation conditions, the DPSC-STIM1 OE cells secreted higher amounts of extracellular vesicles when compared with the control and DPSC-STIM1 KO cells Fig 6C (C1–C3). Significant number of vesicles were observed in STIM1-OE cells under both growth and differentiation conditions (Fig 6E). Interestingly, mineral deposits were also more in DPSC-STIM1OE cells and had a greater size and shape than the sparse mineral deposits in the control DPSC and in the STIM1-KO cells (Fig 6 D1–D3). Energy Dispersive X-ray spectrometry observations presented in Fig 6F confirm that the mineral deposited contains Ca2+ cation (blue) and Pi anion (cyan) (Fig 6F2–F5). The localization maps revealed colocalization of Pi and Ca2+ in the same mineral deposit. (Fig 6F1–F3). Thus, STIM1 promoted the deposition of calcium phosphate mineral on the extracellular matrix.
Fig 6. Electron Microscopy images of the secreted ECM by DPSC, DPSC-STIM1OE and DPSC-STIM1KO cells.
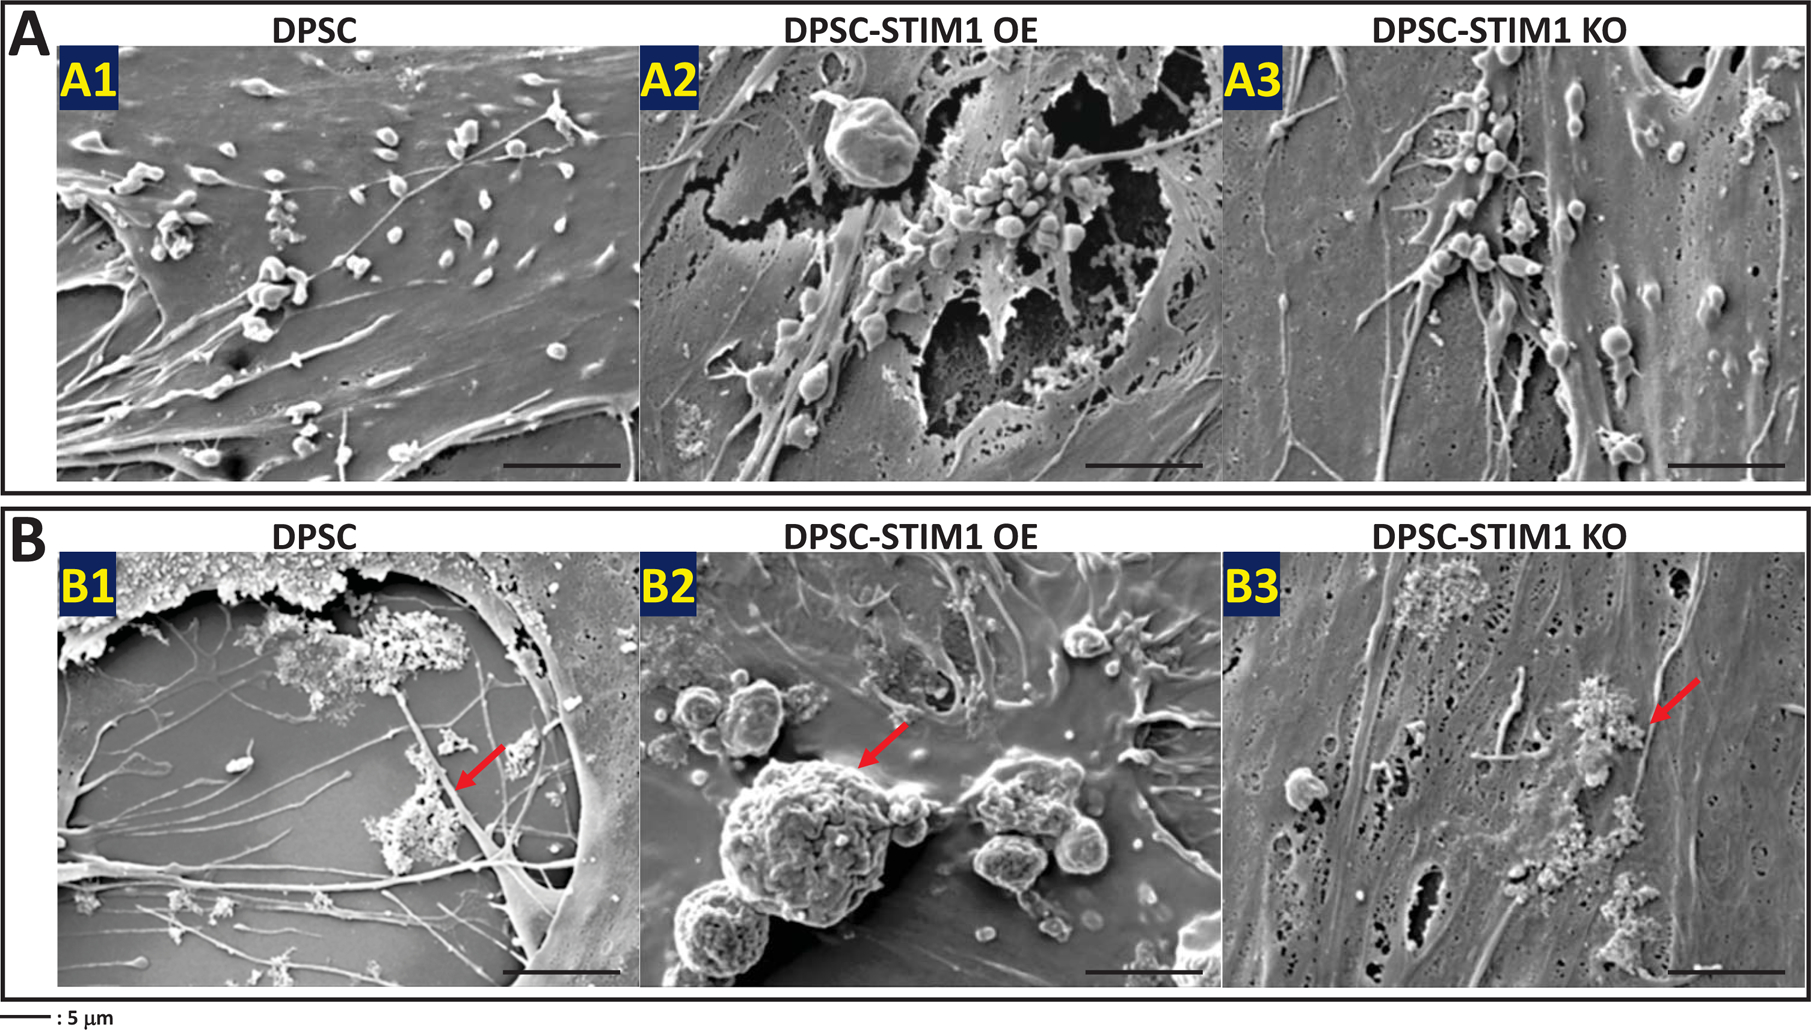
(A) Representative FESEM images showing the presence of vesicles in the ECM secreted by the 3 cell types (A1–A3) when cultured under growth media conditions for 14 days.
(B) Representative FESEM images showing mineral deposition by the 3 cell types (B1–B3) cultured under growth conditions for 14 days.
(C) Representative FESEM images showing the presence of vesicles in the ECM deposited by 3 cell types (C1–C3) when cultured for 14 days under differentiation conditions.
(D) Representative FESEM images showing the deposition of mineral in the ECM of the 3 cell types (D1–D3) when cultured for 14 days under differentiation conditions.
(E) Number of vesicles secreted by the 3 cell types under different culture conditions. Statistical significance as indicated. **p<0.01; *p<0.05.
(F) Spatial distribution of Pi (Cyan map) and Ca 2+ (Blue map) as obtained by EDX analysis of the mineral deposited by DPSC-STIM1OE cells (F1–F3). Element spectrum and composition (F4 & F5).
3.7. Radiographic imaging and micro-CT analysis of tooth-alveolar bone complex structure in STIM1 KO mice
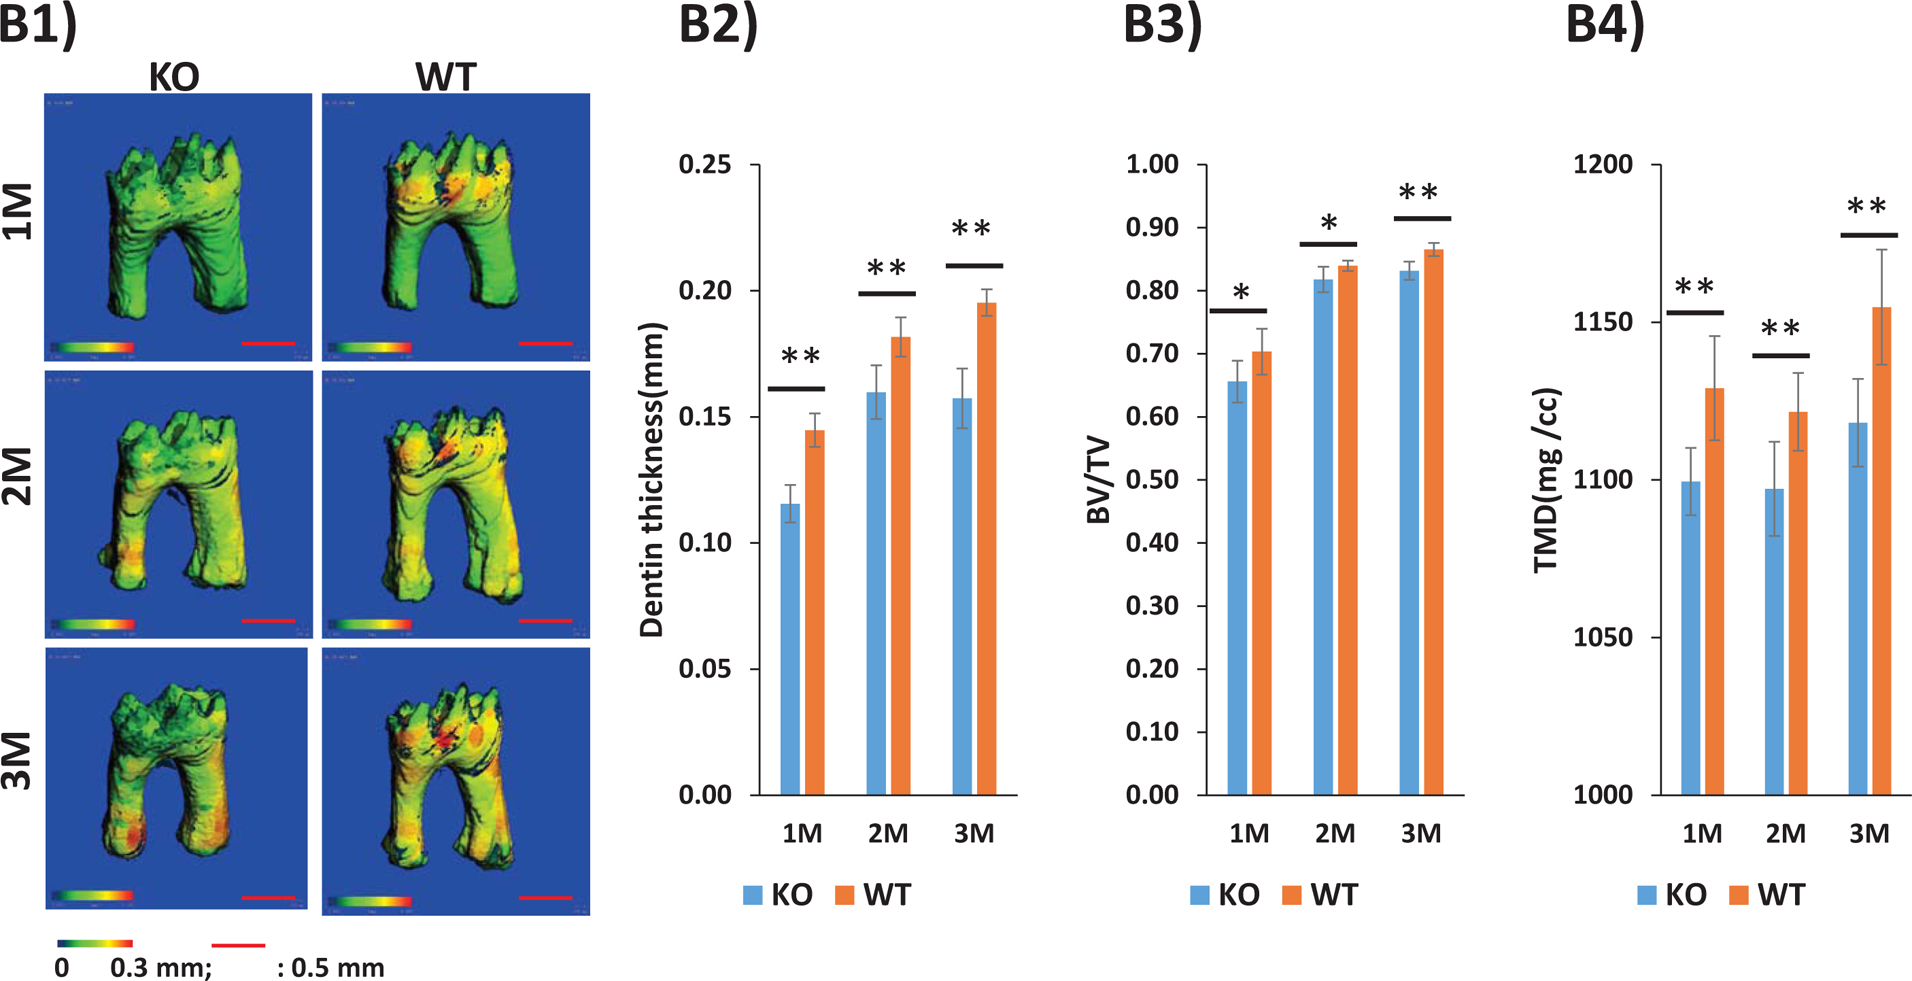
In this study, we used a cohort of 1, 2, and 3-month-old male STIM1 KO mice and their wild type littermates. Radiographical images obtained from Faxitron imaging show that STIM1 KO mouse had poorly mineralized alveolar bone; however, no defects were apparent macroscopically with the teeth (Fig 7A). Quantitative high resolution analysis of the micro CT image data and segmentation analysis demonstrated microstructural defects in the thickness of the mineralized crown and root dentin in the tooth from STIM1 KO mice with crown dentin being significantly thinner when compared to the walls of the root dentin (Fig 7B1). Mineralized dentin is fenestrated with dentinal tubules, therefore the dentin volume fraction (BV/TV) defined as the volume of mineralized dentin per unit volume of interest, were significantly lower in STIM1 KO mice at all-time points (Fig 7B3). Silencing STIM1 also led to a significant decrease in dentin thickness and tissue mineral density (TMD) at 1, 2 & 3months of age (Fig 7B2& B4). Similar results were obtained with crown and root dentin, however, the defects in crown dentin was more pronounced (Suppl Fig 3 &4).
Fig 7. Characterization of the tooth-alveolar bone complex of STIM1 knockout mice by radiographic and micro-computed tomographic analyses:
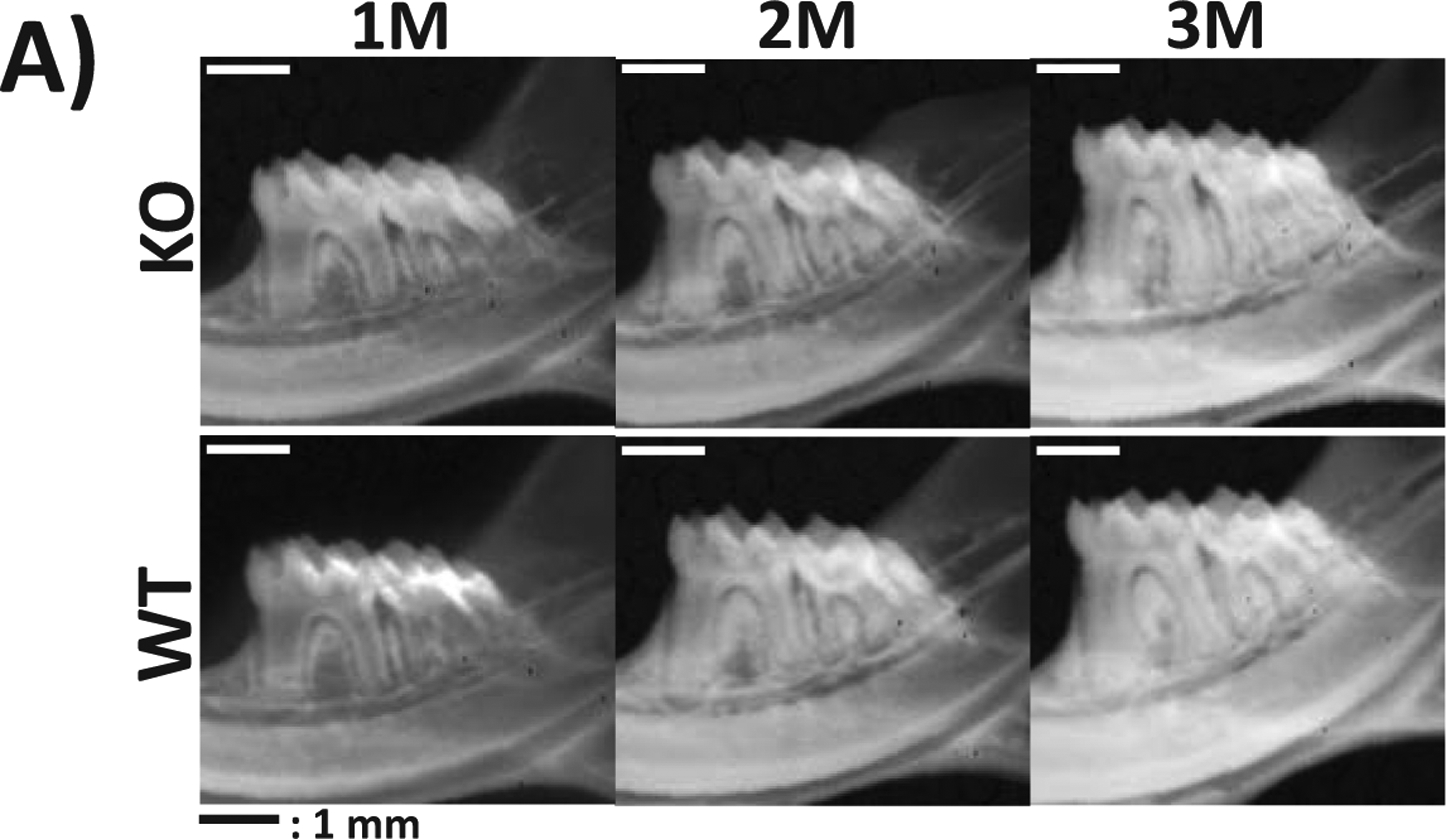
(A) Representative radiographs show disordered alveolar bone and dentin at 1, 2 and 3 months of age in STIM1-KO mice when compared with the wild type (WT).
(B) Representative segmentation analysis of the micro-CT obtained images of the first molar from 1, 2 & 3 months WT and STIM1-KO mice (n=6). Overall dentin thickness varies from 0–0.3mm based on segmentation analysis (B1). Dentin thickness, Dentin volume fraction (BV/TV) and tissue mineral density (TMD) are shown in B2–B4 respectively.
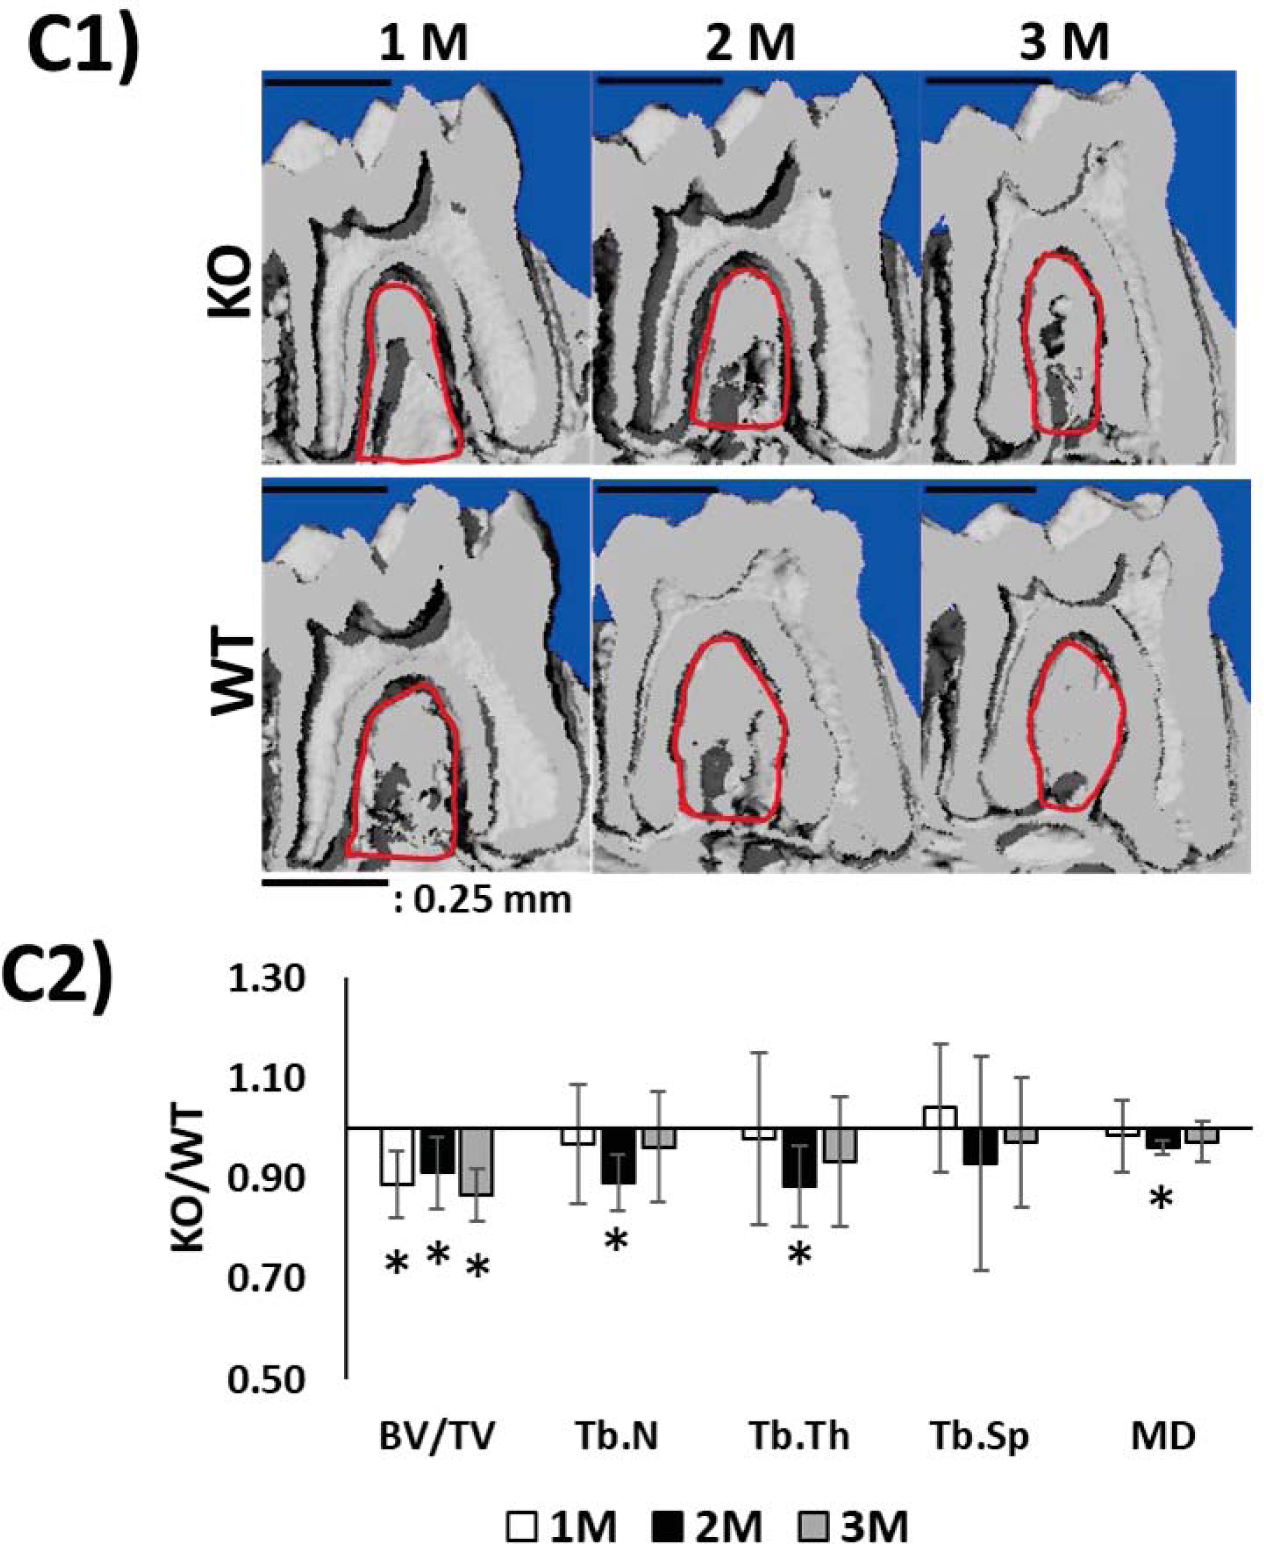
(C) The μCT 3D longitudinal segmentations showing alveolar bone defects surrounding the first molar (C1, red circles). (C2) shows morphometric comparison (KO/WT) of the alveolar bone. Note decrease in bone volume (BV/TV); Trabecular number Tb.N, trabecular thickness Tb.Th, trabecular spacing Tb.Sp and mineral density MD. Statistical significance: *: p< 0.05
Dynamic changes in the microstructure of the alveolar bone were also observed (Fig. 7C C1& C2). Morphometric analysis revealed that STIM1- KO mice exhibited a marked decrease in BV/TV (Bone Volume over Total Volume), trabecular number, trabecular thickness (Fig. 7C2). Thus, these results suggest that STIM1 deficiency may inhibit the development and growth of the dentin-alveolar bone complex.
3.7. Silencing STIM1 expression decreases odontoblast differentiation transcripts and protein expression in STIM1- KO pulp cells
To further explore the role of STIM1 in regulating the differentiation of dental precursor cells, the mouse tooth pulp tissue was used to assess gene expression for odontoblast differentiation. RT-qPCR data confirmed low levels of STIM1 mRNA expression with no changes in ORAI1 expression in STIM1-KO mice (Fig 8). However, several matrix genes involved in mineralization such as ALP, Col1a1, BSP, OCN, BMP2, OPN, and DMP1 exhibited reduced expression, when compared with the wild type. Similarly, expression of transcription factors Runx2 and Osx were significantly reduced in STIM1 KO samples (Fig 8).
Fig 8. Gene expression analysis in pulp tissue of STIM1 KO mice.
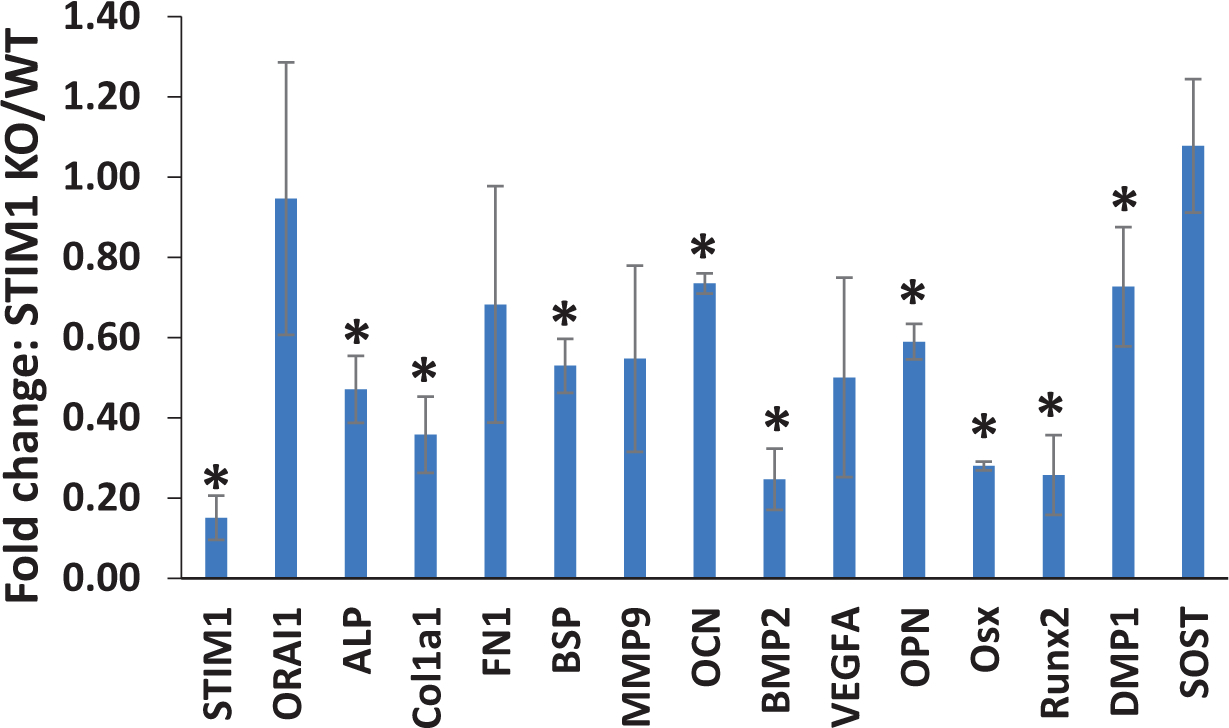
Gene expression analysis of the mineralization related differentiation markers expressed in the pulp tissue of 1 month STIM1-KO mice and compared with age-matched wild type mice. Means and SDs for changes compared to WT are shown. Statistically significant differences are indicated. *: p<0.05
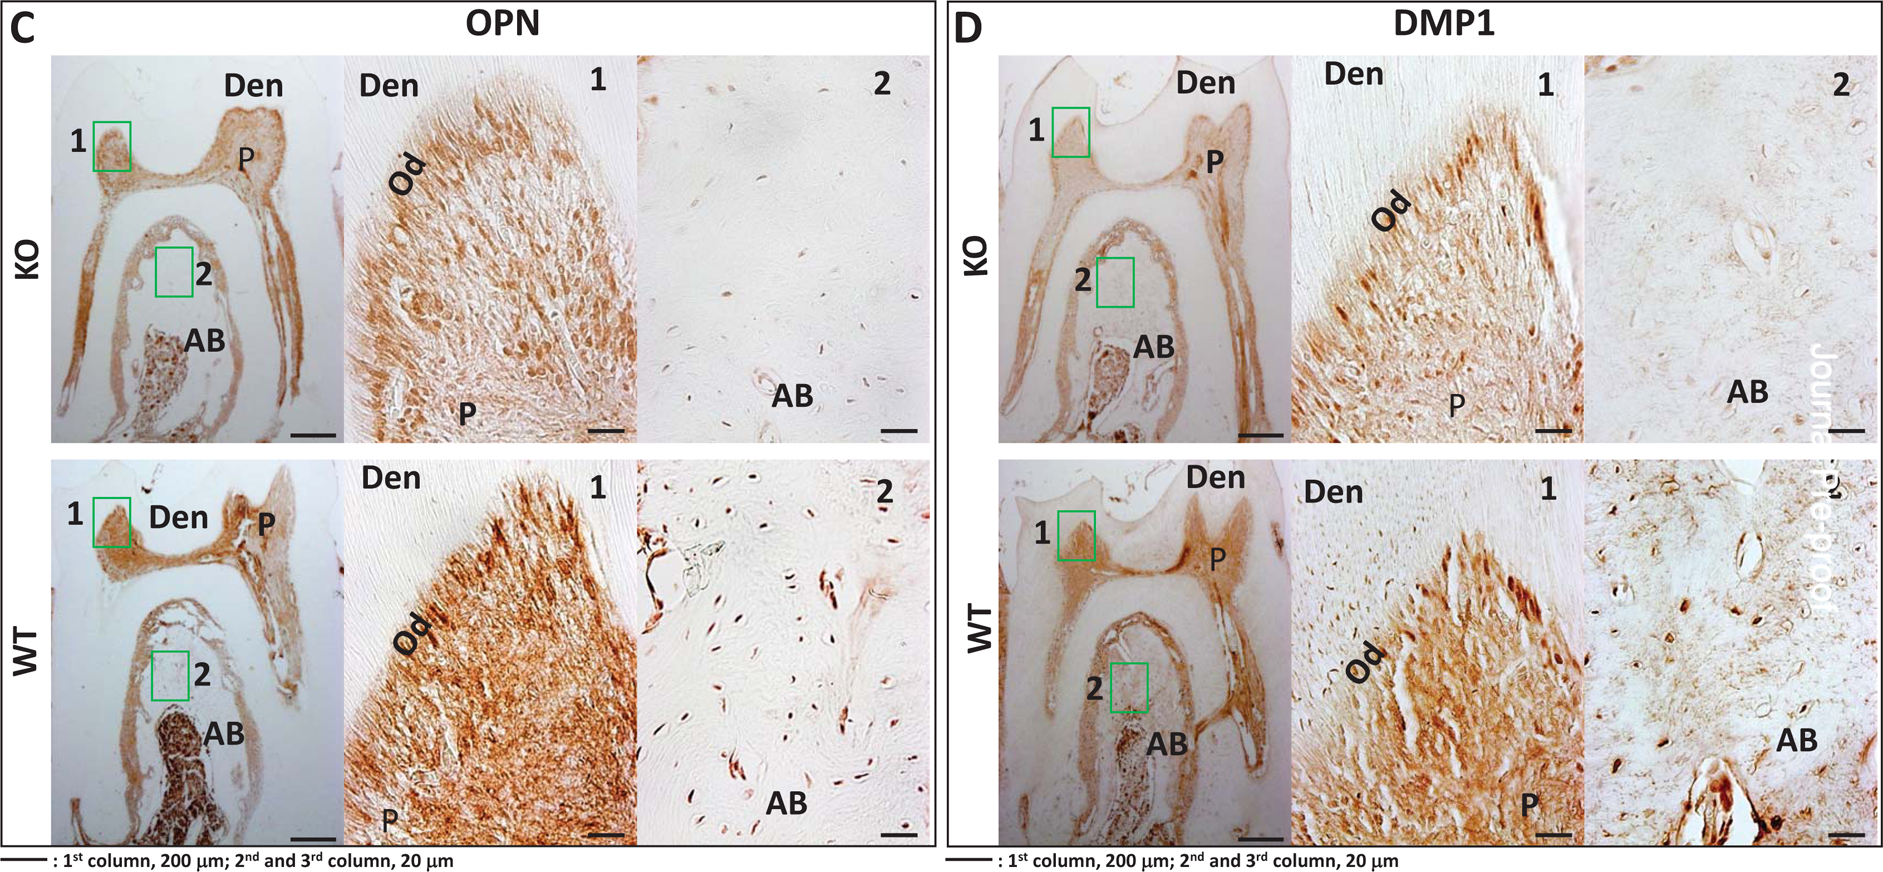
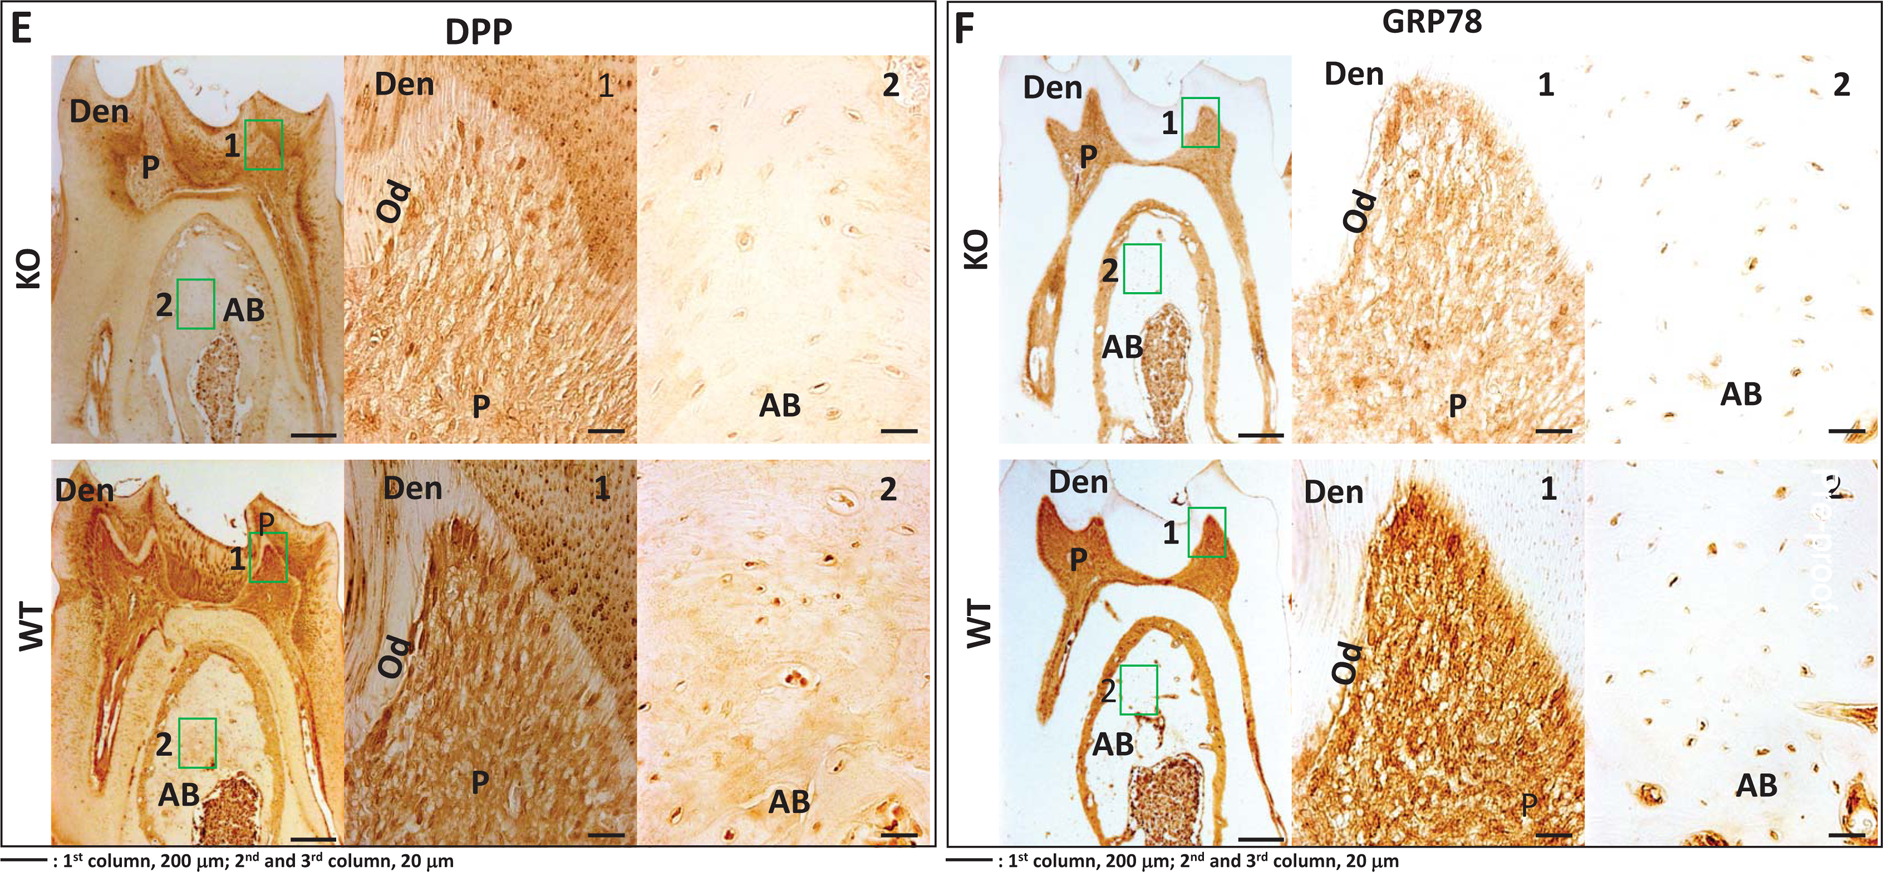
We also examined protein levels of key differentiation markers in the STIM1-KO and wild type mice. Results in Fig 9A–F show lower expression levels of Runx2, Col1a1, OPN, DMP1, DPP & GRP-78 respectively in the tissues of STIM1- deficient mice when compared to the wild type (Fig 9G).
Fig 9. Immunohistochemical analysis of matrix proteins in 2 month old WT and STIM1-KO mice.
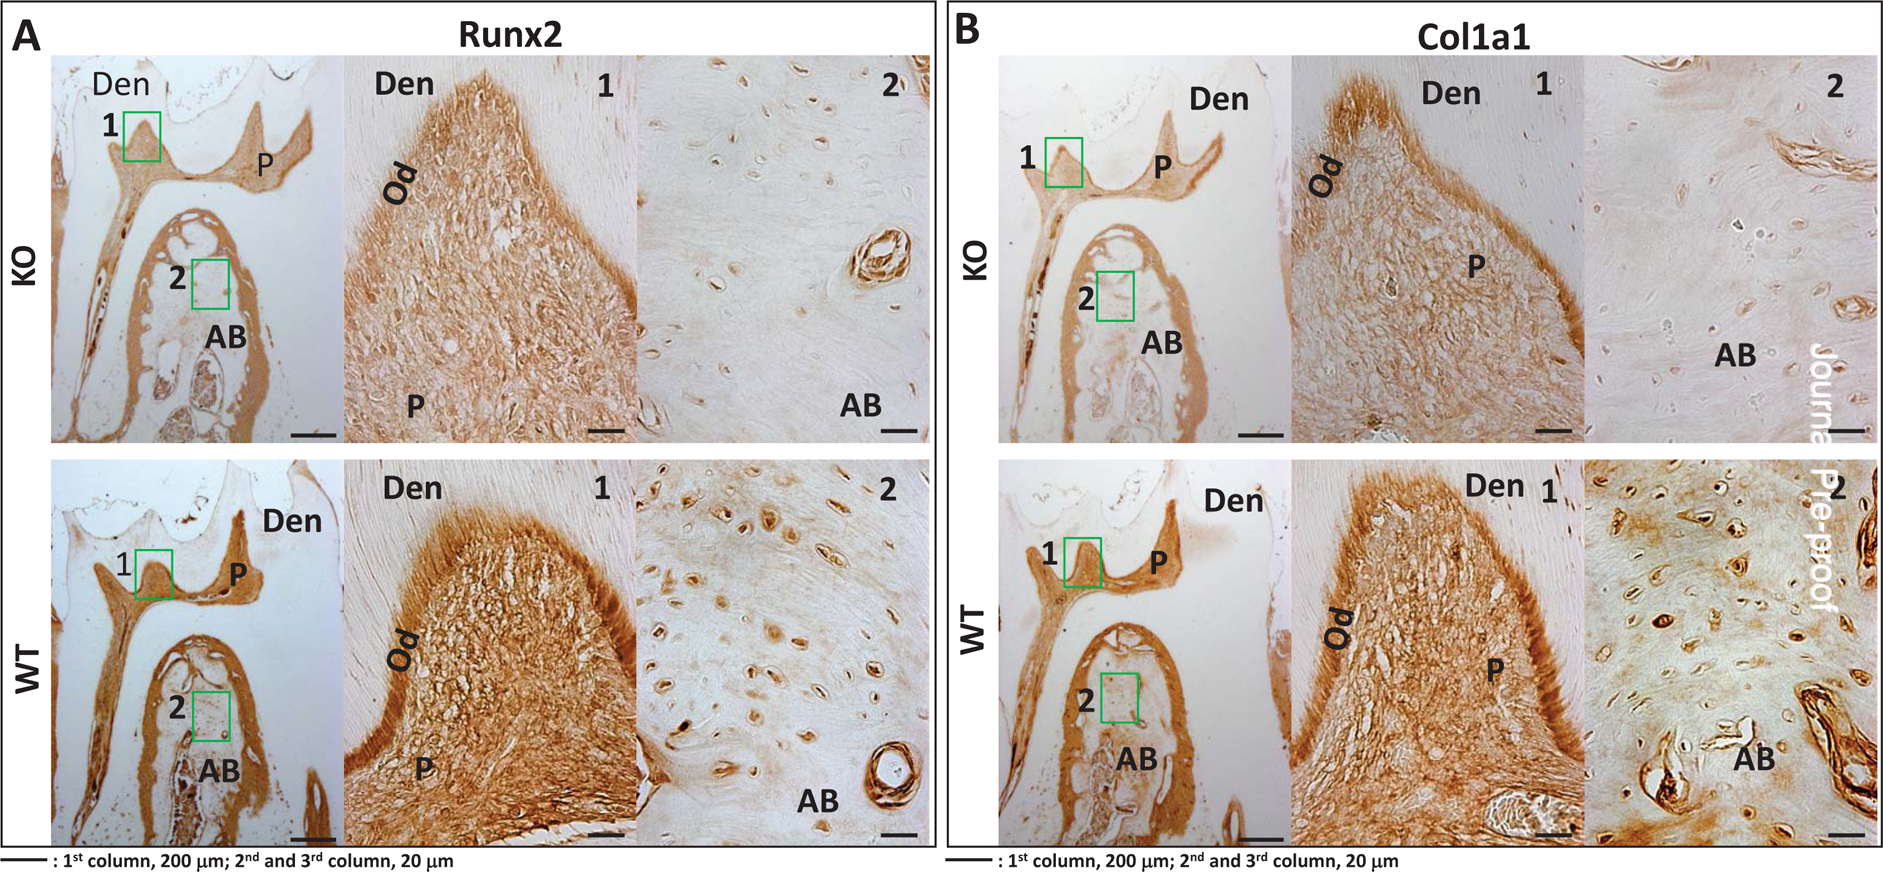

A. Expression of Runx2 in KO (upper panel) and WT (lower panel).
B. Col1A1 in KO (upper panel) and WT (lower panel).
C. Expression of OPN in KO (upper panel) and WT (lower panel)
D. Expression of DMP1 in KO (upper panel) and WT (lower panel).
E. Expression of DPP in KO (upper panel) and WT (lower panel)
F. Expression of GRP78 in KO (upper panel) and WT (lower panel) 1 and 2-boxed area in each figure has been magnified. Den=dentin; AB=alveolar bone, P=pulp; Od=odontoblasts.
G. Quantification of the immunohistochemical positive signals in odontoblasts (Od), pulp= (P), alveolar bone (AB). Statistical significance: **p<0.01.
4. Discussion
In biomineralization, calcium transport and calcium signaling are of utmost importance for proper mineralization of the ECM. During dentin formation, odontoblasts transport large quantities of Ca2+ and to avoid toxicity and apoptosis, these cells must tightly regulate Ca2+ influx and Ca2+ extrusion. Recently, SOCE has been identified as an important Ca2+ influx mechanism and functions to maintain calcium homeostasis in the cytoplasm and in the ER. This Ca2+ mobilization is also essential to refine Ca2+ signaling in eukaryotic cells. It is now recognized, that the ER calcium sensor STIM1 and the plasma membrane Ca2+ specific channel Orai proteins are the key molecular components of the store-operated Ca2+ entry [32]. During SOCE, STIM1 dimerizes upon ER Ca2+ depletion, and relocates in close proximity to the plasma membrane. Monomeric Orai1 simultaneously oligomerizes to form functional Ca2+ channels in response to the rearrangement of the ER membrane and the migration of STIM1, and relocate to the plasma membrane near the ER membrane containing STIM1 dimers. Finally, Orai1 and STIM1 form heteromeric oligomers called “puncta” [33]. During puncta formation, a highly conserved domain of STIM1 binds directly to the N and C termini of Orai1 leading to activation of Orai1 and allows entry of extracellular Ca2+ [34, 35]. The molecular choreography of STIM1-Orai1 coupling to activate SOCE is initiated by ER Ca2+ store depletion. [36]. Stimulation of STIM1 can activate SOCE leading to sustained extracellular Ca2+ influx [37]. Accumulating evidence suggests that loss of STIM1 function leads to SOCE dysregulation and may contribute to impaired ER Ca2+ signaling in several pathological conditions such as diabetes, neurodegenerative diseases and in several skeletal and tooth related disorders [23, 38–40]. Further, SOCE also participates in various cellular events that controls several cellular processes such as proliferation and differentiation.
Previously, we have demonstrated that stimulation of preosteoblasts and preodontoblasts with DMP1, results in DMP1 binding to its receptor GRP-78 (glucose regulatory protein-78) on the plasma membrane, leading to depletion of ER Ca2+ store [17]. Efflux of Ca2+ by the addition of extracellular Ca2+ results in an increase in cytosolic [Ca2+], which contributes to the activation of many Ca2+ dependent signaling molecules and transcriptional regulators. Several extracellular ligands and growth factors are known to bind to plasma-membrane resident proteins, which then transduce the signal to the cell interior, triggering the release of Ca2+ from the ER [41]. ER store Ca2+ depletion is the initial trigger for STIM1-Orai1 interaction.
In order to identify STIM1’s role in dental pulp cell differentiation and formation of calcified dentin matrix, we first focused on the localization of Orai1 and STIM1 in the odontoblasts and the dental pulp. Immunohistochemical analysis clearly demonstrate the presence of Orai1 on the cell membranes of the odontoblasts, dental pulp cells and osteocytes. This localization pattern is consistent with Orai1 being a functional component in SOCE. STIM1 on the other hand, was strongly expressed in the cytoplasm surrounding the nucleus consistent with its function in the ER. To demonstrate the oligomerization and translocation of STIM1 during SOCE, ER Ca2+ stores were depleted by the addition of DMP1. As expected, CFP-STIM1 fluorescence appeared as multiple discrete puncta close to the plasma membrane as early as 100 sec after ER Ca2+ store depletion in DPSCs. These studies confirm that STIM1 can dynamically form aggregates near the plasma membrane, an initial requirement for SOCE activation with ER Ca2+ depletion.
In order to understand the role of STIM1 in biomineralization, genetically modified DPSCs were generated in this study. Interestingly, overexpression of STIM1 led to differentiation of stem cells into an odontogenic phenotype with upregulation of transcription factors such as Runx2, Osterix; key matrix molecules like alkaline phosphatase, Col1, DMP1,GRP-78, DPP and OCN suggesting differentiation of the precursor cells. Alizarin-red staining confirmed that these cells were terminally differentiated and promoted matrix mineralization. These effects were attenuated in STIM1–silenced cells. These results strengthen the correlation between STIM1 activation and SOCE leading to changes in intracellular Ca2+ concentration to promote odontogenic differentiation of DPSCs.
The most prominent feature of STIM1 overexpression is the dense extracellular matrix containing large number of exosomes released to the matrix. FESEM images showed STIM1-OE cells had multiple cellular processes that indicate cell-matrix interactions that are necessary for cell adhesion, proliferation and commitment of the DPSCs. It is apparent that STIM1-OE cells synthesized an ECM that contains a thick collagenous matrix with mineral deposits at numerous sites. In close proximity to the mineral deposits, numerous extracellular vesicles were observed. This is not surprising as published reports show that bone synthesis is characterized by membrane vesicles that aid cellular communication, carry a cargo that consists of proteins, microRNA and other components from the parental cell [42]. In this study, STIM1 overexpressing DPSCs under differentiation conditions secrete large amounts of vesicles, which were associated with sites of initial mineral deposition. These data are consistent with a study that demonstrated increasing intracellular Ca2+, stimulates exosome secretion [43]. In the case of tumor progression and metastasis, published study show that elevated intracellular Ca2+ levels were responsible for enhanced exosome release [44].Taken together the results suggest that increase in exosome release mediated by STIM1 might be due to a Ca2+ dependent mechanism.
A characteristic feature of the ECM assembled by the STIM1-OE cells is the presence of large mineral deposits. This suggests that the nanocrystals enclosed within the vesicle might act as a “nidus” to initiate mineralization of the organic matrix in close-proximity to the vesicles. With respect to bone and dentin formation, the extracellular vesicles are capable of nucleating hydroxyapatite as intracellular ACP (amorphous calcium phosphate) -containing vesicles were observed in rapidly growing embryonic chicken long bones and embryonic mouse calvaria [45–47]. These ACP-containing vesicles were then transported to the sites of organic matrix mineralization. Mineral propagation could be facilitated by the release of crystals through the membrane of extracellular vesicles. The mineral first deposited in the extracellular preformed organic matrix is a disordered calcium phosphate mineral phase with a Ca/P ratio of around 1. The ECM of the STIM1-deficient cells show sparse mineral deposits and less cellular processes. These observations confirm that Ca2+ regulation by STIM1 play an active role in matrix mineralization.
In vitro observations for a functional role for STIM1 in calcified tissue formation were confirmed in the mandibles of the STIM1-knockout mouse. μCT analysis indicated that at 1, 2 and 3 months the first molars exhibited reduced dentin thickness, mineral density and the dentin volume fraction which was more pronounced in the crown dentin. Further, the alveolar bone was hypomineralized and exhibited decreased mineral density, trabecular number, trabecular thickness and total bone volume compared with the wild-type control. Similar results were obtained in the knockout of DSPP null mice, a matrix protein involved in calcium binding and matrix mineralization [30].
Together, these data provide evidence for a novel role for STIM1 in the synthesis of mineralized tissues such as alveolar bone and dentin. We report that sustained extracellular Ca2+ influx via STIM1 activated SOCE regulates intracellular Ca2+ homeostasis and support a complex signaling network.
5. Conclusions
Mineralization of the extracellular matrix of bone and dentin is a well-regulated process. Physiological matrix mineralization requires calcium to be transported efficiently to the ECM. STIM1 is a Ca2+ concentration sensor localized in the ER lumen and ORAI1 is the pore-forming unit. Together they function in maintaining calcium homeostasis within the cell by a physiological process known as SOCE. Collectively, our data provide new insights into the pivotal role of STIM1/ORAI1–mediated Ca2+ influx in the dental pulp stem cells, which are non-excitable cells. Influx of extracellular Ca2+ during SOCE not only refills the intracellular Ca2+ stores and maintains Ca2+ homeostasis but also perform signaling functions. Here we demonstrate that STIM1 promotes odontogenic differentiation of DPSCs and silencing STIM1 abrogates the differentiation process. Findings from this study also suggest that STIM1-mediated elevated intracellular Ca2+ influx is essential for the release of exosomes to the matrix. These extracellular vesicles carry mineral and several components of the organic matrix to form a well-organized calcified ECM. The requirement of STIM1 in dentin mineralization was further supported by the impaired dentin matrix of the STIM1 KO mice. This is the first report demonstrating a key distinct role of STIM1 during the differentiation of the dental pulp stem cells and its involvement in the formation of the dentin matrix. Accelerating Ca2+ flux through STIM1-ORAI1–mediated channel may be a promising therapeutic target for abnormal calcium metabolism and bone disorders such as osteoporosis.
Supplementary Material
Statement of significance.
Calcium signaling and transport are fundamental to bone and dentin mineralization. Osteoblasts and odontoblasts transport large amounts of Ca2+ to the extracellular matrix. These cells maintain calcium homeostasis by spatially distributed calcium pumps and channels at the plasma membrane. STIM1 an ER Ca2+ sensor protein is an important component of the store-operated calcium entry (SOCE) process. In this study, we examined the role of STIM1 during the differentiation of dental pulp stem cells into functional odontoblasts and formation of mineralized dentin matrix. Stimulation of these cells with DMP1, a key regulatory protein in matrix mineralization, stimulates STIM1-mediated release of ER Ca2+ and SOCE activation. Silencing of STIM1 impairs signaling events, release of exosomes containing matrix proteins and matrix mineralization.
Acknowledgements
This work was funded by the National Institutes of Health DE 011657 and the Brodie Endowment Fund. We thank Ms.Annette Merkel for help with live-cell imaging, Ms. Adriene Petho for help with immunofluorescence
Footnotes
Publisher's Disclaimer: This is a PDF file of an unedited manuscript that has been accepted for publication. As a service to our customers we are providing this early version of the manuscript. The manuscript will undergo copyediting, typesetting, and review of the resulting proof before it is published in its final form. Please note that during the production process errors may be discovered which could affect the content, and all legal disclaimers that apply to the journal pertain
Declaration of Competing Interest
Authors have no disclosures of competing interest in relation to this manuscript.
References
- [1].Alonso MT, Manjarres IM, Garcia-Sancho J, Privileged coupling between Ca(2+) entry through plasma membrane store-operated Ca(2+) channels and the endoplasmic reticulum Ca(2+) pump, Mol Cell Endocrinol 353(1–2) (2012) 37–44. [DOI] [PubMed] [Google Scholar]
- [2].Berridge MJ, Lipp P, Bootman MD, The versatility and universality of calcium signalling, Nat Rev Mol Cell Biol 1(1) (2000) 11–21. [DOI] [PubMed] [Google Scholar]
- [3].Bagur R, Hajnoczky G, Intracellular Ca(2+) Sensing: Its Role in Calcium Homeostasis and Signaling, Mol Cell 66(6) (2017) 780–788. [DOI] [PMC free article] [PubMed] [Google Scholar]
- [4].Li B, He X, Dong Z, Xuan K, Sun W, Gao L, Liu S, Liu W, Hu C, Zhao Y, Shi S, Jin Y, Ionomycin ameliorates hypophosphatasia via rescuing alkaline phosphatase deficiency-mediated L-type Ca(2+) channel internalization in mesenchymal stem cells, Bone Res 8 (2020) 19. [DOI] [PMC free article] [PubMed] [Google Scholar]
- [5].Almirza WH, Peters PH, van Zoelen EJ, Theuvenet AP, Role of Trpc channels, Stim1 and Orai1 in PGF(2alpha)-induced calcium signaling in NRK fibroblasts, Cell Calcium 51(1) (2012) 12–21. [DOI] [PubMed] [Google Scholar]
- [6].Zhou Y, Meraner P, Kwon HT, Machnes D, Oh-hora M, Zimmer J, Huang Y, Stura A, Rao A, Hogan PG, STIM1 gates the store-operated calcium channel ORAI1 in vitro, Nat Struct Mol Biol 17(1) (2010) 112–6. [DOI] [PMC free article] [PubMed] [Google Scholar]
- [7].Zhang SL, Yu Y, Roos J, Kozak JA, Deerinck TJ, Ellisman MH, Stauderman KA, Cahalan MD, STIM1 is a Ca2+ sensor that activates CRAC channels and migrates from the Ca2+ store to the plasma membrane, Nature 437(7060) (2005) 902–5. [DOI] [PMC free article] [PubMed] [Google Scholar]
- [8].Putney JW, Steinckwich-Besancon N, Numaga-Tomita T, Davis FM, Desai PN, D’Agostin DM, Wu S, Bird GS, The functions of store-operated calcium channels, Biochim Biophys Acta Mol Cell Res 1864(6) (2017) 900–906. [DOI] [PMC free article] [PubMed] [Google Scholar]
- [9].Moccia F, Dragoni S, Lodola F, Bonetti E, Bottino C, Guerra G, Laforenza U, Rosti V, Tanzi F, Store-dependent Ca(2+) entry in endothelial progenitor cells as a perspective tool to enhance cell-based therapy and adverse tumour vascularization, Curr Med Chem 19(34) (2012) 5802–18. [DOI] [PubMed] [Google Scholar]
- [10].Prakriya M, Store-operated Orai channels: structure and function, Curr Top Membr 71 (2013) 1–32. [DOI] [PMC free article] [PubMed] [Google Scholar]
- [11].Nwokonko RM, Cai X, Loktionova NA, Wang Y, Zhou Y, Gill DL, The STIM-Orai Pathway: Conformational Coupling Between STIM and Orai in the Activation of Store-Operated Ca(2+) Entry, Adv Exp Med Biol 993 (2017) 83–98. [DOI] [PMC free article] [PubMed] [Google Scholar]
- [12].Navarro-Borelly L, Somasundaram A, Yamashita M, Ren D, Miller RJ, Prakriya M, STIM1-Orai1 interactions and Orai1 conformational changes revealed by live-cell FRET microscopy, J Physiol (2008) 586(22) (2008) 5383–401. [DOI] [PMC free article] [PubMed] [Google Scholar]
- [13].Lunz V, Romanin C, Frischauf I, STIM1 activation of Orai1, Cell Calcium 77 (2019) 29–38. [DOI] [PMC free article] [PubMed] [Google Scholar]
- [14].Nurbaeva MK, Eckstein M, Concepcion AR, Smith CE, Srikanth S, Paine ML, Gwack Y, Hubbard MJ, Feske S, Lacruz RS, Dental enamel cells express functional SOCE channels, Sci Rep 5 (2015)15803. [DOI] [PMC free article] [PubMed] [Google Scholar]
- [15].Muik M, Fahrner M, Schindl R, Stathopulos P, Frischauf I, Derler I, Plenk P, Lackner B, Groschner K, Ikura M, Romanin C, STIM1 couples to ORAI1 via an intramolecular transition into an extended conformation, Embo J 30(9) (2011) 1678–89. [DOI] [PMC free article] [PubMed] [Google Scholar]
- [16].Marchant JS, Cellular signalling: STIMulating calcium entry, Curr Biol 15(13) (2005) R493–5. [DOI] [PubMed] [Google Scholar]
- [17].Eapen A, Sundivakkam P, Song Y, Ravindran S, Ramachandran A, Tiruppathi C, George A, Calcium-mediated stress kinase activation by DMP1 promotes osteoblast differentiation, The Journal of biological chemistry 285(47) (2010) 36339–36351. [DOI] [PMC free article] [PubMed] [Google Scholar]
- [18].Kimura M, Nishi K, Higashikawa A, Ohyama S, Sakurai K, Tazaki M, Shibukawa Y, High pH-Sensitive Store-Operated Ca(2+) Entry Mediated by Ca(2+) Release-Activated Ca(2+) Channels in Rat Odontoblasts, Frontiers in physiology (9) (2018) 443–443. [DOI] [PMC free article] [PubMed] [Google Scholar]
- [19].Shibukawa Y, Suzuki T, Ca2+ signaling mediated by IP3-dependent Ca2+ releasing and store-operated Ca2+ channels in rat odontoblasts, J Bone Miner Res 18(1) (2003) 30–38. [DOI] [PubMed] [Google Scholar]
- [20].Lacruz RS, Smith CE, Bringas P Jr., Chen Y-B, Smith SM, Snead ML, Kurtz I, Hacia JG, Hubbard MJ, Paine ML, Identification of novel candidate genes involved in mineralization of dental enamel by genome-wide transcript profiling, Journal of cellular physiology 227(5) (2012) 2264–2275. [DOI] [PMC free article] [PubMed] [Google Scholar]
- [21].Eckstein M, Vaeth M, Aulestia FJ, Costiniti V, Kassam SN, Bromage TG, Pedersen P, Issekutz T, Idaghdour Y, Moursi AM, Feske S, Lacruz RS, Differential regulation of Ca(2+) influx by ORAI channels mediates enamel mineralization, Science signaling 12(578) (2019) eaav4663. [DOI] [PMC free article] [PubMed] [Google Scholar]
- [22].Nurbaeva MK, Eckstein M, Concepcion AR, Smith CE, Srikanth S, Paine ML, Gwack Y, Hubbard MJ, Feske S, Lacruz RS, Dental enamel cells express functional SOCE channels, Scientific reports 5 (2015) 15803–15803. [DOI] [PMC free article] [PubMed] [Google Scholar]
- [23].Lacruz RS, Feske S, Diseases caused by mutations in ORAI1 and STIM1, Ann N Y Acad Sci 1356(1) (2015) 45–79. [DOI] [PMC free article] [PubMed] [Google Scholar]
- [24].Furukawa Y, Haruyama N, Nikaido M, Nakanishi M, Ryu N, Oh-Hora M, Kuremoto K, Yoshizaki K, Takano Y, Takahashi I, Stim1 Regulates Enamel Mineralization and Ameloblast Modulation, J Dent Res 96(12) (2017) 1422–1429. [DOI] [PubMed] [Google Scholar]
- [25].Ramachandran A, Ravindran S, George A, Localization of transforming growth factor beta receptor II interacting protein-1 in bone and teeth: implications in matrix mineralization, J Histochem Cytochem 60(4) (2012) 323–337. [DOI] [PMC free article] [PubMed] [Google Scholar]
- [26].Hao J, Narayanan K, Ramachandran A, He G, Almushayt A, Evans C, George A, Odontoblast cells immortalized by telomerase produce mineralized dentin-like tissue both in vitro and in vivo, J Biol Chem 277(22) (2002) 19976–81. [DOI] [PubMed] [Google Scholar]
- [27].Srinivasan R, Chen B, Gorski JP, George A, Recombinant expression and characterization of dentin matrix protein 1, Connect Tissue Res 40(4) (1999) 251–8. [DOI] [PubMed] [Google Scholar]
- [28].Chen Y, Ramachandran A, Zhang Y, Koshy R, George A, The ER Ca(2+) sensor STIM1 can activate osteoblast and odontoblast differentiation in mineralized tissues, Connect Tissue Res 59(sup1) (2018) 6–12. [DOI] [PMC free article] [PubMed] [Google Scholar]
- [29].Ramachandran A, Ravindran S, Huang C-C, George A, TGF beta receptor II interacting protein-1, an intracellular protein has an extracellular role as a modulator of matrix mineralization, Scientific reports 6 (2016) 37885–37885. [DOI] [PMC free article] [PubMed] [Google Scholar]
- [30].Chen Y, Zhang Y, Ramachandran A, George A, DSPP Is Essential for Normal Development of the Dental-Craniofacial Complex, J Dent Res 95(3) (2016) 302–310. [DOI] [PMC free article] [PubMed] [Google Scholar]
- [31].Bouxsein ML, Boyd SK, Christiansen BA, Guldberg RE, Jepsen KJ, Müller R, Guidelines for assessment of bone microstructure in rodents using micro-computed tomography, Journal of bone and mineral research : the official journal of the American Society for Bone and Mineral Research 25(7) (2010) 1468–86. [DOI] [PubMed] [Google Scholar]
- [32].Sundivakkam PC, Natarajan V, Malik AB, Tiruppathi C, Store-operated Ca2+ entry (SOCE) induced by protease-activated receptor-1 mediates STIM1 protein phosphorylation to inhibit SOCE in endothelial cells through AMP-activated protein kinase and p38beta mitogen-activated protein kinase, J Biol Chem 288(23) (2013) 17030–41. [DOI] [PMC free article] [PubMed] [Google Scholar]
- [33].Yazbeck P, Tauseef M, Kruse K, Amin M-R, Sheikh R, Feske S, Komarova Y, Mehta D, STIM1 Phosphorylation at Y361 Recruits Orai1 to STIM1 Puncta and Induces Ca(2+) Entry, Scientific reports 7 (2017) 42758–42758. [DOI] [PMC free article] [PubMed] [Google Scholar]
- [34].Zhou Y, Srinivasan P, Razavi S, Seymour S, Meraner P, Gudlur A, Stathopulos PB, Ikura M, Rao A, Hogan PG, Initial activation of STIM1, the regulator of store-operated calcium entry, Nat Struct Mol Biol 20(8) (2013) 973–81. [DOI] [PMC free article] [PubMed] [Google Scholar]
- [35].Zhu J, Feng Q, Stathopulos PB, The STIM-Orai Pathway: STIM-Orai Structures: Isolated and in Complex, Adv Exp Med Biol 993 (2017) 15–38. [DOI] [PubMed] [Google Scholar]
- [36].Ma G, Wei M, He L, Liu C, Wu B, Zhang SL, Jing J, Liang X, Senes A, Tan P, Li S, Sun A, Bi Y, Zhong L, Si H, Shen Y, Li M, Lee M-S, Zhou W, Wang J, Wang Y, Zhou Y, Inside-out Ca(2+) signalling prompted by STIM1 conformational switch, Nature communications 6 (2015) 7826–7826. [DOI] [PMC free article] [PubMed] [Google Scholar]
- [37].Liou J, Kim ML, Heo WD, Jones JT, Myers JW, Ferrell JE Jr., Meyer T, STIM is a Ca2+ sensor essential for Ca2+-store-depletion-triggered Ca2+ influx, Curr Biol 15(13) (2005) 1235–41. [DOI] [PMC free article] [PubMed] [Google Scholar]
- [38].Michelucci A, García-Castañeda M, Boncompagni S, Dirksen RT, Role of STIM1/ORAI1-mediated store-operated Ca(2+) entry in skeletal muscle physiology and disease, Cell calcium 76 (2018) 101–115. [DOI] [PMC free article] [PubMed] [Google Scholar]
- [39].Kono T, Tong X, Taleb S, Bone RN, Iida H, Lee C-C, Sohn P, Gilon P, Roe MW, Evans-Molina C, Impaired Store-Operated Calcium Entry and STIM1 Loss Lead to Reduced Insulin Secretion and Increased Endoplasmic Reticulum Stress in the Diabetic β-Cell, Diabetes 67(11) (2018) 2293–2304. [DOI] [PMC free article] [PubMed] [Google Scholar]
- [40].Hardingham GE, Bading H, Calcium as a versatile second messenger in the control of gene expression, Microsc Res Tech 46(6) (1999) 348–355. [DOI] [PubMed] [Google Scholar]
- [41].Fahrner M, Stadlbauer M, Muik M, Rathner P, Stathopulos P, Ikura M, Muller N, Romanin C, A dual mechanism promotes switching of the Stormorken STIM1 R304W mutant into the activated state, Nat Commun 9(1) (2018) 825. [DOI] [PMC free article] [PubMed] [Google Scholar]
- [42].van Niel G, D’Angelo G, Raposo G, Shedding light on the cell biology of extracellular vesicles, Nature reviews. Molecular cell biology 19(4) (2018) 213–228. [DOI] [PubMed] [Google Scholar]
- [43].Savina A, Furlan M, Vidal M, Colombo MI, Exosome release is regulated by a calcium-dependent mechanism in K562 cells, J Biol Chem 278(22) (2003) 20083–90. [DOI] [PubMed] [Google Scholar]
- [44].Messenger SW, Woo SS, Sun Z, Martin TFJ, A Ca(2+)-stimulated exosome release pathway in cancer cells is regulated by Munc13–4, J Cell Biol 217(8) (2018) 2877–2890. [DOI] [PMC free article] [PubMed] [Google Scholar]
- [45].Kerschnitzki M, Akiva A, Shoham AB, Koifman N, Shimoni E, Rechav K, Arraf AA, Schultheiss TM, Talmon Y, Zelzer E, Weiner S, Addadi L, Transport of membrane-bound mineral particles in blood vessels during chicken embryonic bone development, Bone 83 (2016) 65–72. [DOI] [PubMed] [Google Scholar]
- [46].Akiva A, Malkinson G, Masic A, Kerschnitzki M, Bennet M, Fratzl P, Addadi L, Weiner S, Yaniv K, On the pathway of mineral deposition in larval zebrafish caudal fin bone, Bone 75 (2015) 192–200. [DOI] [PubMed] [Google Scholar]
- [47].Kerschnitzki M, Akiva A, Ben Shoham A, Asscher Y, Wagermaier W, Fratzl P, Addadi L, Weiner S, Bone mineralization pathways during the rapid growth of embryonic chicken long bones, J Struct Biol 195(1) (2016) 82–92. [DOI] [PubMed] [Google Scholar]
Associated Data
This section collects any data citations, data availability statements, or supplementary materials included in this article.


