

Abstract
According to the latest Braak staging of Alzheimer’s disease (AD), tau pathology occurs earliest in the brain in the locus coeruleus (LC) of the brainstem, then propagates to the transentorhinal cortex (TEC), and later to other neocortical regions. Recent animal and in vivo human brain imaging research also support the trans-axonal propagation of tau pathology. In addition, neurochemical studies link norepinephrine to behavioral symptoms in AD. It is thus critical to examine the integrity of the LC-TEC pathway in studying the early development of the disease, but there has been limited work in this direction. By leveraging the high-resolution and multi-shell diffusion MRI data from the Human Connectome Project (HCP), in this work we develop a novel method for the reconstruction of the LC-TEC pathway in a cohort of 40 HCP subjects carefully selected based on rigorous quality control of the residual distortion artifacts in the brainstem. A probabilistic atlas of the LC-TEC pathway of both hemispheres is then developed in the MNI152 space and distributed publicly on the NITRC website. To apply our atlas on clinical imaging data, we develop an automated approach to calculate the medial core of the LC-TEC pathway for localized analysis of connectivity changes. In a cohort of 138 subjects from the Alzheimer’s Disease Neuroimaging Initiative (ADNI), we demonstrate the detection of the decreased fiber integrity in the LC-TEC pathways with increasing disease severity.
1. Introduction
The original Braak staging (Braak and Braak, 1995) indicates that the transentorhinal cortex (TEC) is the earliest site of tau pathology of Alzheimer’s disease (AD) and resulting brain atrophy. Increasing evidence from recent large-scale pathology studies (Braak and Del Tredici, 2015; Braak and K., 2015; Braak et al., 2011; Theofilas et al., 2017), however, suggest that the earliest tau pathology may occur at the locus coeruleus (LC) nuclei in the brainstem. The revised Braak staging of AD pathology proposes that tau pathology responsible for the pathogenesis of AD occurs first in the LC and propagates from there to the TEC and other brain regions (Braak et al., 2011). Evidence from recent animal (de Calignon et al., 2012; Ghosh et al., 2019; Liu et al., 2012) and human brain imaging studies (Cope et al., 2018; Franzmeier et al., 2019; Hoenig et al., 2018; Jacobs et al., 2018a; Jones et al., 2017) also support the hypothesis of cell-to-cell propagation of tau pathology along axonal pathways (Braak and Del Tredici, 2011). Given these emerging findings, it would be valuable to map the fiber pathways from the LC nuclei to the TEC in order to evaluate the potentially earliest changes in brain connectivity due to tau pathology in AD. By leveraging the cutting-edge brain imaging data from the Human Connectome Project (HCP) (Van Essen et al., 2013), we develop and publicly distribute a novel atlas of LC pathway to the TEC in this work. We also demonstrate the application of this novel atlas on clinical imaging data from the Alzheimer’s Disease Neuroimaging Initiative (ADNI Mueller et al., 2005).
The LC is located beneath the 4th ventricle in the dorsal portion of the rostral pons in the brainstem (Fig. 1) and has around 22,000 to 51,000 total pigmented neurons in adult humans (Mouton et al., 1994). As the principal site for the synthesis of norepinephrine, the LC plays a critical role in the regulation of arousal and the sleep-wake cycle, attention and memory, behavior and stress, cognitive control, emotions and neuroplasticity (Benarroch, 2009; Cirelli et al., 1996; Hammerer et al., 2018; Hansen, 2017; Joshi et al., 2016; Lee et al., 2018; Mather et al., 2015; Mather and Harley, 2016; Mouton et al., 1994; Takeuchi et al., 2016; Usher et al., 1999). Human neuropathological and neurochemical studies have also linked degeneration of the LC to neuropsychiatric symptoms in AD (Jacobs et al., 2019; Matthews et al., 2002). For the in vivo imaging of the LC, neuromelanin-sensitive MRI protocols were developed (Keren et al., 2009; Priovoulos et al., 2018; Sasaki et al., 2006) and validated with histology (Keren et al., 2015). These MRI protocols have been applied successfully in various studies to quantify the morphometry and signal intensity changes due to aging (Betts et al., 2017; Clewett et al., 2015; Dahl et al., 2019; Liu et al., 2019) and AD (Betts et al., 2019; Olivieri et al., 2019; Takahashi et al., 2015). In addition, resting state fMRI (rsfMRI) was applied recently to examine the functional connectivity of LC (Jacobs et al., 2018b; Zhang et al., 2015). There is, however, very limited research on the structural connectivity of the LC to the neocortex. Considering the potentially critical role of the LC in the early onset and cell-to-cell propagation of tau pathology in AD (Braak and Del Tredici, 2011), there is a great need of mapping the LC pathways and examine their changes during the development of AD.
Fig. 1.
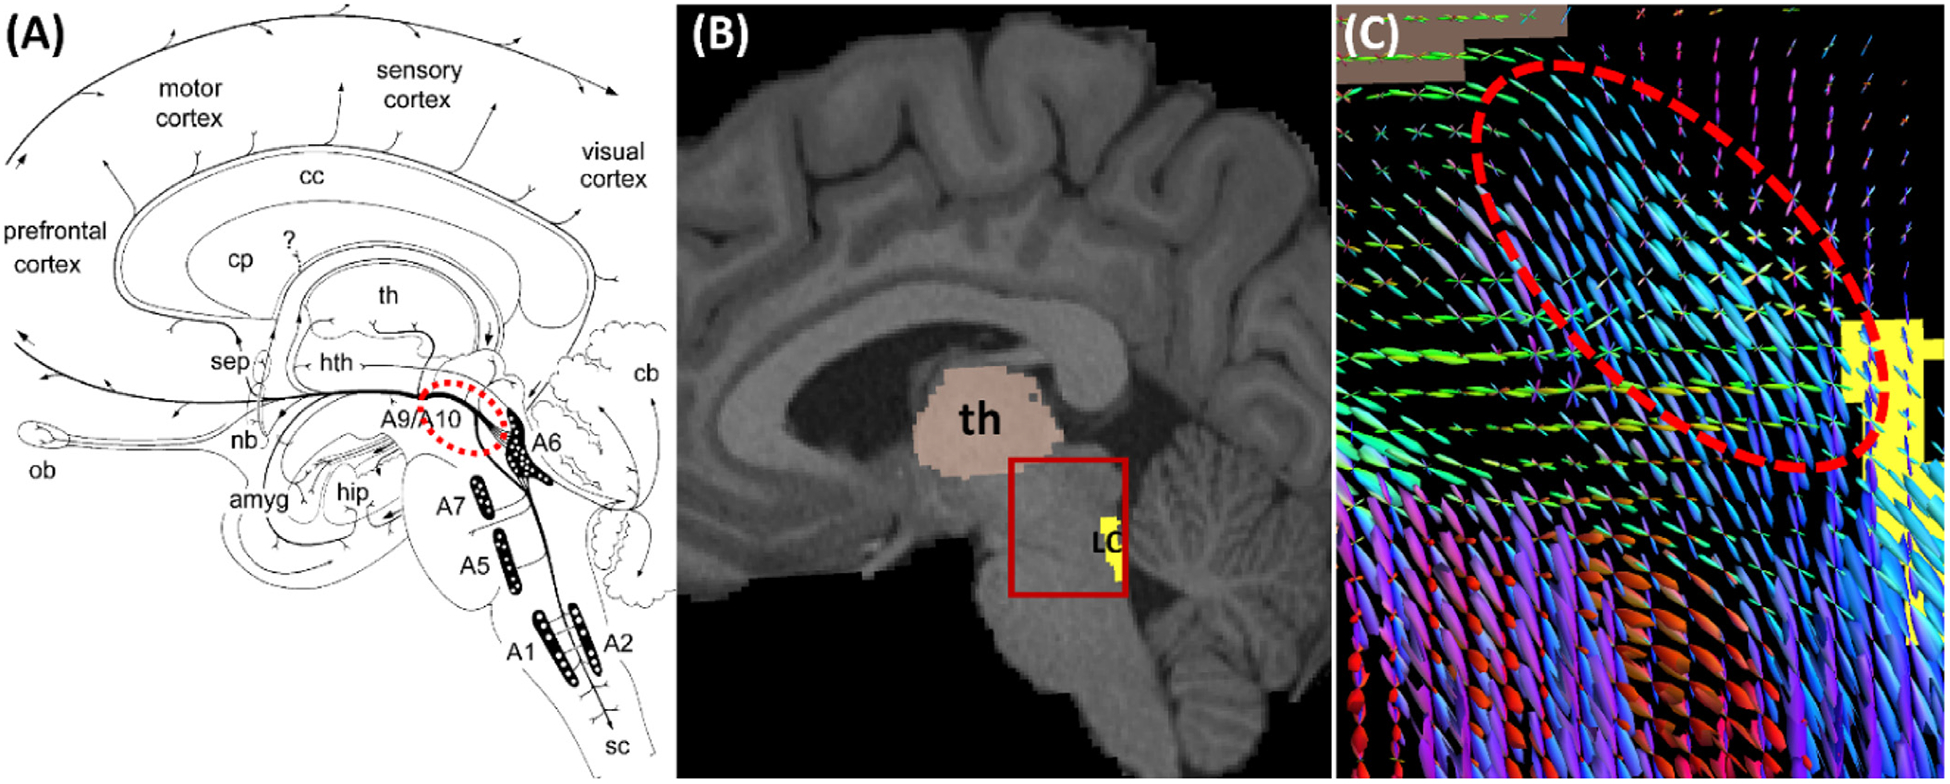
An illustration of LC pathways as represented by connectome imaging data. (A) Anatomy of the LC (see A6 in the diagram) projection to cortex via the dorsal noradrenergic ascending bundle (dashed red ellipse) that branch off to the amygdala and hippocampus (Marien et al., 2004) (reprinted with permission from Elsevier). Abbreviations: amyg – amygdala; cb – cerebellum; cc – corpus callosum; cp – caudate and putamen; hip – hippocampus; hth – hypothalamus; nb – nucleus basalis; ob – olfactory bulb; sep – septum; sc – spinal cord; th – thalamus; (A1, A5, A7) – lateral tegmental noradrenergic cell groups, A2 - medullary noradrenergic cell groups; A6 – locus coeruleus. (B) The LC ROI on a sagittal slice of the T1-weighted MRI of an HCP subject. For the ROI highlighted by the red box, the fiber orientation distributions (FODs) were plotted in (C), which show the dorsal noradrenergic ascending bundle is well represented by the FODs.
In this work, we develop a novel tractography approach to build a probabilistic atlas of the LC pathway to the transentorhinal cortex (TEC). The TEC has been identified as the earliest cortical region with tau pathology, i.e., Braak stage one (Braak and Braak, 1991). By mapping the LC-TEC pathway, we can examine the connectivity changes in the early development of AD and provide complementary tools to existing LC imaging methods. This is enabled by the significant advances in connectome imaging techniques provided by the Human Connectome Project (HCP), which provides high resolution, multi-shell diffusion MRI at the isotropic resolution of 1.25 mm. In the current study, we leverage the high-quality imaging data of 40 HCP subjects and advanced connectome modeling techniques (Tang et al., 2018; Tran and Shi, 2015) to develop a robust tractography protocol for the LC-TEC pathway on both hemispheres. We then compute probabilistic atlases of the LC-TEC pathways in the MNI152 space and distribute them publicly. Finally, we employ our atlas to detect localized connectivity changes along the LC-TEC pathways in ADNI clinical imaging data.
2. Materials and methods
2.1. HCP data for LC atlas construction
We used the T1-weighted 3D structural MRI and multi-shell diffusion MRI (dMRI) data from the 500-Subject release of HCP in this work. The HCP data was acquired on a specialized Siemens 3T Skyra scanner with a customized protocol (Sotiropoulos et al., 2013). The T1-weighted MRI and dMRI data have isotropic spatial resolutions of 0.7 mm and 1.25 mm, respectively. For dMRI, over 270 gradient directions spreading over three b-values (1000, 2000, 3000 s/mm2) were employed to collect the multi-shell dMRI data. While the HCP protocol acquires dMRI data from two phase encodings for the correction of susceptibility distortion (Glasser et al., 2013), residual distortions are still widely present around the brainstem that affect the investigation of brainstem connectivity (Tang et al., 2018). We screened 488 subjects with complete T1 and dMRI data from the 500-Subject release (289 females, 199 males; age = 29.15 ± 3.47 (mean ± SD) years) and chose 40 subjects (20 males; 20 females) with high quality dMRI data with minimal residual susceptibility distortion for atlas construction. The detailed demographics of the selected subjects can be found in the supplemental material.
2.2. LC-TEC bundle reconstruction
Using the multi-shell dMR data, we first reconstructed the fiber orientation distribution (FOD) models based on a novel multi-compartment model (Tran and Shi, 2015). For HCP data, this method can compute highly sharp FOD models that have been successfully applied to reconstruct challenging brain pathways such as the retinofugal visual pathway (Kammen et al., 2016) and 23 major brainstem bundles (Tang et al., 2018). In this project, we will use FOD-based probabilistic tractography techniques (Tournier et al., 2012) to compute the fiber bundle connecting the LC to TEC.
2.2.1. ROIs
To reconstruct the LC to TEC pathway, we developed an ROI-based protocol to guide the tractography algorithm. In general, the ROIs were obtained by expert delineation, atlas registration, or automated segmentation. Since the LC-TEC bundle connects the LC to the TEC region, we first defined the TEC and LC ROIs in our protocol. Because the TEC is naturally defined on the cerebral cortex, we manually delineated the ROI boundary on the cortical surface reconstructed by FreeSurfer (Fischl, 2012). To better visualize and delineate the TEC ROI on the highly folded cortical surface (Fig. 2 (A)), we first applied a Laplacian smoothing (Taubin, 1995) to generate a slightly smoothed surface and then an anatomist (Y Tang) drew a contour to define the TEC ROI on the triangular mesh (Fig. 2 (B)) according to previous work on the anatomy of the TEC area (Ding and Van Hoesen, 2010). We used the curve drawing tool in the BrainSuite software for the delineation (Shattuck and Leahy, 2002). The indices of the vertices enclosed by the contour was automatically identified (blue region in Fig. 2 (B)) and transferred back to the original cortex. The fast matching algorithm (Sethian, 1996) was then applied to extend the label from the cortex to a narrow band of voxels around the TEC (cyan region in Fig. 2 (C)), which was the final TEC ROI on the image volume for fiber tractography. To generate the LC ROI on the image volume, we warped a publicly available LC nuclei atlas in the MNI152 space (Keren et al., 2009) to the T1-weighted MRI of each subject. We used the nonlinear registration tools in the ANTS software (Avants et al., 2008) to warp the LC atlas from the MNI 152 space to individual subjects (Fig. 2 (D) and (E)). In addition to these two critical ROIs, we defined one include-ROI by dilating the thalamus region with a 10-voxel kernel (Fig. 2 (F)), which was used to ensure the proximity of the fiber pathway to the thalamus. To avoid spurious fiber tracts that do not belong to the LC-TEC bundle, we used an exclude-ROI around the ventral tegmental area (VTA) region in the midbrain. To generate the exclude-ROIs of the 40 HCP subjects, we first manually delineated a VTA mask on one HCP subject (Fig. 2 (G)) and then nonlinearly warped it to all other subjects. If there was a need of further outlier removal for the generation of a clean reconstruction of the fiber bundle, we applied a tract filtering algorithm (Wang et al., 2018) that we developed recently based on topographic regularity, which is publicly available (https://www.nitrc.org/projects/connectopytool).
Fig. 2.
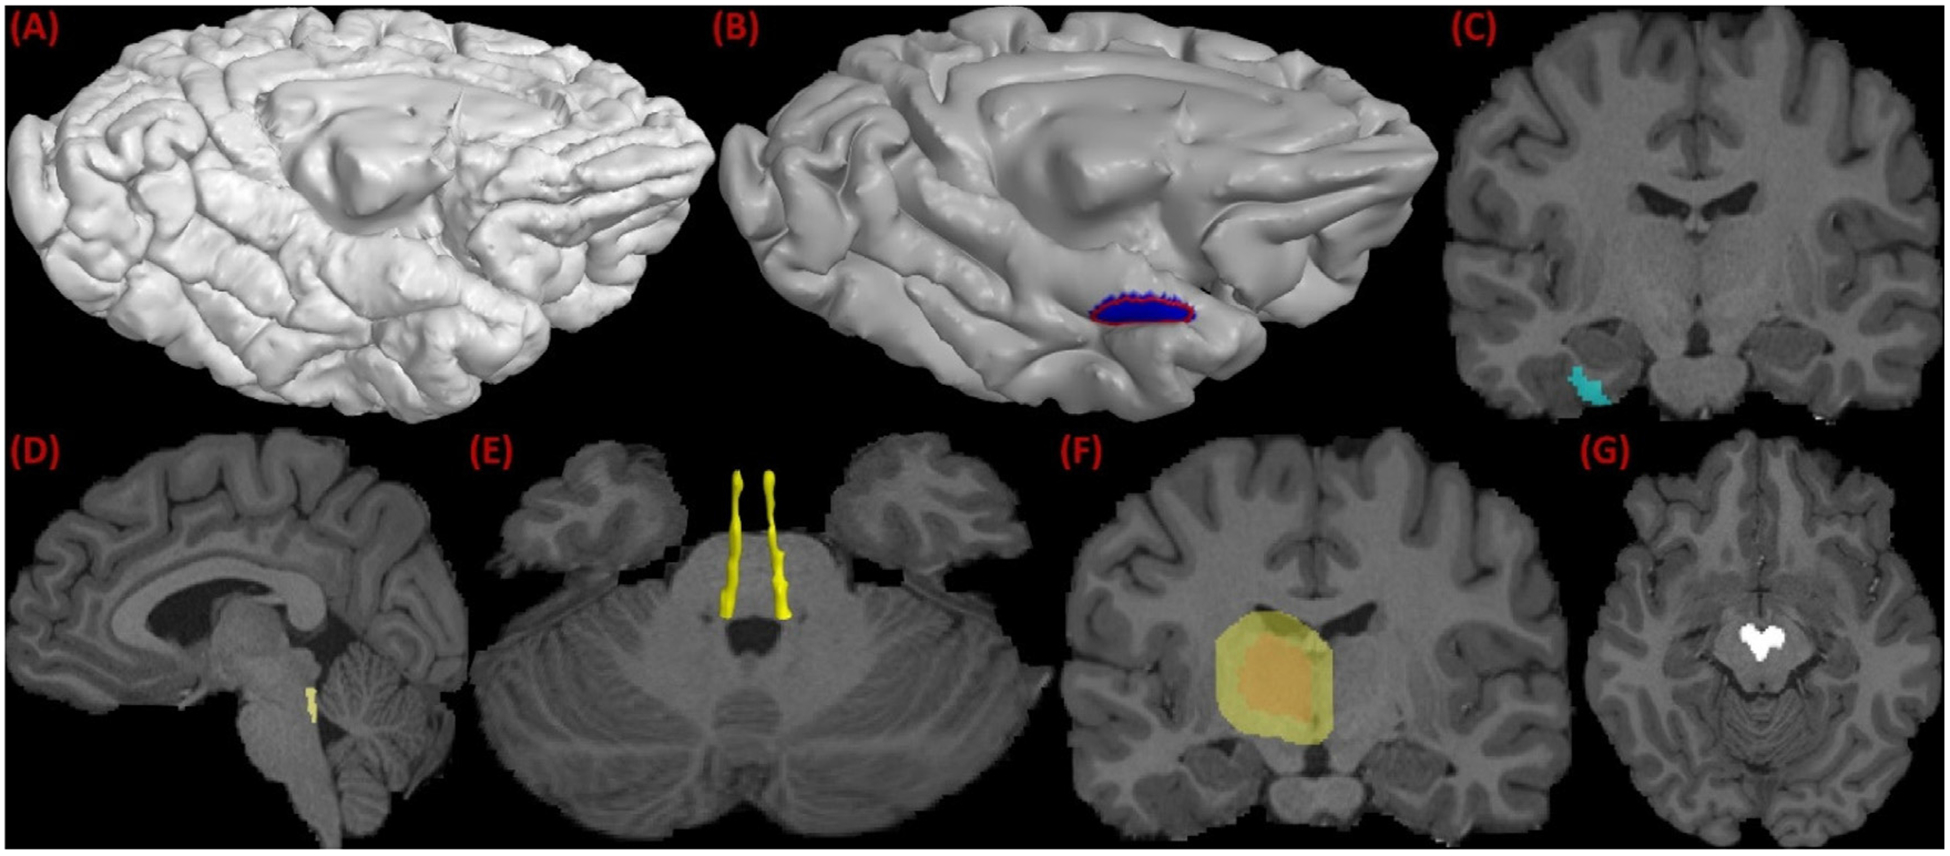
ROIs used in LC pathway reconstruction using FOD-based tractography. (A) The pial cortical surface reconstructed by FreeSurfer. (B) The TEC boundary (red) delineated on the smoothed pial surface and its enclosed ROI on surface (blue). (C) The extension of the surface ROI to volumetric ROI (cyan) of the TEC. (D) The LC ROI obtained from nonlinear registration. (E) 3D rending of the LC ROIs on both hemispheres. (F) the expanded thalamic ROI. (G) Midbrain mask used as an exclusion ROI in tractography.
2.2.2. Two-stage seeding
To successfully reconstruct the long and curved trajectory of the LC-TEC pathway, we adopted a two-stage seeding approach for FOD-based probabilistic tractography in MRTrix (Tournier et al., 2012). The main tractography parameters used in our experiments are as follows: step_size = 0.125mm; FOD threshold = 0.025; angle threshold = 9°. For both stages, the thalamic and VTA ROIs were used as the include- and exclude-ROIs, respectively. In the first stage, we used the LC ROI as the seed ROI and the amygdala region segmented by FreeSurfer as the target ROI. This process reconstructed the LC bundle to the amygdala before it makes the sharp turn toward the TEC. The fiber bundle reconstructed from the first stage was then converted into a mask and used as the seed region in the second stage. Both the TEC and LC were used as the include-ROIs in the second stage. All tracts were truncated before they left the TEC or LC ROIs.
The proposed LC-TEC reconstruction method is robust to both the inclusion/exclusion ROIs and the seeding ROI. As shown in Fig. 3, the reconstructed fiber pathways agree very well even after the dilation of the all ROIs by a spherical kernel with a radius of 2mm. By applying this ROI-based and two-stage seeding strategy to all 40 HCP subjects used in this study, we will reconstruct their corresponding fiber bundles for the construction of a probabilistic atlas of LC-TEC pathways.
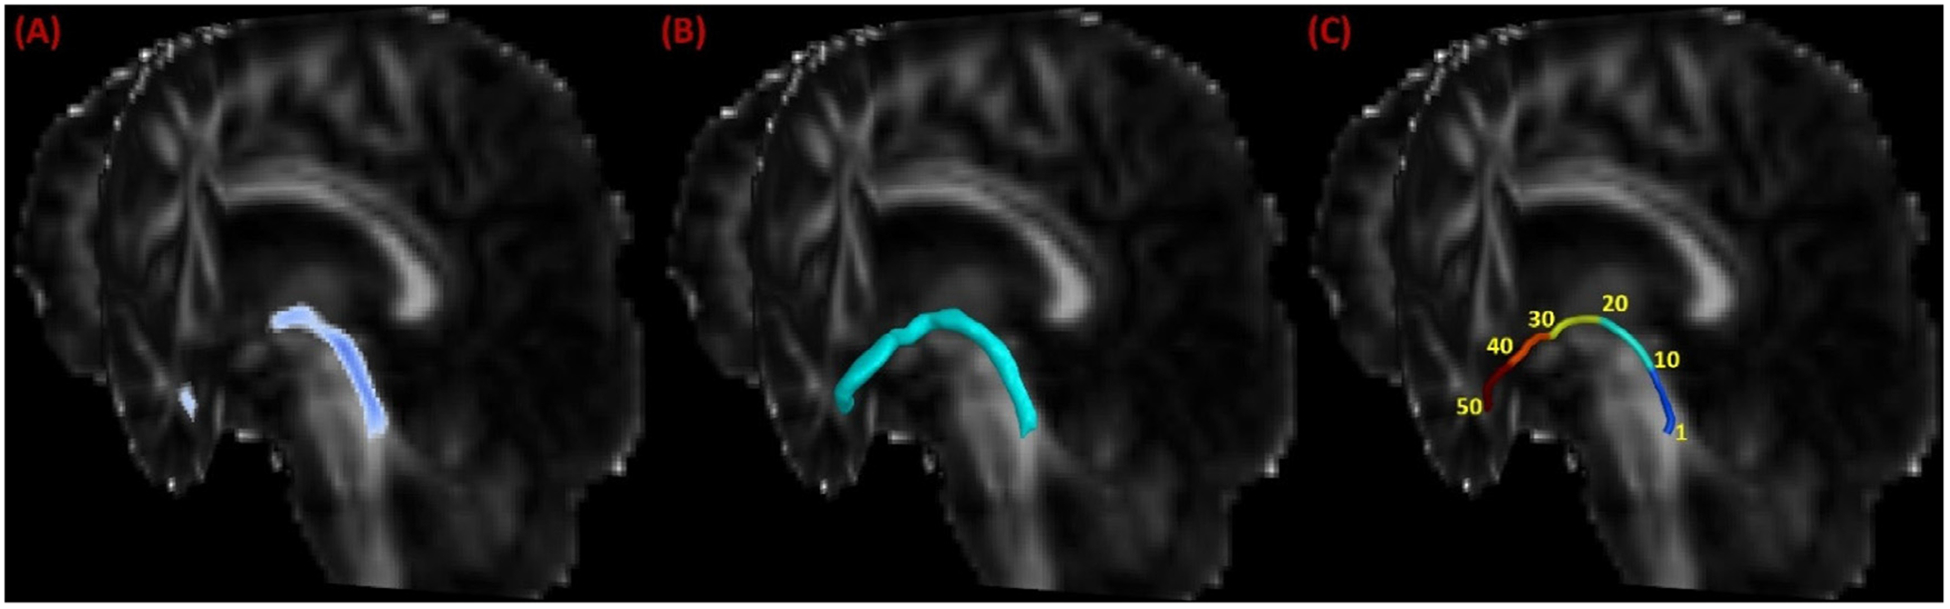
Fig. 3.
Robustness of the fiber bundle reconstruction method with respect to the ROIs. We dilated all the ROIs (inclusion/exclusion and seeding ROIs) by a spherical kernel with a 2mm radius. The original (yellow) and dilated (red) LC ROI is plotted on a sagittal slice in (A). The reconstructed LC-TEC pathway before (purple) and after (cyan) the dilation of the ROIs were overlaid and plotted in (B), which shows the consistent trajectories of the two bundles.
2.3. Probabilistic atlas construction
For atlas construction, various methods were developed in the literature. For example, one popular approach is to use unbiased registration (Joshi et al., 2004) of all subjects under consideration. In this work, we will construct the LC-TEC atlas in the MNI152 space because it is one of the most widely used atlases in neuroimaging research. By distributing the LC-TEC atlas in the MNI152 space, it will be easier for brain imaging researchers to integrate the LC-TEC atlas with other published atlases of gray and whiter matter structures in the same MNI152 space.
T1-weighted MRI of each HCP subject was normalized to the MNI152 space using nonrigid registration provide by the ANTS software (Avants et al., 2008). For each LC-TEC bundle, we computed its tract density image (TDI) (Calamante et al., 2010) and normalized it with the highest density, which produced a TDI with values between 0 and 1. This was applied to both the left and right LC-TEC bundle of each subject. Because we use preprocessed data from the HCP, the diffusion MRI data has been aligned and resampled in the space of the T1-weighted MRI. A nonlinear warp between the T1-weighted MRI of each subject to the MNI152 space was computed using the ANTS software, which was then applied to the normalized TDI of each bundle to warp it to the MNI152 atlas space. For the LC-TEC bundle of each hemisphere, the warped TDIs of all subjects were added up and then divided by the number of subjects to construct the probabilistic atlas in the MNI152 space.
2.4. Application to AD imaging data
To demonstrate the application of our LC-TEC atlas to human in vivo AD imaging, we developed an automated workflow for LC-TEC connectivity analysis based on ADNI2 data. In our experiments, we downloaded a dataset of 138 subjects of the ADNI2 study from LONI IDA (https://ida.loni.usc.edu). The ADNI was launched in 2003 as a publicprivate partnership, led by Principal Investigator Michael W. Weiner, MD. The primary goal of ADNI has been to test whether serial magnetic resonance imaging (MRI), positron emission tomography (PET), other biological markers, and clinical and neuropsychological assessment can be combined to measure the progression of mild cognitive impairment (MCI) and early Alzheimer’s disease (AD). The diffusion MRI data of ADNI2 was acquired with the same protocol on 3T GE MRI scanners from 41 gradient directions with resolution 1.36 × 1.36 × 2.7 mm3. In order to focus on AD-related changes in the LC-TEC pathway, we first screened the amyloid status (amyloid positive (A+) and amyloid negative (A−)) of each subject provided by ADNI and only subjects with the date of their amyloid PET scan within one year of their MRI scan were preserved. Furthermore, the group of cognitively normal (CN) subjects (n = 16) with positive amyloid status (CN(A+)) were excluded from the current study due to their limited sample size and different sex distributions (4 males; 12 females) from the other groups listed in Table 1. This allows us to generate four groups of subjects using both their cognitive and amyloid status as listed in Table 1, which include: cognitively normal and amyloid negative (CN(A−)), early mild cognitive impairment and amyloid positive (EMCI (A+)), late mild cognitive impairment and amyloid positive (LMCI (A+)), and clinical diagnosis of Alzheimer’s disease and amyloid positive (AD (A+)). The CN(A−) group represents normal controls without AD pathology, and the other three groups represent AD patients with increasing disease severity. These four groups have comparable age and sex distributions. For each subject, the T1-weighted structural MRI and single-shell dMRI data was downloaded and preprocessed for analysis. For the T1-weighted MRI, we performed automated skull stripping based on FreeSurfer. For the dMRI data, we applied eddy-current correction using the eddy_correct command from FSL(Jenkinson et al., 2012). The gradient table was corrected accordingly using the linear transform generated by eddy_correct (Jones and Cercignani, 2010). In addition, the dMRI data was skull stripped and resampled to isotropic resolution of 2 mm3 with tools from the FSL. Fractional anisotropy (FA) and radial diffusivity (RD) were then computed from the corrected dMRI data. To deform the LC-TEC atlas to the dMRI data of each subject, we concatenated two nonlinear deformations. The first deformation was obtained by registering the skull-stripped T1-weighted MRI to the MNI152 space. The second deformation was computed from the B0 image of the dMRI data to the T1-weighted MRI of the same subject. Both deformations were calculated using the nonlinear registration from ANTS, but with different parameters. The multi-scale iteration number used in ANTS for the first and second deformation are 100 × 50 × 25 and 20 × 10 × 10, respectively. By combining these two deformations, we warped the probabilistic LC-TEC atlas to the dMRI data of each ADNI2 subject. For all subjects, the registration quality was visually inspected by overlaying the warped atlas and the FA images to ensure the alignment of the fiber bundle atlas with the white matter structures along the pathway. An overlay of the deformed LC atlas over the FA image of an ADNI2 subject is shown in Fig. 4 (A).
Table 1.
Demographic information of ADNI2 subjects used in our study.
| Groups | CN(A−) | EMCI(A+) | LMCI(A+) | AD(A+) |
|---|---|---|---|---|
| Num of Subjects (N) | 35 | 32 | 30 | 41 |
| Age (mean± std years) | 73 ± 6.43 | 75.54 ± 8.21 | 73.25 ± 5.63 | 73.83 ± 8.58 |
| Sex (Male/Female) | 20/15 | 19/13 | 18/12 | 24/17 |
Fig. 4.
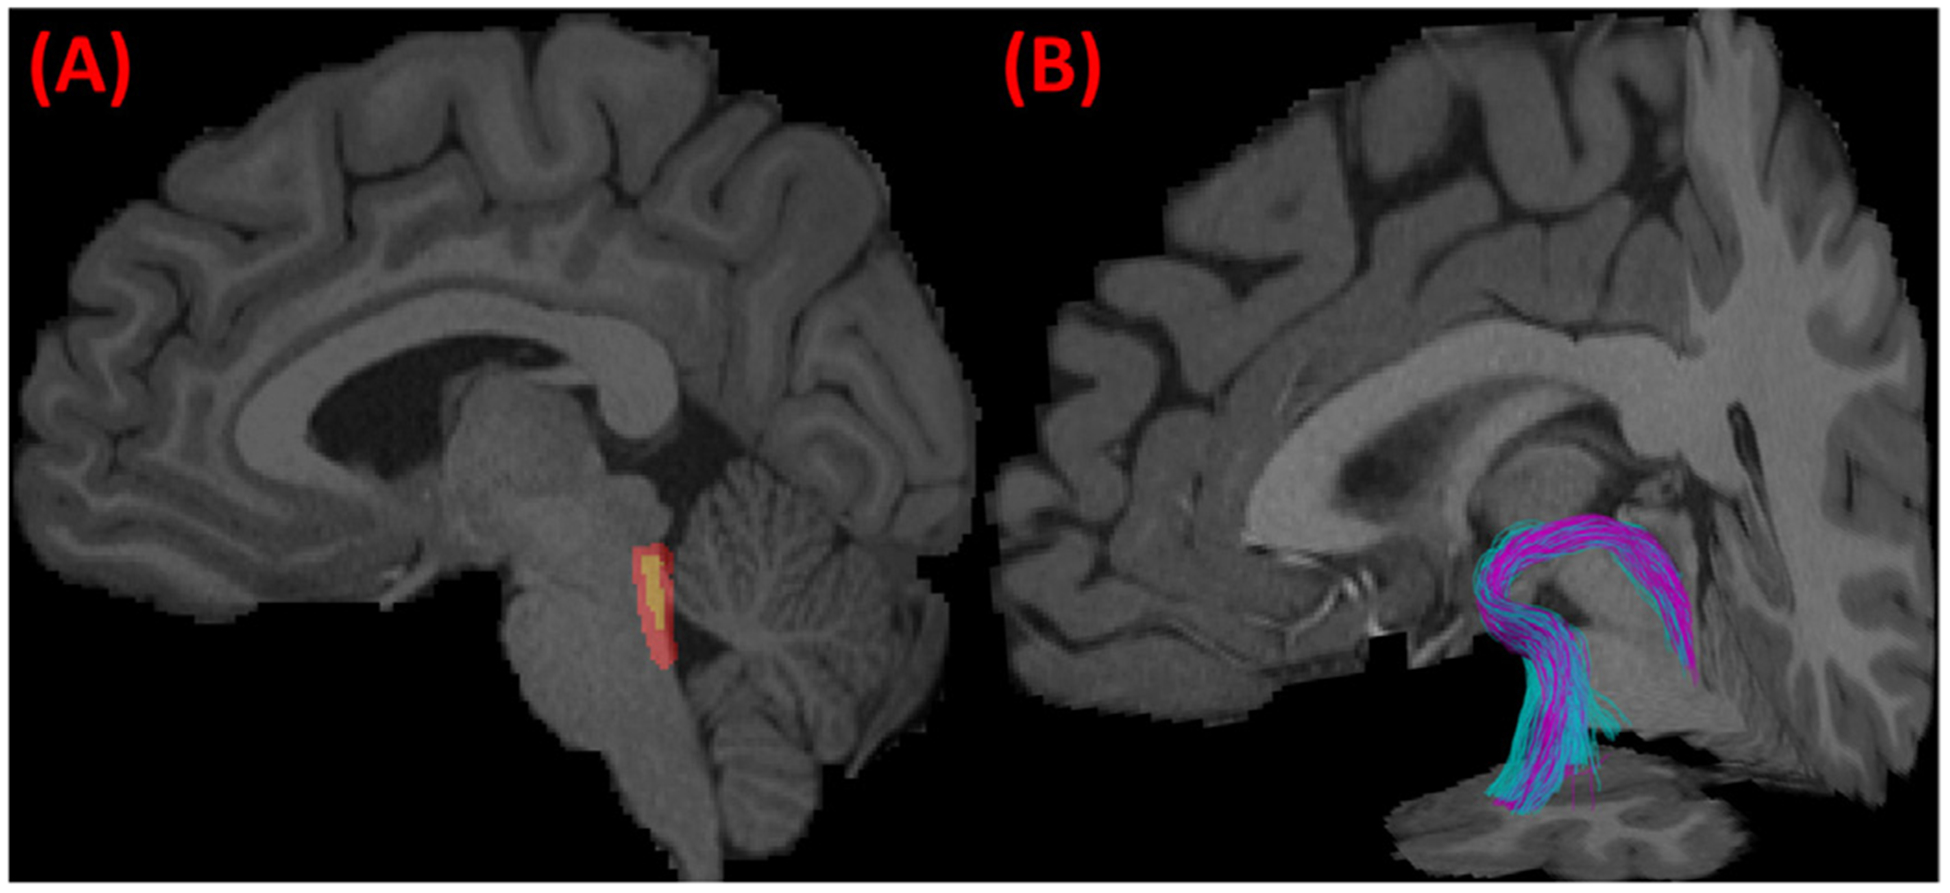
Application of the LC-TEC bundle atlas to clinical imaging data from the ADNI. (A) The warped LC-TEC bundle atlas on the FA image of an ADNI subject. (B) The reconstructed surface representation of the LC-TEC bundle mask. (C) Digitization of the medial core of the LC-TEC bundle into 50 points.
Furthermore, we developed an automated approach for localized analysis of LC-TEC bundle connectivity. For each subject, we first computed a surface representation of the LC-TEC bundle on each hemisphere by thresholding the warped atlas at 0.2 and running a mesh reconstruction tool we developed previously (Shi et al., 2010), which ensures the mesh with genus-zero topology (Fig. 4 (B)). The threshold of 0.2 was chosen empirically to ensure the region used for medial core calculation was within the brain region and avoid potential cerebrospinal fluid (CSF) pollution from the neighboring ventricles in the brainstem. After that, we computed the Reeb graph of the first non-constant Laplace-Beltrami eigenfunction on this mesh and used it to generate a medial core of the LC-TEC bundle (Shi et al., 2009). For all subjects, we sampled the medial core uniformly into 50 points from the LC to the TEC (Fig. 4 (C)) such that the neighboring points had an equal distance around 2mm. At each point of the medial core, we computed the radial diffusivity (RD) for statistical analysis. By pooling data from all subjects at the corresponding point of the medial core, we can perform localized statistical tests of group differences.
3. Results
3.1. LC-TEC fiber bundles from HCP subjects
We applied our bundle reconstruction method to the 40 HCP subjects, and successfully reconstructed the LC-TEC bundle for each hemisphere of every subject. Four representative examples were plotted in Fig. 5 (A)–(D). For each subject, the LC-TEC bundle from the left and right hemisphere was displayed over the MRI data to visualize its relative position to other anatomical structures. From all subjects, we can see the fiber tracts follow a consistent trajectory that first travel dorsally from the LC and then curve laterally toward the medial temporal lobe until it reaches the TEC. To further illustrate the spatial trajectory of the LC-TEC pathway with respect to neighboring anatomical structures, we plotted in Fig. 6 (A) the left LC-TEC fiber bundle in Fig. 5 (A) together with the thalamus, hippocampus, and the amygdala. In Fig. 6 (B)–(D), we overlaid both the left and right LC-TEC pathways of the HCP subject in Fig. 5 (A) with the T1-weighted MRI and the whole brain tract density image (TDI) (Calamante et al., 2010), which we computed with 1 million whole brain tracts based on FOD-based tractography. These results highlight the asymmetry of the white matter structures around the posterior thalamus and hence results in the slight asymmetry of the reconstructed LC-TEC fiber bundles across hemisphere. This trend is consistent across HCP subjects included in this study and reflected in the probabilistic atlas shown in Fig. 7.
Fig. 5.
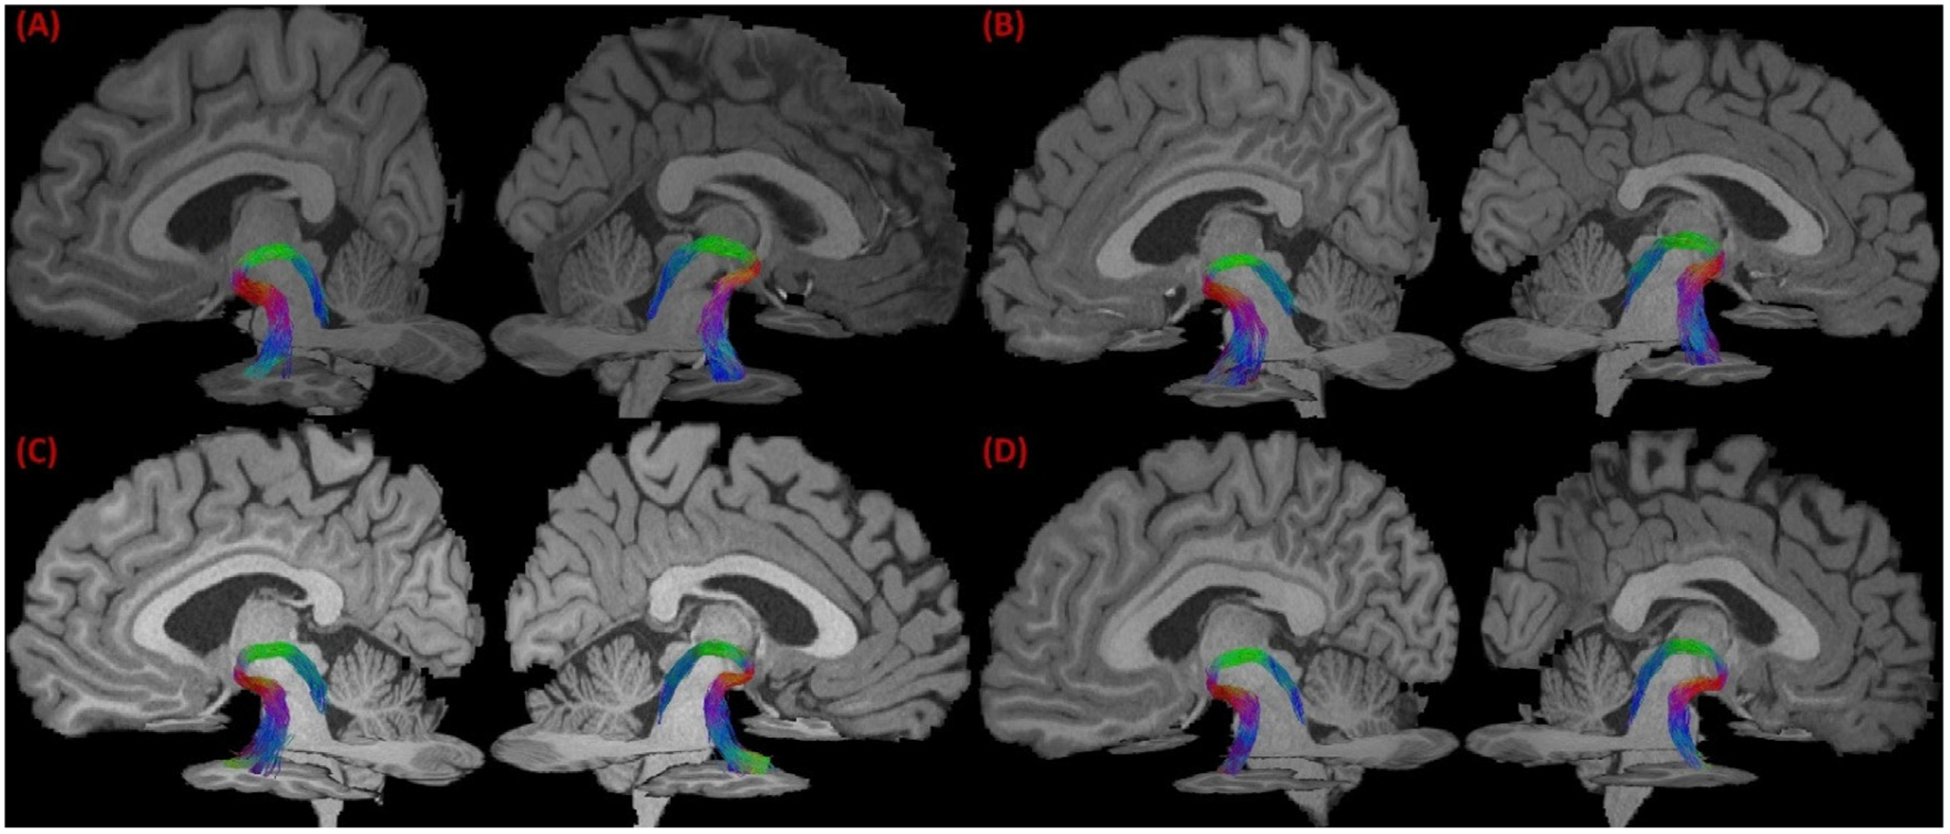
The reconstructed LC-TEC bundle from 4 representative HCP subjects. In (A)-(D), the LC-TEC bundle of the left and right hemisphere of each subject were overlaid with MRI slices to visualize their spatial trajectory.
Fig. 6.
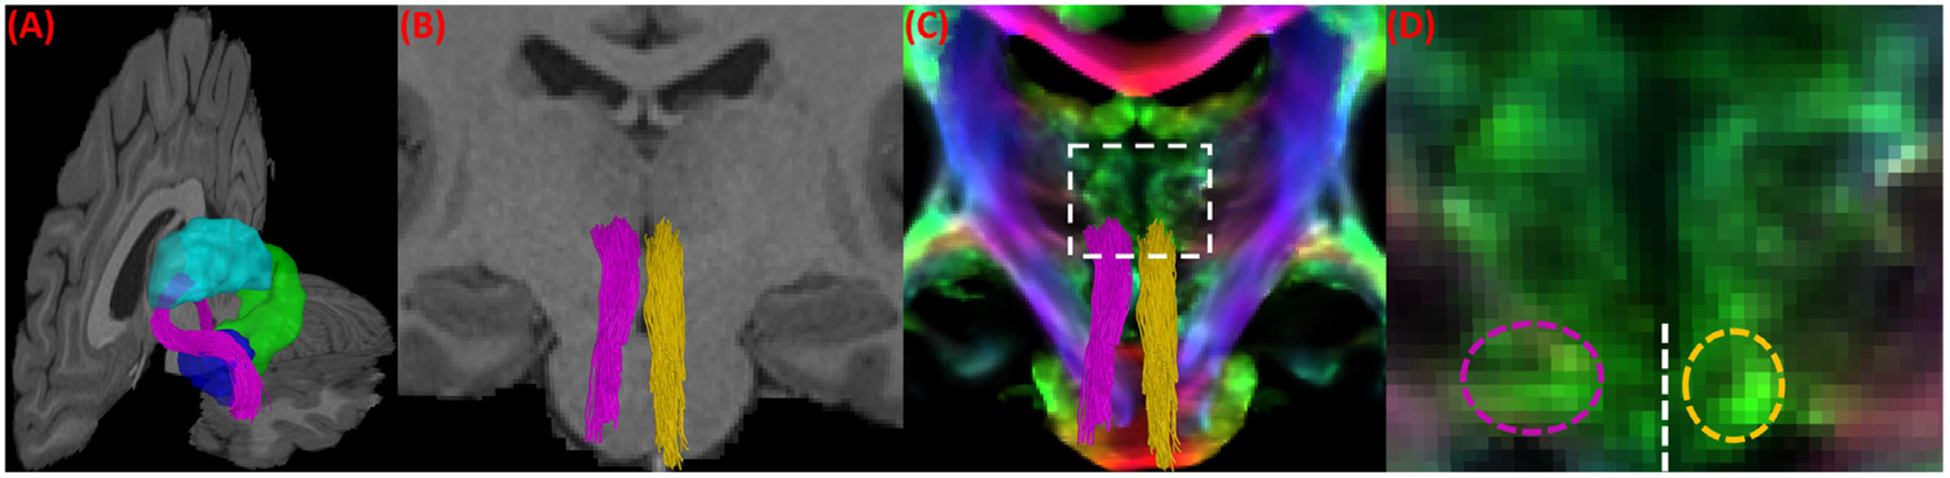
A more detailed illustration of the spatial trajectory of the LC-TEC fiber bundles for the HCP subject shown in Fig. 5 (A). (A) The left LC-TEC bundle from Fig. 5 (A) is plotted in purple together with neighboring anatomical structures: thalamus (cyan), hippocampus (green), and amygdala (blue) on the left hemisphere. (B) The intersection of both the left (purple) and right (yellow) LC-TEC bundle in Fig. 5 (A) with a coronal slice of the T1-weighted MRI of the HCP subject at the position of posterior thalamus. (C) The intersection of the left (purple) and right (yellow) LC-TEC bundle with a coronal slice of the TDI image from the same HCP subject at the same position as in (B). For the region within the dashed rectangle, a zoomed-in view of the TDI image is provided in (D) to illustrate the asymmetry of the white matter structures in this area and hence the resulting asymmetry of the reconstructed LC-TEC fiber pathways, where the dashed purple and yellow ellipse show the intersection of the left and right LC-TEC bundles with the TDI image, respectively. The dashed white line marks the separation of the left and right hemisphere.
Fig. 7.
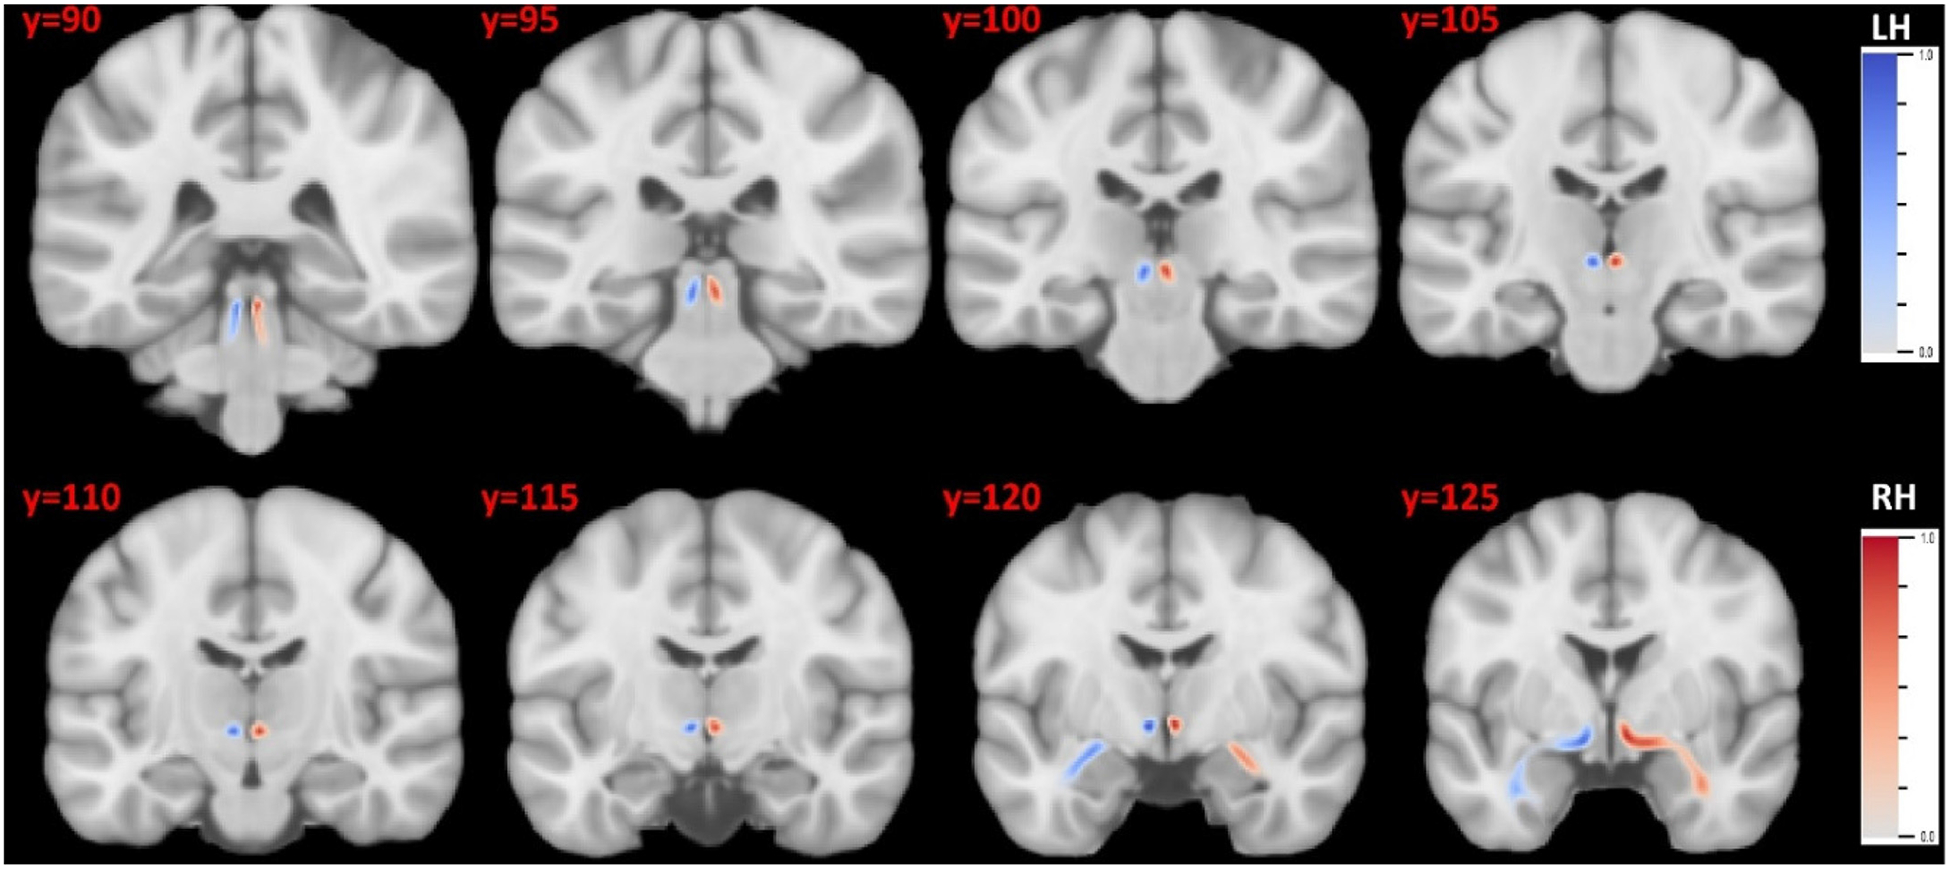
The probabilistic atlas of the LC-TEC bundles in the MNI152 space. The atlas for the left and right bundle was displayed in blue and red, respectively. LH: left hemisphere; RH: right hemisphere.
3.2. Probabilistic atlas of LC-TEC bundles in the MNI152 space
Using the LC-TEC bundles reconstructed from the 40 HCP subjects, we built a probabilistic atlas in the MNI152 space. In Fig. 7, we show the atlas on 8 coronal slices to visualize its spatial extent and trajectory. The slice number in the MNI152 atlas is displayed on the top-left corner of each slice. The atlas for the left and right LC-TEC bundle were plotted in blue and red colors, respectively. The consistent trajectory of the 40 subjects can also be reflected from the compact distribution of the fiber atlas on both hemispheres. We have included the NIFTI file of this atlas as part of the supplement and distribute it publicly on NITRC (https://www.nitrc.org/projects/brainstem_atlas/).
3.3. Localized groupwise comparisons with ADNI2 data
To demonstrate the application of our LC-TEC bundle atlas to clinical imaging data, we applied it to study localized changes of LC-TEC connectivity between the CN(A−), and the EMCI (A+), LMCI (A+), and AD(A+) groups using data from ADNI2 as described in Table 1. We first deformed the LC-TEC bundle atlas from the MNI152 space to each ADNI2 subject and parameterized the bundle on each hemisphere with 50 points on its medial core as shown in Fig. 4 (C). For each ADNI2 subject, we computed the radial diffusivity (RD) at each point of the medial core of the LC-TEC bundle on each hemisphere. The RD is chosen as the feature for statistical analysis because it has been shown to have higher sensitivity than the FA in AD imaging studies (Acosta-Cabronero and Nestor, 2014; Nir et al., 2013). We then pooled data from all subjects at the corresponding point of the LC-TEC bundle and computed the effect size (Cohen’s D) between two groups (CN(A−) vs EMCI(A+), CN(A−) vs LMCI(A+) and CN(A−) vs AD(A+)) as shown in Fig. 8. A positive effect size means the disease group has larger RD than the normal controls The RD values increases from CN to the EMCI group, to the LMCI group, and then to the AD group, which suggests a decrease of fiber integrity with the increase of disease severity. We also ran a two-tailed student t-test at each point to examine the significance of the localized difference between the CN(A−) and each of the disease group. To correct for multiple comparisons, false discovery rate (FDR) correction (Benjamini and Hochberg, 1995) was applied to all group comparisons along the fiber pathway at the level of 0.05 using the MATLAB function mafdr. In Fig. 8, we have plotted points in colored circles whose adjusted p-values after FDR correction reach significance at various levels (blue: p < 0.05; green: p < 0.01; red: p < 0.001). We can observe that most early differences occur between the 31st and 40th points along the digitized medial core of the LC-TEC bundle, which correspond to the portion of the pathway that moves past the inferior part of the thalamus and bends laterally toward the transentorhinal cortex as can be seen from the illustration in Fig. 4. With the increase of disease severity, we can also see more widespread differences with larger effect sizes along the LC-TEC pathways have been detected with our method.
Fig. 8.
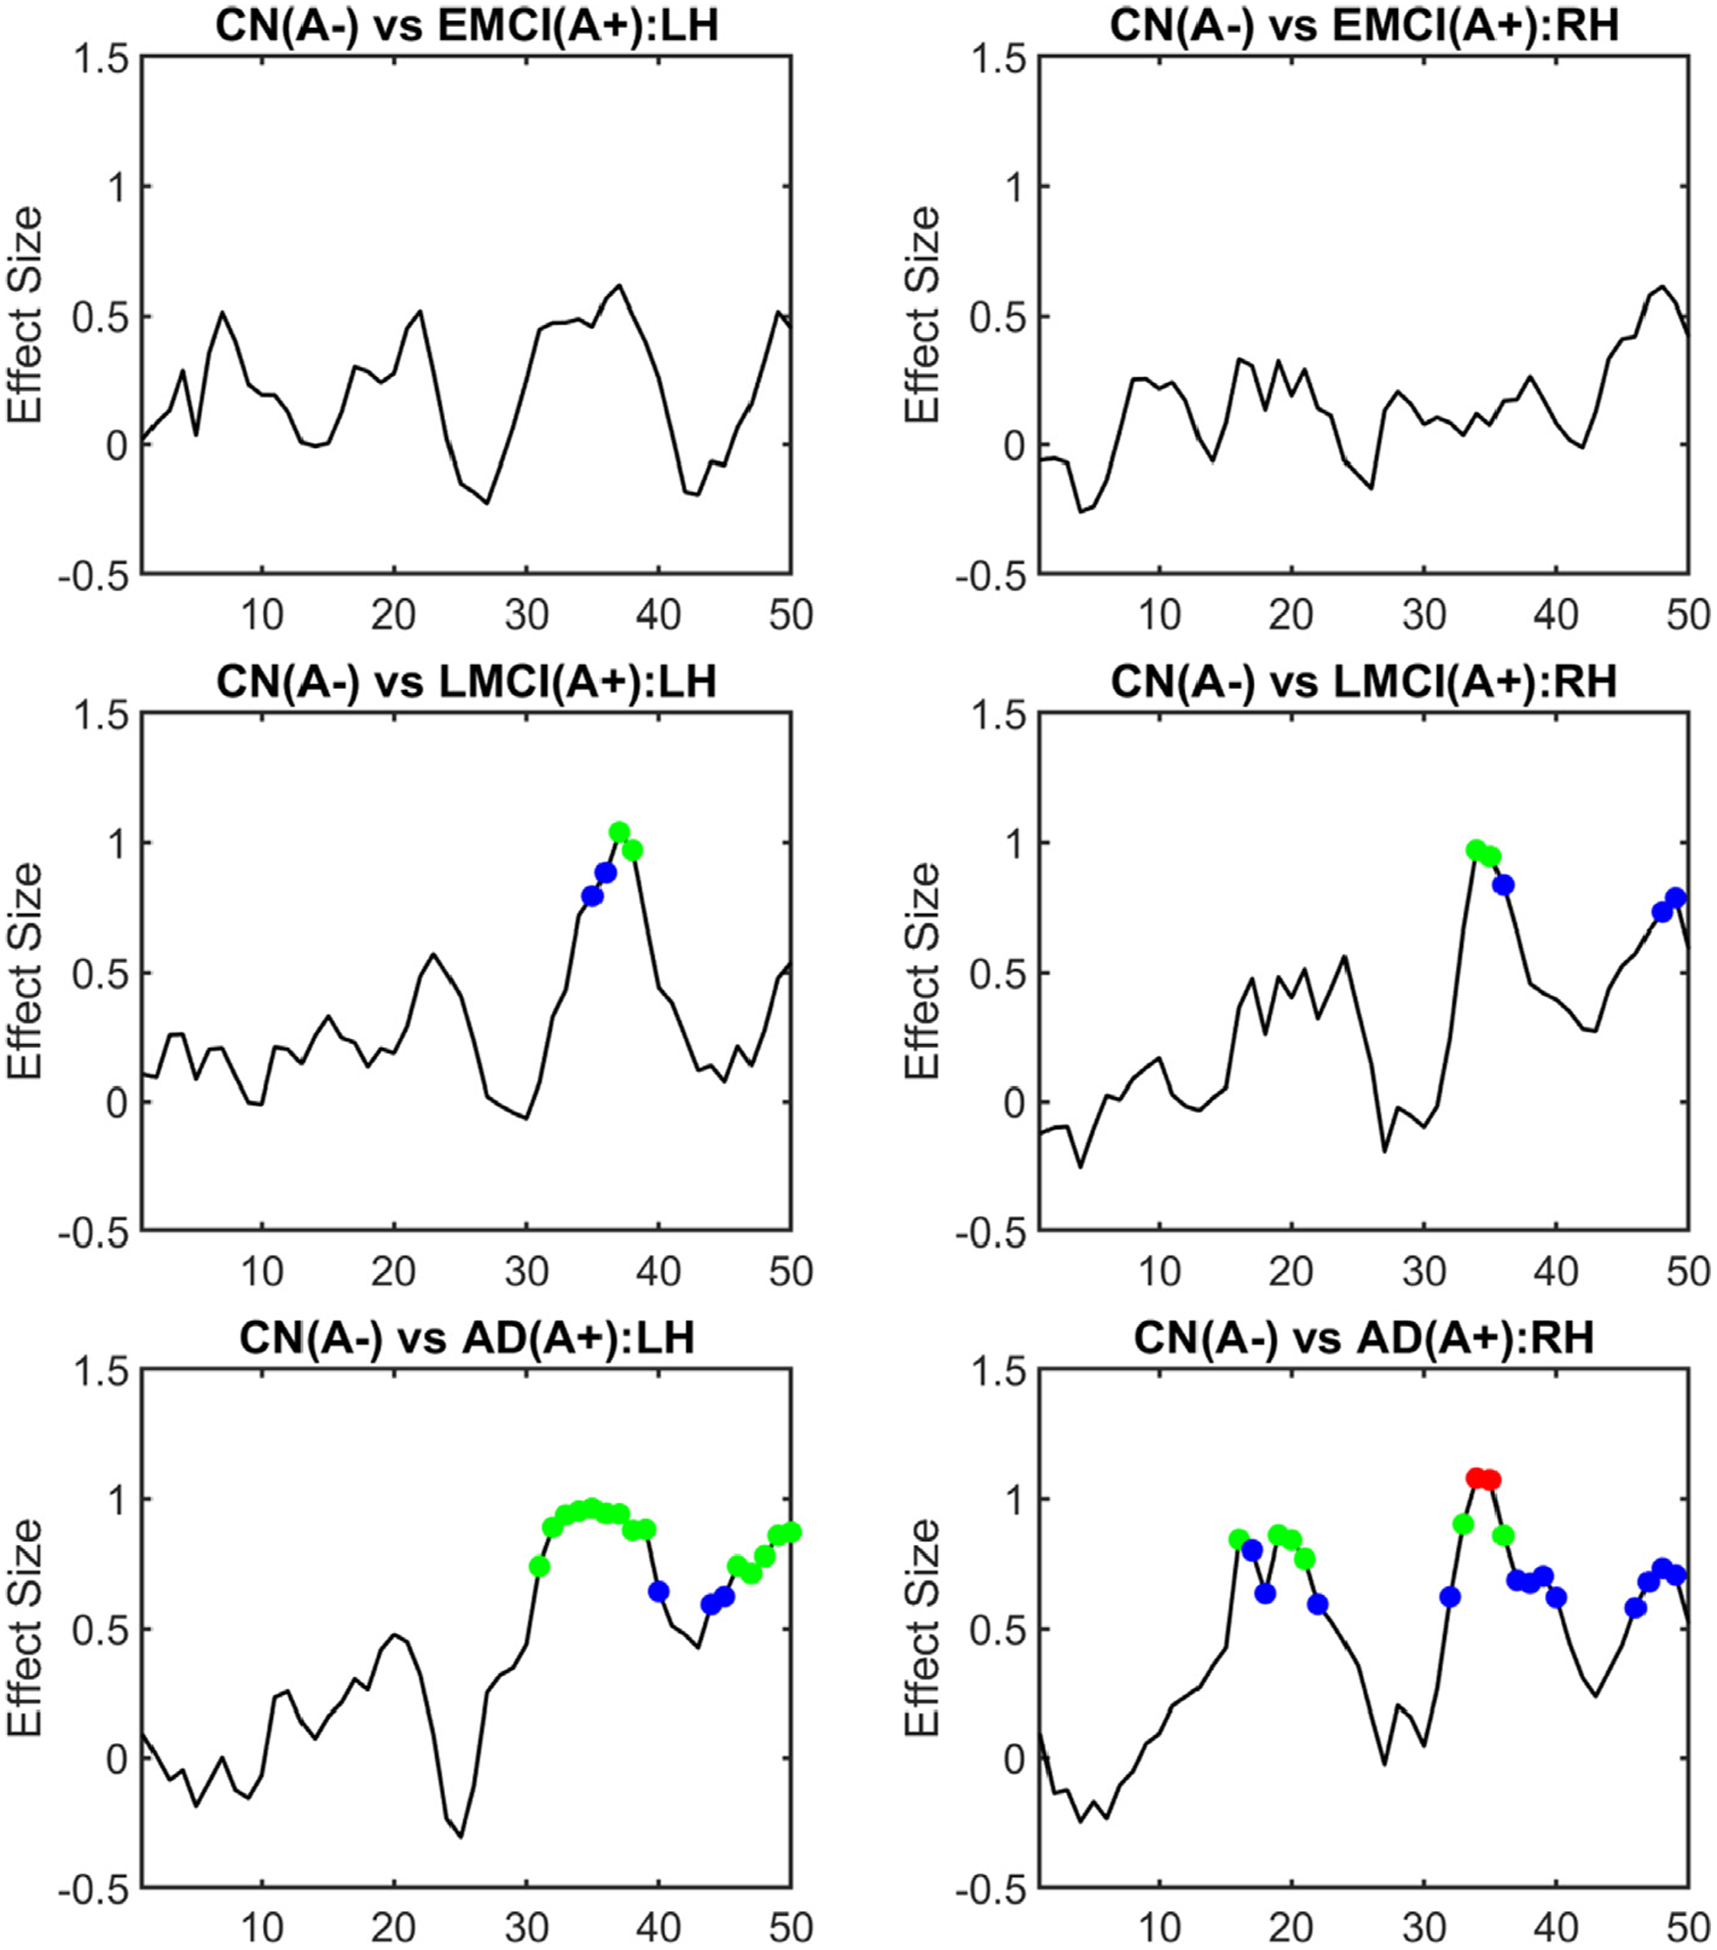
Localized group differences of LC-TEC bundle connectivity using ADNI2 data. The effect size (Cohen’s D) of the group difference of RD at each point along the medial core of the LC-TEC bundle was computed for each group comparison: CN(A−) vs EMCI(A+), CN(A−) vs LMCI(A+), and CN(A−) vs AD(A+). Results from both the left hemisphere (LH) and right hemisphere (RH) were plotted. A two-tailed t-test was also applied at each point of the medial core of the LC-TEC bundle to examine the statistical significance of the group difference. After FDR correction, points were highlighted as colored circles in each plot if their adjusted p-values reach significance (blue: p < 0.05; green: p < 0.01; red: p < 0.001).
We also used the cingulate bundle in the medial temporal lobe (CB_MTL) as a region to compare with the results obtained from the LC-TEC bundle. This would help demonstrate how the connectivity changes of the LC-TEC bundle differ from those of medial temporal lobe areas. To obtain the CB_MTL in both the left and right hemisphere, we automatically warped a publicly available white matter atlas (Oishi et al., 2009), which included the CB_MTL regions, to each ADNI2 subject with the ANTS software and the same parameter setting used for warping the LC_TEC atlas to each subject. The average RD of the CB_MTL region in both hemispheres were then computed for each subject and used for the analysis of group differences. The effect size (Cohen’s D) was computed for pairwise differences between the RD of the CN(A−) and the other three disease groups and listed in Table 2. The p-values of all group comparisons after FDR correction were also listed in Table 2. Similar to the RD on the LC-TEC pathway, we see a gradual increase of the effect size with the increase of disease severity, except the right cingulate bundle when the disease group changes from EMCI to LMCI. In addition, we see the group difference between the RD of LMCI (A+) and CN (A−) along the LC-TEC pathway can reach an effective size of around one, which is much larger than the cingulate bundle, especially on the right hemisphere. Similarly, for the group difference between CN(A−) and AD(A+), the RD on the LC-TEC pathway can achieve a larger effect size (>1) than the cingulate bundle (0.81) on the right hemisphere.
Table 2.
Group differences of the RD of the cingulate bundle in the medial temporal lobe. The effect size and adjusted p-value after FDR correction are listed for each group comparison. n.s: not significant.
| Left Hemisphere | Right Hemisphere | |
|---|---|---|
| CN (A−) vs EMCI (A+) | 0.26 (n.s.) | 0.58 (p < 0.05) |
| CN(A−) vs LMCI (A+) | 0.74 (p < 0.01) | 0.54 (p < 0.05) |
| CN (A−) vs AD (A+) | 1.00 (p < 1e − 3) | 0.81 (p < 1e − 3) |
4. Discussion and conclusion
Histopathology studies suggest tau pathology in AD occurs earliest in the LC of the brainstem (Braak et al., 2011) and may underlie some of the behavioral changes occurring in the disease. While the emergence of tau PET imaging techniques (Jagust et al., 2015; Schöll et al., 2016) provided an invaluable tool for the in vivo quantification of tau burden in cortical regions, the limited resolution of PET and off-target binding of popular tracers (Hansen et al., 2016; Marquie et al., 2015) still limit our ability to map the tau burden in the LC nuclei and other brainstem areas. On the other hand, great advances in connectome imaging techniques (Sotiropoulos et al., 2013; Ugurbil et al., 2013) have enabled the study of the integrity of brain pathways with unprecedented details (Shi and Toga, 2017), which offers the opportunity of developing alternative approaches for measuring LC atrophy due to tau pathology. By leveraging the cutting-edge brain imaging data from the Human Connectome Project (HCP)(Van Essen et al., 2013), in this work we developed a novel atlas of LC-TEC pathways. Following the quality control procedures in our previous work on brainstem pathways (Tang et al., 2018), we carefully selected 40 HCP subjects with minimal residual distortion in the brainstem area and applied advanced connectome modeling techniques to reconstruct the fiber bundles of the LC-TEC pathway on both hemispheres. After that, a probabilistic atlas of the LC-TEC pathway was constructed in the standard MNI152 space and distributed publicly to the research community.
To apply the high-resolution LC-TEC pathway atlas on clinical imaging data, we developed an automated method to calculate the medial core of each pathway for the localized analysis of connectivity changes. Using ADNI2 data, we found that fiber integrity within this pathway decreased with increasing disease severity. For future work, we will apply our atlas to large-scale clinical imaging data and characterize LC-TEC pathway connectivity changes during normal aging, the development of AD, and their association with neuropsychiatric symptoms. The impact of sex, education, and genetics on the connectivity changes of this critical pathway in the early development of AD will be examined. For studies with both tau PET and diffusion MRI data, we will also conduct joint analyses with tau PET and gray matter thickness on the TEC area, which will facilitate the characterization of the relative staging of these pathologies and help elucidate whether LC or other cortical areas is the earliest site for the onset of tau pathology and resulting neurodegeneration (Heinsen and Grinberg, 2018; Kaufman et al., 2018).
In this work, we focus on the development of a robust method to reconstruct the LC-TEC pathway for AD imaging research, but the LC also plays an important role in many other disorders. The pathway between LC and dopaminergic midbrain areas including substantia nigra (SN) and ventral tegmental area (VTA) will be important for PD research. The pathway from LC to hypothalamus will be of interest in the study of primary sleep disorders as well as in sleep changes occurring in AD. In our future work, we will extend the current method for the reconstruction of these important LC pathways.
For atlas construction, we relied on careful manual inspection of residual distortions in the HCP data by an experienced anatomist (Y Tang). This is time consuming and depend on brainstem anatomical knowledge. For future work, it is important to develop automated quality control of distortion artifacts of diffusion MRI in the brainstem area. Unlike the HCP protocol that acquires dMRI data from two phase encoding directions for distortion correction, ADNI2 only acquires the dMRI data from one phase encoding direction on 3T GE scanners. Because no field map was acquired in ADNI2 dMRI data, we relied on a nonlinear registration between the T1-weighted and diffusion MRI in deforming the LC-TEC pathway atlas to the space of the dMRI data of each subject. From the observation of the nonlinear deformations on the LC-TEC pathway, the impact of the nonlinear distortion on the LC-TEC pathway are very mild in our experience. This can be further confirmed with the more recent data from ADNI3 that also acquires scans for field map calculation. This allows us to quantitatively examine the magnitude of the distortion on the medial core of the LC-TEC pathway as shown on two representative ADNI3 subjects in Fig. 9 (A)–(C). For all 29 subjects from the same site, a group comparison between the CN and impaired group (MCI and AD) shows no significant difference on any point of the LC-TEC pathway (Fig. 9 (D)). From the results in Fig. 9, we can see that most of the points on the medial core of the LC-TEC pathways with significant group differences shown in Fig. 8 have distortions below half of the voxel size of the dMRI data. For future work, we will perform further comparisons of different distortion correction methods on ADNI3 data with more heterogeneous acquisition protocols than the data used in this work. Another important area of research is to improve existing methods for distortion correction (Qiao et al., 2019). This will greatly enhance the connectivity analysis of brainstem connectivity including the LC-TEC pathways.
Fig. 9.
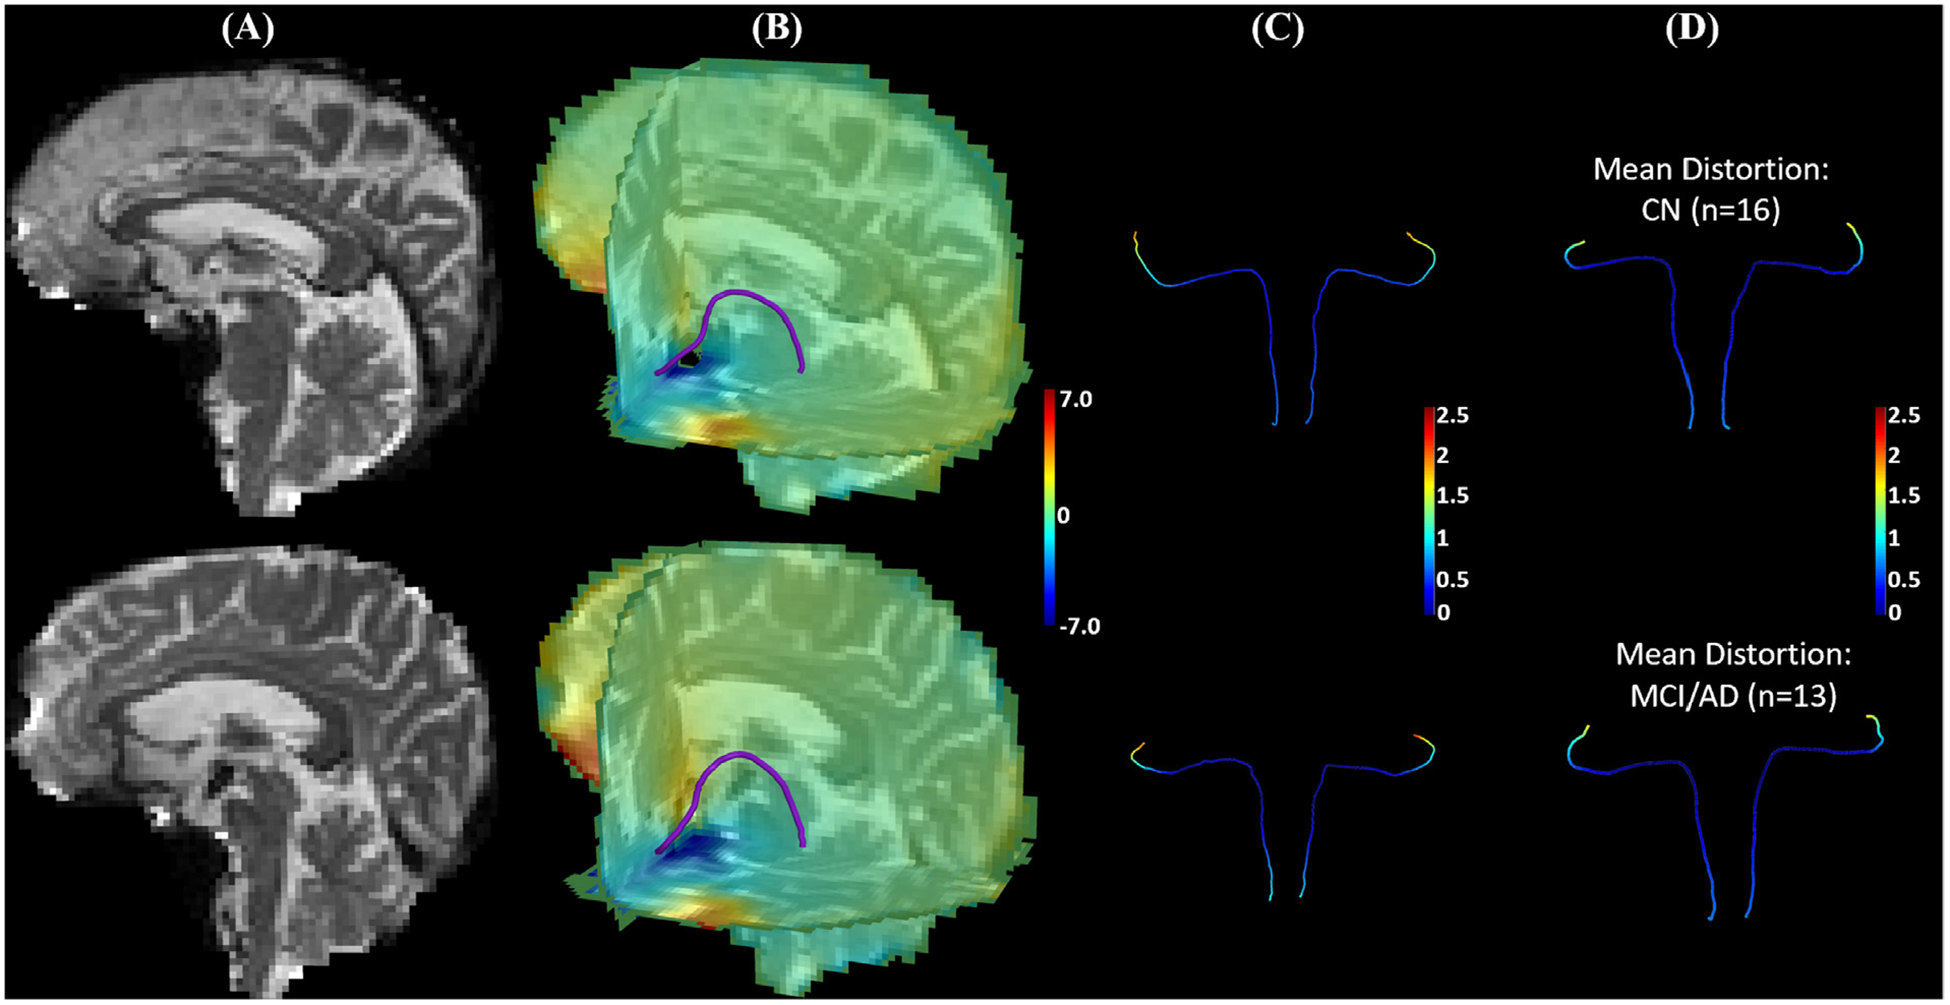
The data of ADNI3 subjects from the same site (site id = 003) were used to illustrate susceptibility induced distortions on the medial core of the LC-TEC pathway. Besides the dMRI data, one phase difference image and two magnitude images were acquired from these subjects to compute a field map using the fsl_prepare_fieldmap tool from FSL, which was then used for distortion correction with a publicly available tool called dti_Preprocess (Jenkinson, 2003). After that, the LC pathway atlas was deformed to the B0 image of each subject to obtain the distortion on each point of the medial core of the LC-TEC pathway. In (A)-(C), results from an ADNI3 subject (003_S_6264) with mild distortions and another ADNI3 subject (003_S_6833) with more severe distortions at brain stem were shown on the top and bottom row, respectively. (A) B0 image. (B) An overlay of the medial core of the left LC-TEC pathway over the 3-slice view of the distortion map along the anterior-posterior direction. (C) The medial core of the LC-TEC pathways on both hemispheres are colored by the magnitude of the distortion from susceptibility. Note that the magnitude is below 1mm for point 1–40 on the digitized medial core of both subjects, which is less than half of the voxel resolution (2mm). (D) For all ADNI3 subjects from the same site, we split them into CN (n = 16) and MCI/AD (n = 13) groups, and displayed the mean value of the distortion on the LC pathway medical core of a representative subject from each group. Top: CN group; Bottom: MCI/AD group. A two-tailed t-test was applied to each point of the medial core to examine group differences and no statistical difference was detected on any point with the minimal p-value > 0.45.
The second limitation of our work is the lack of ground truth for rigorous validation. In our method, we followed guidance from previous anatomical literature (Marien et al., 2004) to design the ROI-based protocols for fiber bundle reconstruction. Overall, we relied on known anatomical ROIs (LC and TEC), existing characterizations of the overall trajectory of the LC pathway as shown in Fig. 1, and the consistent tract trajectories across HCP subjects to obtain the final reconstruction of the LC-TEC fiber bundle. In our current research, we are acquiring high-resolution diffusion MRI from post-mortem samples and will compare with expert delineations on histology to quantitatively examine the accuracy of the reconstructed LC pathways. For example, the reconstructed atlas exhibits a slight asymmetry of the reconstructed pathways across the hemispheres as shown in Fig. 7 and highlighted in Fig. 6. While this asymmetry is consistent across subjects in our study, post-mortem data will provide invaluable validations to the fidelity of this observation in our atlas. Another example is that our reconstruction of the LC-TEC tracts consistently stops at the anterior portion of the TEC region. This could potentially be due to the smoothness regularization of the tractography methods that prevents sharp turns needed to continue the tracking within the TEC region. For future work, we will examine alternative tracking algorithms or perform more dedicated tracking within the TEC ROI.
Previous works detected early diffusivity changes between EM-CIs and CNs in parahippocampal (Nir et al., 2013) and hippocampal (Lee et al., 2017) ROIs using ADNI2 data. Using high-resolution T2-weighted MRIs from ADNI2, structural changes in sub-regions of the medial temporal lobe were detected between EM-CIs and CNs (Wolk et al., 2017). In this work, however, the third limitation is that significant differences along the LC-TEC pathway were only detected in comparisons involving the LMCI and AD group when we applied our atlas to the ADNI2 data. This could be due to the limited resolution of the diffusion MRI data as compared to the small size of the LC pathways. An increase of spatial resolution of diffusion imaging and sample size in future studies might help resolve this difficulty. This could also be potentially related to the heterogeneity of the EMCI group in terms of AD pathology since the separation of EMCI and LMCI is only based on a single memory test and can include a large proportion of false positives (Edmonds et al., 2019). With the increasing availability of in vivo amyloid and tau PET imaging, one important direction of future work will be the grouping of subjects according to the recently proposed ATN framework (Jack et al., 2018). This would allow us to perform in vivo Braak staging of AD subjects (Maass et al., 2017) and examine how the LC-TEC pathways are affected at the earliest stage of AD as defined by more specific markers of AD pathology.
In summary, there are three main contributions in this work. First, we developed a robust protocol for the reconstruction of the LC-TEC pathways from connectome imaging data. Second, we created and publicly distributed a probabilistic atlas of the LC-TEC pathways that can be used by researchers interested in the development of early AD imaging markers. Third, we developed and demonstrated an automated approach that applies the high-resolution atlas to diffusion MRI data from clinical imaging studies for the localized analysis of connectivity changes in this critical pathway. For future work, there are various directions we will pursue to advance LC imaging research including biological validation, application in clinical imaging studies, and extension to other brain disorders.
Supplementary Material
Acknowledgements
This work was in part supported by the National Institute of Health (NIH) under grant RF1AG056573, R01EB022744, R01AG062007, R01AG025340, R21AG064776, P41EB015922, U01AG051218, P50AG05142. The work of Y. Tang was also in part supported by the National Natural Science Foundation of China (Grant number: 31872802, 81301280).
Data used in this paper were partly provided by the Human Connectome Project, WU-Minn Consortium (Principal Investigators: David Van Essen and Kamil Ugurbil; 1U54MH091657) funded by the 16NIH Institutes and Centers that support the NIH Blueprint for Neuroscience Research; and by the McDonnell Center for Systems Neuroscience at Washington University.
Data used in this paper were partly provided by the Alzheimer’s Disease Neuroimaging Initiative (ADNI) (National Institutes of Health Grant U01 AG024904) and DOD ADNI (Department of Defense award number W81XWH-12-2-0012). ADNI is funded by the National Institute on Aging, the National Institute of Biomedical Imaging and Bioengineering, and through generous contributions from the following: AbbVie, Alzheimer’s Association; Alzheimer’s Drug Discovery Foundation; Araclon Biotech; BioClinica, Inc.; Biogen; Bristol-Myers Squibb Company; CereSpir, Inc.; Cogstate; Eisai Inc.; Elan Pharmaceuticals, Inc.; Eli Lilly and Company; EuroImmun; F. Hoffmann-La Roche Ltd and its affiliated company Genentech, Inc.; Fujirebio; GE Healthcare; IX-ICO Ltd.; Janssen Alzheimer Immunotherapy Research & Development, LLC.; Johnson & Johnson Pharmaceutical Research & Development LLC.; Lumosity; Lundbeck; Merck & Co., Inc.; Meso Scale Diagnostics, LLC.; NeuroRx Research; Neurotrack Technologies; Novartis Pharmaceuticals Corporation; Pfizer Inc.; Piramal Imaging; Servier; Takeda Pharmaceutical Company; and Transition Therapeutics. The Canadian Institutes of Health Research is providing funds to support ADNI clinical sites in Canada. Private sector contributions are facilitated by the Foundation for the National Institutes of Health (www.fnih.org). The grantee organization is the Northern California Institute for Research and Education, and the study is coordinated by the Alzheimer’s Therapeutic Research Institute at the University of Southern California. ADNI data are disseminated by the Laboratory for Neuro Imaging at the University of Southern California.
Footnotes
Supplementary materials
Supplementary material associated with this article can be found, in the online version, at doi:10.1016/j.neuroimage.2020.117301.
Data used in preparation of this article were partly obtained from the Alzheimer’s Disease Neuroimaging Initiative (ADNI) database (adni.loni.usc.edu). As such, the investigators within the ADNI contributed to the design and implementation of ADNI and/or provided data but did not participate in analysis or writing of this report. A complete listing of ADNI investigators can be found at: http://adni.loni.usc.edu/wp-content/uploads/how_to_apply/ADNI_Acknowledgement_List.pdf
References
- Acosta-Cabronero J, Nestor PJ, 2014. Diffusion tensor imaging in Alzheimer’s disease: insights into the limbic-diencephalic network and methodological considerations. Front. Aging Neurosci 6. [DOI] [PMC free article] [PubMed] [Google Scholar]
- Avants BB, Epstein CL, Grossman M, Gee JC, 2008. Symmetric diffeomorphic image registration with cross-correlation: evaluating automated labeling of elderly and neurodegenerative brain. Med. Image Anal 12, 26–41. [DOI] [PMC free article] [PubMed] [Google Scholar]
- Benarroch EE, 2009. The locus ceruleus norepinephrine system: functional organization and potential clinical significance. Neurology 73, 1699–1704. [DOI] [PubMed] [Google Scholar]
- Benjamini Y, Hochberg Y, 1995. Controlling the false discovery rate: a practical and powerful approach to multiple testing. J. R. Stat. Soc 57, 289–300. [Google Scholar]
- Betts MJ, Cardenas-Blanco A, Kanowski M, Jessen F, Düzel E, 2017. In vivo MRI assessment of the human locus coeruleus along its rostrocaudal extent in young and older adults. Neuroimage 163, 150–159. [DOI] [PubMed] [Google Scholar]
- Betts MJ, Cardenas-Blanco A, Kanowski M, Spottke A, Teipel SJ, Kilimann I, Jessen F, Düzel E, 2019. Locus coeruleus MRI contrast is reduced in Alzheimer’s disease dementia and correlates with CSF Aβ levels. Alzheimer’s & Dementia 11, 281–285. [DOI] [PMC free article] [PubMed] [Google Scholar]
- Braak H, Braak E, 1991. Neuropathological stageing of Alzheimer-related changes. Acta Neuropathol. 82, 239–259. [DOI] [PubMed] [Google Scholar]
- Braak H, Braak E, 1995. Staging of Alzheimer’s disease-related neurofibrillary changes. Neurobiol. Aging 16, 271–278 discussion 278–284. [DOI] [PubMed] [Google Scholar]
- Braak H, Del Tredici K, 2011. Alzheimer’s pathogenesis: is there neuron-to-neuron propagation? Acta Neuropathol. 121, 589–595. [DOI] [PubMed] [Google Scholar]
- Braak H, Del Tredici K, 2015. The preclinical phase of the pathological process underlying sporadic Alzheimer’s disease. Brain 138, 2814–2833. [DOI] [PubMed] [Google Scholar]
- Braak H,K,T, 2015. Neuroanatomy and Pathology of Sporadic Alzheimer’s Disease. Springer International Publishing. [PubMed] [Google Scholar]
- Braak H, Thal DR, Ghebremedhin E, Del Tredici K, 2011. Stages of the pathologic process in Alzheimer disease: age categories from 1 to 100 years. J. Neuropathol. Exp. Neurol 70, 960–969. [DOI] [PubMed] [Google Scholar]
- Calamante F, Tournier J-D, Jackson GD, Connelly A, 2010. Track-density imaging (TDI): Super-resolution white matter imaging using whole-brain track-density mapping. Neuroimage 53, 1233–1243. [DOI] [PubMed] [Google Scholar]
- Cirelli C, Pompeiano M, Tononi G, 1996. Neuronal gene expression in the waking state: a role for the locus coeruleus. Science 274, 1211–1215. [DOI] [PubMed] [Google Scholar]
- Clewett DV, Lee TH, Greening S, Ponzio A, Margalit E, Mather M, 2015. Neuromelanin marks the spot: identifying a locus coeruleus biomarker of cognitive reserve in healthy aging. Neurobiol. Aging [DOI] [PMC free article] [PubMed] [Google Scholar]
- Cope TE, Rittman T, Borchert RJ, Jones PS, Vatansever D, Allinson K, Passamonti L, Vazquez Rodriguez P, Bevan-Jones WR, O’Brien JT, Rowe JB, 2018. Tau burden and the functional connectome in Alzheimer’s disease and progressive supranuclear palsy. Brain 141, 550–567. [DOI] [PMC free article] [PubMed] [Google Scholar]
- Dahl MJ, Mather M, Düzel S, Bodammer NC, Lindenberger U, Kühn S, Werkle-Bergner M, 2019. Higher rostral locus coeruleus integrity is associated with better memory performance in older adults. bioRxiv, 332098. [DOI] [PMC free article] [PubMed] [Google Scholar]
- de Calignon A, Polydoro M, Suarez-Calvet M, William C, Adamowicz DH, Kopeikina KJ, Pitstick R, Sahara N, Ashe KH, Carlson GA, Spires-Jones TL, Hyman BT, 2012. Propagation of tau pathology in a model of early Alzheimer’s disease. Neuron 73, 685–697. [DOI] [PMC free article] [PubMed] [Google Scholar]
- Ding S-L, Van Hoesen GW, 2010. Borders, extent, and topography of human perirhinal cortex as revealed using multiple modern neuroanatomical and pathological markers. Hum. Brain Mapp 31, 1359–1379. [DOI] [PMC free article] [PubMed] [Google Scholar]
- Edmonds EC, McDonald CR, Marshall A, Thomas KR, Eppig J, Weigand AJ, Delano-Wood L, Galasko DR, Salmon DP, Bondi MW Alzheimer’s Disease Neuroimaging, I., 2019. Early versus late MCI: Improved MCI staging using a neuropsychological approach. Alzheimer’s Dementia 15, 699–708. [DOI] [PMC free article] [PubMed] [Google Scholar]
- Fischl B, 2012. FreeSurfer. Neuroimage 62, 774–781. [DOI] [PMC free article] [PubMed] [Google Scholar]
- Franzmeier N, Rubinski A, Neitzel J, Kim Y, Damm A, Na DL, Kim HJ, Lyoo CH, Cho H, Finsterwalder S, Duering M, Seo SW, Ewers M, 2019. Functional connectivity associated with tau levels in ageing, Alzheimer’s, and small vessel disease. Brain 142, 1093–1107. [DOI] [PMC free article] [PubMed] [Google Scholar]
- Ghosh A, Torraville SE, Mukherjee B, Walling SG, Martin GM, Harley CW, Yuan Q, 2019. An experimental model of Braak’s pretangle proposal for the origin of Alzheimer’s disease: the role of locus coeruleus in early symptom development. Alzheimer’s Res. Ther 11, 59. [DOI] [PMC free article] [PubMed] [Google Scholar]
- Hammerer D, Callaghan MF, Hopkins A, Kosciessa J, Betts M, Cardenas-Blanco A, Kanowski M, Weiskopf N, Dayan P, Dolan RJ, Duzel E, 2018. Locus coeruleus integrity in old age is selectively related to memories linked with salient negative events. Proc. Natl. Acad. Sci. USA 115, 2228–2233. [DOI] [PMC free article] [PubMed] [Google Scholar]
- Hansen AK, Knudsen K, Lillethorup TP, Landau AM, Parbo P, Fedorova T, Audrain H, Bender D, Ostergaard K, Brooks DJ, Borghammer P, 2016. In vivo imaging of neuromelanin in Parkinson’s disease using 18F-AV-1451 PET. Brain 139, 2039–2049. [DOI] [PubMed] [Google Scholar]
- Hansen N, 2017. The longevity of hippocampus-dependent memory is orchestrated by the locus coeruleus-noradrenergic system. Neural Plast. 2017, 2727602. [DOI] [PMC free article] [PubMed] [Google Scholar]
- Heinsen H, Grinberg LT, 2018. On the origin of tau seeding activity in Alzheimer’s disease. Acta Neuropathol.. [DOI] [PMC free article] [PubMed] [Google Scholar]
- Hoenig MC, Bischof GN, Seemiller J, Hammes J, Kukolja J, Onur ÖA, Jessen F, Fliessbach K, Neumaier B, Fink GR, van Eimeren T, Drzezga A, 2018. Networks of tau distribution in Alzheimer’s disease. Brain 141, 568–581. [DOI] [PubMed] [Google Scholar]
- Jack CR Jr., Bennett DA, Blennow K, Carrillo MC, Dunn B, Haeberlein SB, Holtzman DM, Jagust W, Jessen F, Karlawish J, Liu E, Molinuevo JL, Montine T, Phelps C, Rankin KP, Rowe CC, Scheltens P, Siemers E, Snyder HM, Sperling R, Elliott C, Masliah E, Ryan L, Silverberg N, 2018. NIA-AA research frame-work: toward a biological definition of Alzheimer’s disease. Alzheimer’s Dementia 14, 535–562. [DOI] [PMC free article] [PubMed] [Google Scholar]
- Jacobs HIL, Hedden T, Schultz AP, Sepulcre J, Perea RD, Amariglio RE, Papp KV, Rentz DM, Sperling RA, Johnson KA, 2018a. Structural tract alterations predict downstream tau accumulation in amyloid-positive older individuals. Nat. Neurosci 21, 424–431. [DOI] [PMC free article] [PubMed] [Google Scholar]
- Jacobs HIL, Müller-Ehrenberg L, Priovoulos N, Roebroeck A, 2018b. Curvilinear locus coeruleus functional connectivity trajectories over the adult lifespan: a 7T MRI study. Neurobiol. Aging 69, 167–176. [DOI] [PubMed] [Google Scholar]
- Jacobs HIL, Riphagen JM, Ramakers IHGB, Verhey FRJ, 2019. Alzheimer’s disease pathology: pathways between central norepinephrine activity, memory, and neuropsychiatric symptoms. Mol. Psychiatry [DOI] [PubMed] [Google Scholar]
- Jagust WJ, Landau SM, Koeppe RA, Reiman EM, Chen K, Mathis CA, Price JC, Foster NL, Wang AY, 2015. The Alzheimer’s disease neuroimaging initiative 2 PET core: 2015. Alzheimers Dement. 11, 757–771. [DOI] [PMC free article] [PubMed] [Google Scholar]
- Jenkinson M, 2003. Fast, automated, N-dimensional phase-unwrapping algorithm. Magn. Reson. Med 49, 193–197. [DOI] [PubMed] [Google Scholar]
- Jenkinson M, Beckmann CF, Behrens TEJ, Woolrich MW, Smith SM, 2012. FSL. Neuroimage 62, 782–790. [DOI] [PubMed] [Google Scholar]
- Jones DK, Cercignani M, 2010. Twenty-five pitfalls in the analysis of diffusion MRI data. NMR Biomed. 23, 803–820. [DOI] [PubMed] [Google Scholar]
- Jones DT, Graff-Radford J, Lowe VJ, Wiste HJ, Gunter JL, Senjem ML, Botha H, Kantarci K, Boeve BF, Knopman DS, Petersen RC, Jack CR, 2017. Tau, amyloid, and cascading network failure across the Alzheimer’s disease spectrum. Cortex 97, 143–159. [DOI] [PMC free article] [PubMed] [Google Scholar]
- Joshi S, Davis B, Jomier M, Gerig G, 2004. Unbiased diffeomorphic atlas construction for computational anatomy. Neuroimage 23, S151–S160. [DOI] [PubMed] [Google Scholar]
- Joshi S, Li Y, Kalwani RM, Gold JI, 2016. Relationships between pupil diameter and neuronal activity in the locus coeruleus, colliculi, and cingulate cortex. Neuron 89, 221–234. [DOI] [PMC free article] [PubMed] [Google Scholar]
- Kammen A, Law M, Tjan BS, Toga AW, Shi Y, 2016. Automated retinofugal visual pathway reconstruction with multi-shell HARDI and FOD-based analysis. Neuroimage 125, 767–779. [DOI] [PMC free article] [PubMed] [Google Scholar]
- Kaufman SK, Del Tredici K, Thomas TL, Braak H, Diamond MI, 2018. Tau seeding activity begins in the transentorhinal/entorhinal regions and anticipates phospho-tau pathology in Alzheimer’s disease and PART. Acta Neuropathol. 136, 57–67. [DOI] [PMC free article] [PubMed] [Google Scholar]
- Keren NI, Lozar CT, Harris KC, Morgan PS, Eckert MA, 2009. In vivo mapping of the human locus coeruleus. Neuroimage 47, 1261–1267. [DOI] [PMC free article] [PubMed] [Google Scholar]
- Keren NI, Taheri S, Vazey EM, Morgan PS, Granholm A-CE, Aston-Jones GS, Eckert MA, 2015. Histologic validation of locus coeruleus MRI contrast in post-mortem tissue. Neuroimage 113, 235–245. [DOI] [PMC free article] [PubMed] [Google Scholar]
- Lee P, Ryoo H, Park J, Jeong Y, 2017. Morphological and microstructural changes of the hippocampus in early MCI: a study utilizing the Alzheimer’s disease neuroimaging initiative database. J. Clin. Neurol 13, 144–154. [DOI] [PMC free article] [PubMed] [Google Scholar]
- Lee T-H, Greening SG, Ueno T, Clewett D, Ponzio A, Sakaki M, Mather M, 2018. Arousal increases neural gain via the locus coeruleus-noradrenaline system in younger adults but not in older adults. Nat. Hum. Behav 2, 356–366. [DOI] [PMC free article] [PubMed] [Google Scholar]
- Liu KY, Acosta-Cabronero J, Cardenas-Blanco A, Loane C, Berry AJ, Betts MJ, Kievit RA, Henson RN, Düzel E, Howard R, Hämmerer D, 2019. In vivo visualization of age-related differences in the locus coeruleus. Neurobiol. Aging 74, 101–111. [DOI] [PMC free article] [PubMed] [Google Scholar]
- Liu L, Drouet V, Wu JW, Witter MP, Small SA, Clelland C, Duff K, 2012. Trans-Synaptic Spread of Tau Pathology In Vivo. PLoS One 7, e31302. [DOI] [PMC free article] [PubMed] [Google Scholar]
- Maass A, Landau S, Baker SL, Horng A, Lockhart SN, La Joie R, Rabinovici GD, Jagust WJ, 2017. Comparison of multiple tau-PET measures as biomarkers in aging and Alzheimer’s disease. Neuroimage 157, 448–463. [DOI] [PMC free article] [PubMed] [Google Scholar]
- Marien MR, Colpaert FC, Rosenquist AC, 2004. Noradrenergic mechanisms in neurodegenerative diseases: a theory. Brain Res. Rev 45, 38–78. [DOI] [PubMed] [Google Scholar]
- Marquie M, Normandin MD, Vanderburg CR, Costantino IM, Bien EA, Rycyna LG, Klunk WE, Mathis CA, Ikonomovic MD, Debnath ML, Vasdev N, Dickerson BC, Gomperts SN, Growdon JH, Johnson KA, Frosch MP, Hyman BT, Gomez-Isla T, 2015. Validating novel tau positron emission tomography tracer [F-18]-AV-1451 (T807) on postmortem brain tissue. Ann. Neurol 78, 787–800. [DOI] [PMC free article] [PubMed] [Google Scholar]
- Mather M, Clewett D, Sakaki M, Harley CW, 2015. Norepinephrine ignites local hotspots of neuronal excitation: How arousal amplifies selectivity in perception and memory. Behav. Brain Sci 39, e200. [DOI] [PMC free article] [PubMed] [Google Scholar]
- Mather M, Harley CW, 2016. The Locus Coeruleus: essential for maintaining cognitive function and the aging brain. Trends Cognit. Sci 20, 214–226. [DOI] [PMC free article] [PubMed] [Google Scholar]
- Matthews KL, Chen CPLH, Esiri MM, Keene J, Minger SL, Francis PT, 2002. Noradrenergic changes, aggressive behavior, and cognition in patients with dementia. Biol. Psychiatry 51, 407–416. [DOI] [PubMed] [Google Scholar]
- Mouton PR, Pakkenberg B, Gundersen HJ, Price DL, 1994. Absolute number and size of pigmented locus coeruleus neurons in young and aged individuals. J. Chem. Neuroanat 7, 185–190. [DOI] [PubMed] [Google Scholar]
- Mueller SG, Weiner MW, Thal LJ, Petersen RC, Jack C, Jagust W, Trojanowski JQ, Toga AW, Beckett L, 2005. The Alzheimer’s disease neuroimaging initiative. Neuroimaging Clin. N. Am 15, 869–877 xi-xii. [DOI] [PMC free article] [PubMed] [Google Scholar]
- Nir TM, Jahanshad N, Villalon-Reina JE, Toga AW, Jack CR, Weiner MW, Thompson PM, 2013. Effectiveness of regional DTI measures in distinguishing Alzheimer’s disease, MCI, and normal aging. NeuroImage 3, 180–195. [DOI] [PMC free article] [PubMed] [Google Scholar]
- Oishi K, Faria A, Jiang H, Li X, Akhter K, Zhang J, Hsu JT, Miller MI, van Zijl PC, Albert M, Lyketsos CG, Woods R, Toga AW, Pike GB, Rosa-Neto P, Evans A, Mazziotta J, Mori S, 2009. Atlas-based whole brain white matter analysis using large deformation diffeomorphic metric mapping: application to normal elderly and Alzheimer’s disease participants. Neuroimage 46, 486–499. [DOI] [PMC free article] [PubMed] [Google Scholar]
- Olivieri P, Lagarde J, Lehericy S, Valabrègue R, Michel A, Macé P, Caillé F, Gervais P, Bottlaender M, Sarazin M, 2019. Early alteration of the locus coeruleus in phenotypic variants of Alzheimer’s disease. Ann. Clin. Transl. Neurol 6, 1345–1351. [DOI] [PMC free article] [PubMed] [Google Scholar]
- Priovoulos N, Jacobs HIL, Ivanov D, Uludağ K, Verhey FRJ, Poser BA, 2018. High-resolution in vivo imaging of human locus coeruleus by magnetization transfer MRI at 3T and 7T. Neuroimage 168, 427–436. [DOI] [PubMed] [Google Scholar]
- Qiao Y, Sun W, Shi Y, 2019. FOD-based registration for susceptibility distortion correction in brainstem connectome imaging. Neuroimage 202, 116164. [DOI] [PMC free article] [PubMed] [Google Scholar]
- Sasaki M, Shibata E, Tohyama K, Takahashi J, Otsuka K, Tsuchiya K, Takahashi S, Ehara S, Terayama Y, Sakai A, 2006. Neuromelanin magnetic resonance imaging of locus ceruleus and substantia nigra in Parkinson’s disease. Neuroreport 17, 1215–1218. [DOI] [PubMed] [Google Scholar]
- Schöll M, Lockhart Samuel N., Schonhaut Daniel R., O’Neil James P., Janabi M, Ossenkoppele R, Baker Suzanne L., Vogel Jacob W., Faria J, Schwimmer Henry D., Rabinovici Gil D., Jagust William J., 2016. PET imaging of tau deposition in the aging human brain. Neuron 89, 971–982. [DOI] [PMC free article] [PubMed] [Google Scholar]
- Sethian JA, 1996. A fast marching level set method for monotonically advancing fronts. Proc. Natl. Acad. Sci 93, 1591–1595. [DOI] [PMC free article] [PubMed] [Google Scholar]
- Shattuck DW, Leahy RM, 2002. BrainSuite: an automated cortical surface identification tool. Med. Image Anal 6, 129–142. [DOI] [PubMed] [Google Scholar]
- Shi Y, Lai R, Morra JH, Dinov I, Thompson PM, Toga AW, 2010. Robust surface reconstruction via Laplace-Beltrami eigen-projection and boundary deformation. IEEE Trans. Med. Imaging 29, 2009–2022. [DOI] [PMC free article] [PubMed] [Google Scholar]
- Shi Y, Morra JH, Thompson PM, Toga AW, 2009. Inverse-consistent surface mapping with Laplace-Beltrami eigen-features. Inf. Process. Med. Imaging 21, 467–478. [DOI] [PMC free article] [PubMed] [Google Scholar]
- Shi Y, Toga AW, 2017. Connectome imaging for mapping human brain pathways. Mol. Psychiatry 22, 1230–1240. [DOI] [PMC free article] [PubMed] [Google Scholar]
- Sotiropoulos SN, Jbabdi S, Xu J, Andersson JL, Moeller S, Auerbach EJ, Glasser MF, Hernandez M, Sapiro G, Jenkinson M, Feinberg DA, Yacoub E, Lenglet C, Van Essen DC, Ugurbil K, Behrens TE, Consortium WU-MH, 2013. Advances in diffusion MRI acquisition and processing in the Human Connectome Project. Neuroimage 80, 125–143. [DOI] [PMC free article] [PubMed] [Google Scholar]
- Takahashi J, Shibata T, Sasaki M, Kudo M, Yanezawa H, Obara S, Kudo K, Ito K, Yamashita F, Terayama Y, 2015. Detection of changes in the locus coeruleus in patients with mild cognitive impairment and Alzheimer’s disease: High-resolution fast spin-echo T1-weighted imaging. Geriatr. Gerontol. Int 15, 334–340. [DOI] [PMC free article] [PubMed] [Google Scholar]
- Takeuchi T, Duszkiewicz AJ, Sonneborn A, Spooner PA, Yamasaki M, Watanabe M, Smith CC, Fernandez G, Deisseroth K, Greene RW, Morris RG, 2016. Locus coeruleus and dopaminergic consolidation of everyday memory. Nature 537, 357–362. [DOI] [PMC free article] [PubMed] [Google Scholar]
- Tang Y, Sun W, Toga AW, Ringman JM, Shi Y, 2018. A probabilistic atlas of human brainstem pathways based on connectome imaging data. Neuroimage 169, 227–239. [DOI] [PMC free article] [PubMed] [Google Scholar]
- Taubin G, 1995. A signal processing approach to fair surface design. In: Proceedings of the 22nd Annual Conference on Computer Graphics and Interactive Techniques ACM, pp. 351–358. [Google Scholar]
- Theofilas P, Ehrenberg AJ, Dunlop S, Di Lorenzo Alho AT, Nguy A, Leite REP, Rodriguez RD, Mejia MB, Suemoto CK, Ferretti-Rebustini REDL, Polichiso L, Nascimento CF, Seeley WW, Nitrini R, Pasqualucci CA, Jacob Filho W, Rueb U, Neuhaus J, Heinsen H, Grinberg LT, 2017. Locus coeruleus volume and cell population changes during Alzheimer’s disease progression: A stereological study in human postmortem brains with potential implication for early-stage biomarker discovery. Alzheimer’s Dement 13, 236–246. [DOI] [PMC free article] [PubMed] [Google Scholar]
- Tournier JD, Calamante F, Connelly A, 2012. MRtrix: Diffusion tractography in crossing fiber regions. Int. J. Imaging Syst. Technol 22, 53–66. [Google Scholar]
- Tran G, Shi Y, 2015. Fiber orientation and compartment parameter estimation from multi-shell diffusion imaging. IEEE Trans. Med. Imaging 34, 2320–2332. [DOI] [PMC free article] [PubMed] [Google Scholar]
- Ugurbil K, Xu J, Auerbach EJ, Moeller S, Vu AT, Duarte-Carvajalino JM, Lenglet C, Wu X, Schmitter S, Van de Moortele PF, Strupp J, Sapiro G, De Martino F, Wang D, Harel N, Garwood M, Chen L, Feinberg DA, Smith SM, Miller KL, Sotiropoulos SN, Jbabdi S, Andersson JL, Behrens TE, Glasser MF, Van Essen DC, Yacoub E, Consortium WU-MH, 2013. Pushing spatial and temporal resolution for functional and diffusion MRI in the Human Connectome Project. Neuroimage 80, 80–104. [DOI] [PMC free article] [PubMed] [Google Scholar]
- Usher M, Cohen JD, Servan-Schreiber D, Rajkowski J, Aston-Jones G, 1999. The role of locus coeruleus in the regulation of cognitive performance. Science 283, 549–554. [DOI] [PubMed] [Google Scholar]
- Van Essen DC, Smith SM, Barch DM, Behrens TE, Yacoub E, Ugurbil K, Consortium WU-MH, 2013. The WU-Minn Human Connectome Project: an overview. Neuroimage 80, 62–79. [DOI] [PMC free article] [PubMed] [Google Scholar]
- Wang J, Aydogan DB, Varma R, Toga AW, Shi Y, 2018. Modeling topographic regularity in structural brain connectivity with application to tractogram filtering. Neuroimage 183, 87–98. [DOI] [PMC free article] [PubMed] [Google Scholar]
- Wolk DA, Das SR, Mueller SG, Weiner MW, Yushkevich PA, 2017. Medial temporal lobe subregional morphometry using high resolution MRI in Alzheimer’s disease. Neurobiol. Aging 49, 204–213. [DOI] [PMC free article] [PubMed] [Google Scholar]
- Zhang S, Hu S, Chao HH, Li CR, 2015. Resting-state functional connectivity of the locus coeruleus in humans: in comparison with the ventral tegmental area/substantia nigra pars compacta and the effects of age. Cereb. Cortex [DOI] [PMC free article] [PubMed] [Google Scholar]
Associated Data
This section collects any data citations, data availability statements, or supplementary materials included in this article.