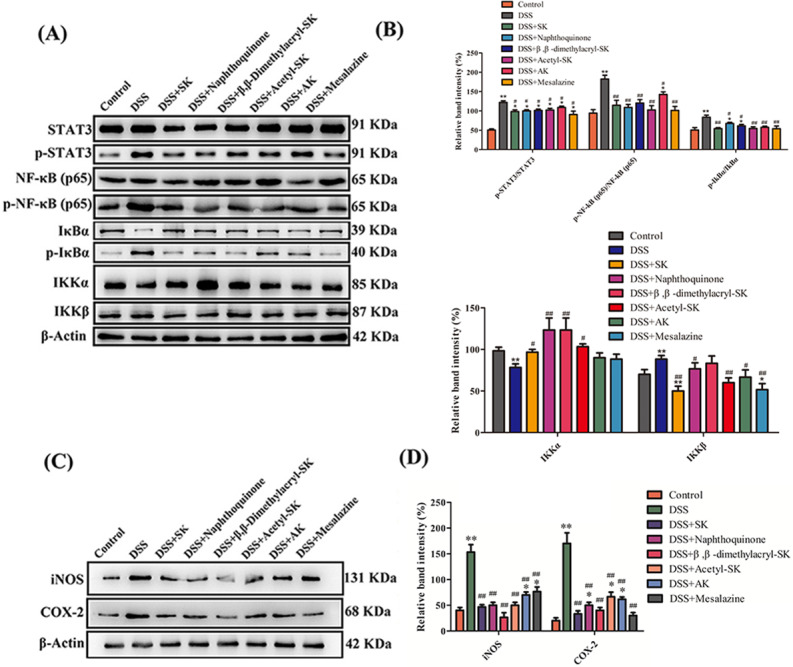
Figure 8. SK andits derivatives modulated COX-2, iNOS expression, and NF-κB signal pathway in UCmice.

(A) Western blot analysis of COX-2 and iNOS levels in colonic tissues in each group. Data shown are representative of three independent experiments. (B) Relative protein expression ratios of COX-2 and iNOS were determined by densitometry. (C) Western blot analysis of proteins expression level of NF-κB signal pathway. (D) Relative protein expression ratio was determined by densitometry. Each point represents the mean ± S.E.M. from three replicates (*p < 0.05, **p < 0.01 versus control group; # p < 0.05, ## p < 0.01 versus DSS-treated group).
