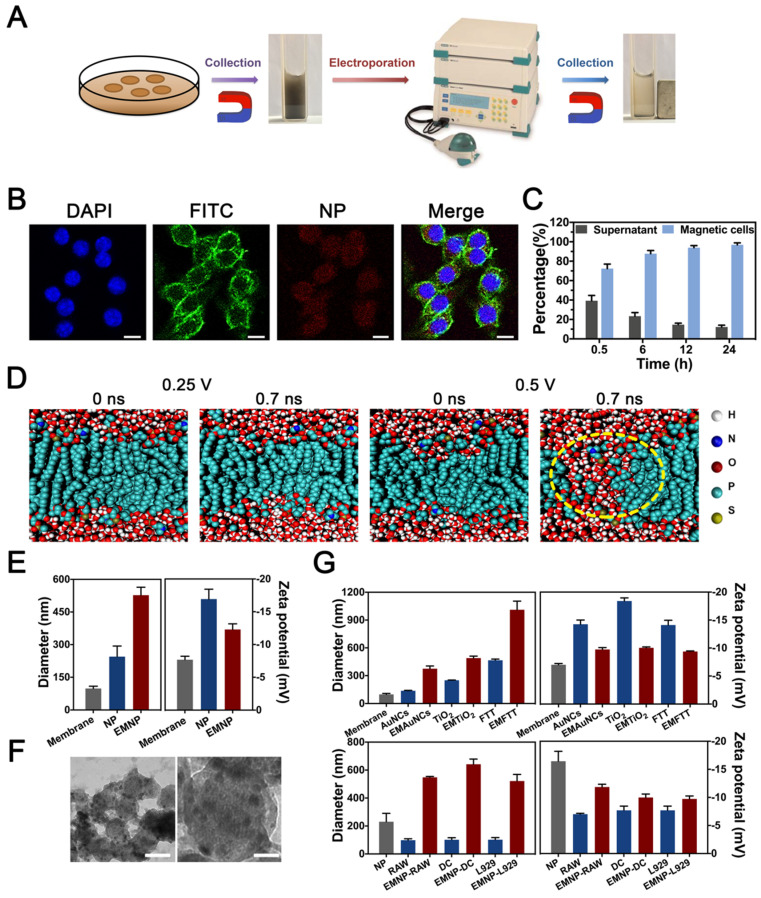
Figure 1.
Electroporation-facilitated synthesis and characterization of membrane-coated nanoparticles. (A) Synthesis procedures diagram. (B) Fluorescence confocal microscopy image of the NPs' internalization. Blue, green and red fluorescence represented nucleus (DAPI), cytoskeleton (phalloidin) and fluorescence NPs (Rhodamine) (scale bar = 10 μm). (C) Ratio of the RAW 264.7 cells swallowed the NP during different time (0.5 h, 6 h, 12 h, 24 h). (D) Molecular dynamic simulation of DOPC biolayer under electric field of 0.25 V nm-1 or 0.5 V nm-1. Waters were shown as red and withe balls. DOPC were colored cyan balls. The yellow dotted line showed the defect of membrane structure. (E) Mean diameters and zeta potentials of NPs and EMNPs. (F) TEM images of EMNPs. (left scale bar = 100 nm, right scale bar = 20 nm). (G) Diameters and zeta potentials of obtained EMNPs from varies cells or NPs.

