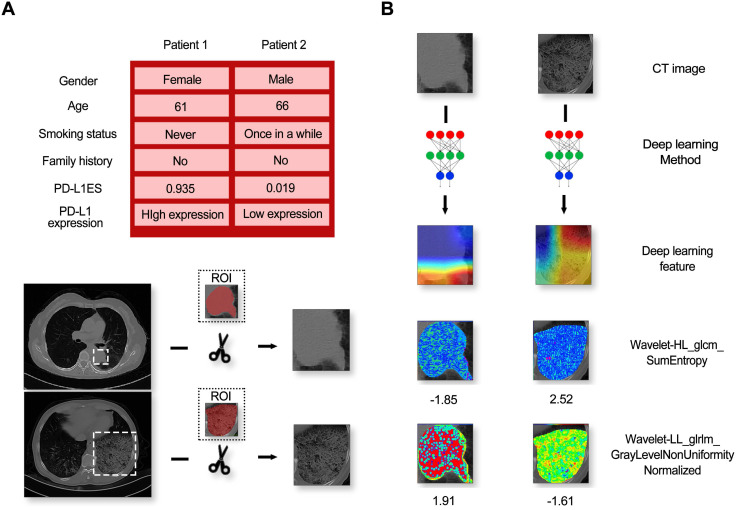
Figure 5.
The information of patients and model feature visualization. (A) Contained a random sample of a high-expression patient and a low-expression patient and their corresponding CT images. (B) Indicated the visual images of the imaging features (including deep learning features and typical radiomic features).

