

Summary
Mitochondria play pivotal roles in cellular energy metabolism. Most of the intracellular adenosine triphosphate (ATP) is generated by mitochondrial respiration. The Cell Mito Stress Test is a common method to measure the key parameters of mitochondrial respiration. Here, we use the human cell line HK-2 as an example to present the procedures to quantify the oxygen consumption rate using a Seahorse XFe96 extracellular flux analyzer.
For complete details on the use and execution of this protocol, please refer to Ma et al. (2020).
Subject areas: Cell Biology, Cell culture, Cell-based Assays, Metabolism, Molecular Biology
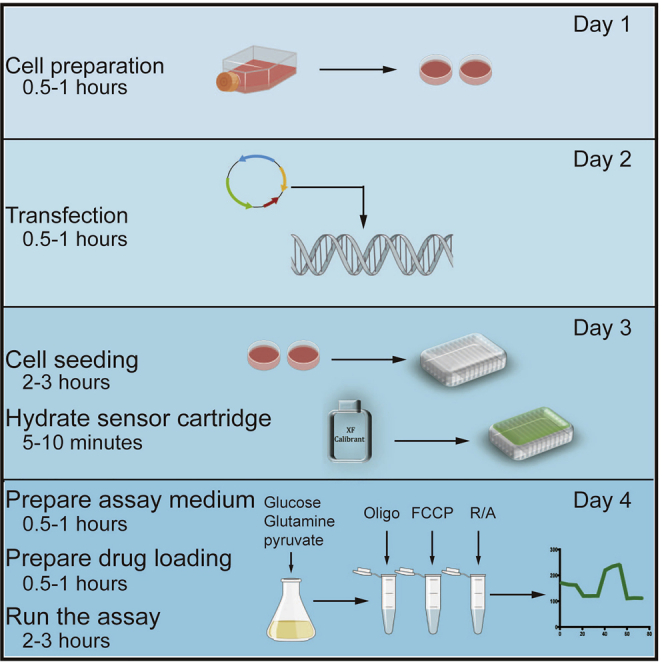
Graphical Abstract
Highlights
-
•
Seahorse XF96 Cell Mito Stress Test protocol to measure mitochondrial respiration
-
•
Highlights the critical steps to be considered during the experiment
-
•
Lists the limitations and problems with the Seahorse XF96 Cell Mito Stress Test
Mitochondria play pivotal roles in cellular energy metabolism. Most of the intracellular adenosine triphosphate (ATP) is generated by mitochondrial respiration. The Cell Mito Stress Test is a common method to measure the key parameters of mitochondrial respiration. Here, we use the human cell line HK-2 as an example to present the procedures to quantify the oxygen consumption rate using a Seahorse XFe96 extracellular flux analyzer.
Before you begin
Timing: 0.5–2 h
-
1.
For running the assay, the cell culture medium should be replaced with assay medium. Therefore, make sure that there are sufficient and fresh reagents before you begin, especially the 100 mM Pyruvate Solution and 200 mM Glutamine Solution, which are needed to be added to the XF base medium for assay medium preparation.
-
2.
Observe the morphology or growth changes of your cells under an inverted microscope. HK-2 cells are anchorage dependent. They should not be allowed to become confluent, therefore, make sure that the cells are in a monolayer configuration and at 80% of confluence.
Note: The assay medium should be prepared and used only on the assay day. If other media are used, it must not contain sodium bicarbonate because otherwise it will buffer the media and pH measurements will not be accurate.
Note: HK-2 cells are cultured in DMEM medium supplemented with 10% fetal bovine serum, 1% penicillin-streptomycin, but any other appropriate growth medium can be used as well.
Note: The HK-2 cell line should not be passaged for more than 50 times.
Note: All the reagents and equipment that contact with cells must be sterile. A strict aseptic technique should be performed for all the procedures.
Key resources table
| REAGENT or RESOURCE | SOURCE | IDENTIFIER |
|---|---|---|
| Chemicals, peptides, and recombinant proteins | ||
| XF calibrant solution | Agilent Technologies | Cat#100840-000 |
| XF DMEM medium | Agilent Technologies | Cat#103575-100 |
| D-Glucose anhydrous | Solarbio | Cat#G8150 |
| 100 mM pyruvate solution | Agilent Technologies | Cat#103578-100 |
| 200 mM glutamine solution | Agilent Technologies | Cat#103579-100 |
| Dulbecco's modified Eagle's medium (DMEM) | Thermo Fisher Scientific | Cat#11885084 |
| Opti-MEM I reduced serum medium | Thermo Fisher Scientific | Cat# 31985070 |
| Fetal bovine serum | Thermo Fisher Scientific | Cat#10099 |
| Penicillin-streptomycin | Thermo Fisher Scientific | Cat#15140-122 |
| Critical commercial assays | ||
| Seahorse XF Cell Mito Stress Test Kit | Agilent Technologies | Cat#103015-100 |
| Seahorse XF96 Cell Culture Microplate | Agilent Technologies | Cat#101085-004 |
| Seahorse XFe96 Extracellular Flux Assay Kits | Agilent Technologies | Cat#102601-100 |
| Lipofectamine 3000 transfection reagent | Thermo Fisher Scientific | Cat# L3000015 |
| Experimental models: cell lines | ||
| Human: HK-2 cells | ATCC | Cat# CRL-2190, RRID: CVCL_0302 |
| Recombinant DNA | ||
| Plasmid: SQSTM1/p62 shRNA | Genomeditech | n/a |
| Control plasmid: pcDNA 3.1(+) | Genomeditech | n/a |
| Software and algorithms | ||
| Seahorse Wave | This paper; Agilent Technologies | https://www.agilent.com/zh-cn/product/cell-analysis/real-time-cell-metabolic-analysis/xf-software/seahorse-wave-desktop-software-740897 |
| Other | ||
| Sterile plastic material | Corning | n/a |
| Water bath | n/a | n/a |
| Multichannel pipettors for 20–200 μL | n/a | n/a |
| Sterile 6-well plate | Corning | Cat#3516 |
| Seahorse XFe96 extracellular flux analyzer | Seahorse Biosciences | n/a |
| Non-CO2, 37°C incubator | Seahorse Biosciences | n/a |
| Calibrated pH meter | n/a | n/a |
| Cell counter | n/a | n/a |
| Sterile filter bottles (0.22 μm filter) | n/a | n/a |
| Distilled H2O | n/a | n/a |
Materials and equipment
Note: The Cell Mito Stress Test Kit contains oligomycin, carbonyl cyanide-4-(trifluoromethoxy)phenylhydrazone (FCCP) and rotenone/antimycin A. The injection of oligomycin, which, by inhibiting ATP synthase, could rapidly hyperpolarize the mitochondrial membrane, thereby preventing protons passing through the complexes. FCCP, as an uncoupling agent of oxidative phosphorylation, could reverse the hyperpolarized state caused by oligomycin through carrying the protons across the mitochondrial inner membrane. Finally, the injection of R/A could inhibit mitochondrial complexes I and III completely stopping the mitochondrial respiration. They are useful in step 8 of Day of the assay: day 4.
Alternatives: In this protocol, the recombinant DNA is transfected into HK-2 cells with liposome transfection reagents Lipofectamine 3000 for transient expression, but any other reagents, like Lipofectamine 2000, or methods could be used to transfect the recombinant DNA.
1 M NaOH (optional)
| Reagent | Final concentration | Add to 50 mL |
|---|---|---|
| NaOH | 1 M | 2 g |
CRITICAL: Sodium hydroxide (NaOH), also known as lye or caustic soda, can readily decompose proteins and lipids in living tissues, which will cause chemical burns of the skin and may induce blindness upon contact with eyes. Thus, protective measures, like rubber gloves and eye protection, are recommended when handling this chemical or its solutions.
Alternatives: We recommend using 1 M NaOH, but any other appropriate concentration NaOH can be used as well. In heavy concentrations, it is unfavorable for the adjustment of pH level of the Seahorse assay medium.
Step-by-step method details
Transfection of HK-2 cells: day 1 and day 2
Cells are seeded in a sterile 6-well plate and transfect with SQSTM1/p62 overexpression plasmid and its control plasmid pcDNA3.1 (+).
-
1.
Day 1: Plate 5 × 10⁴ HK-2 cells in a sterile 6-well plate with 2 mL of growth medium (DMEM medium supplemented with 10% fetal bovine serum) without antibiotics so that cells will be approximately 60%–80% confluency at the time of transfection.
-
2.Day 2: For each transfection samples, prepare complexes as follows:
-
a.Dilute 3.75 μL Lipofectamine 3000 with 125 μL Opti-MEM and mix gently.
-
b.Dilute 2500 ng DNA in 125 μL of Opti-MEM without serum, then add 5 μL p3000 to it and mix gently.
-
c.Combine the diluted Lipofectamine 3000 with diluted DNA and mix gently. Incubate for 5 min at 20°C–25°C. After 5 min incubation, add the complexes to each well containing cells and medium. Incubate cells in a cell culture incubator with a humidified atmosphere of 5% CO2 at 37°C for 24 h.
-
a.
Note: For complete details of SQSTM1/p62 overexpression plasmid, please refer to our previous work (Ma et al., 2020). Compared with control plasmid, transfected with SQSTM1/p62 overexpression plasmid will increase the mitochondrial OXPHOS, which results in the increases of basal and maximal respiratory capacity, spare respiratory capacity, and ATP-linked OCR.
Note: It is not necessary to change the medium after transfection, but medium may be replaced after 24 h.
Seeding cells and hydrating sensory cartridge: day 3
Seed the treated cells in the Seahorse XF96 Cell Culture Microplate, hydrate the XF extracellular flux sensory cartridge and turn on the Seahorse instrument (Figure 1).
-
3.Cell seeding
-
a.Harvest and plate 6 × 10³ HK-2 cells in 100 μL growth medium (DMEM medium supplemented with 10% fetal bovine serum, 1% penicillin and streptomycin) per well (Figure 2A), except four background temperature correction wells (A1, A12, H1, and H12) (Figure 3), which should be blanked with 100 μL of growth medium.
-
b.Allow the plate to rest at 20°C–25°C in the tissue culture hood for 1 h. This can promote cell to distribute even and reduce edge effects for cells. Then, incubate the cells for 12–18 h in a cell culture incubator.
-
a.
Note: Optimal cell seeding density varies by cell type, but is typically between 5 × 10³ and 4 × 10⁴ cells per well for adherent cells. Generally, cell confluence between 80% and 90% will generate metabolic rates in the desirable range of the instrument.
Note: You must ensure your background wells do not contain cells.
Note: The key factors in cell seeding for accurate measurement are that the cells should be plated as uniform as possible and the plate must rest at 20°C–25°C in tissue culture hood for 1 h to minimize the edge effect (Lundholt et al., 2003).
Note: Put the pipette tip on the edge of the lower well but not contact with the bottom of the well when seeding the cells. Do not resuspend the cells after seeding them in the XF96 Cell Culture Microplate.
-
4.Hydrate sensory cartridge
-
a.Separate the utility plate and sensory cartridge, and place the sensory cartridge upside down on the bench side to the utility plate (Figure 4).
-
b.Fill each well of the utility plate with 200 μL Seahorse XF Calibrant, then lower the sensory cartridge back onto the utility plate gently and avoid creating air bubbles.
-
c.Incubate the sensory cartridge in a non-CO2, 37°C incubator for 12–18 h. Make sure the environment of the incubator is humidified.
-
a.
Note: Be careful not to contact of the sensory cartridge and ensure submerging the sensors in the calibration.
-
5.
Power on the Seahorse XFe96 Analyzer, non-CO2, 37°C incubator and computer, then open the “Wave” software (Figure 1) and click the “Heater on.”
Note: Observe whether the temperature in the software is rising to 37°C. When the icon in the lower-left corner of the “connected” turns green indicating that the instrument connection status is normal (Figure 2B). The Seahorse instruments must turn on at least 5 h prior to run the assay.
Figure 1.

Overview of the Seahorse XFe96 instrument
From left to right: non-CO2 incubator, Seahorse XFe96 analyzer, and combination computer.
Figure 2.

Experimental operation in a well of a microplate and the interface connecting the Seahorse XFe96 extracellular flux analyzer to the computer
(A) Cell seeding and liquid aspiration handling in a well of the Seahorse XF96 cell culture microplate.
(B) In the lower-left corner of the Wave Controller software, you can verify the instrument connection status.
Figure 3.

Four background correction wells in the Seahorse XF96 cell culture microplate (A1, A12, H1, H12)
Be sure that background correction wells contain medium only (no cells).
Figure 4.

Cartridge lid, sensory cartridge, and utility plate
Place sensory cartridge upside down on the bench and avoid contact with the sensors.
Day of the assay: day 4
Prepare the Seahorse assay medium, cells, and XF Cell Stress Test Compounds for running the assay.
-
6.Prepare the Seahorse assay medium.
-
a.Turn on the water bath and warm to 37°C.
-
b.Add 1 mL 100mM pyruvate solution, 1 mL 200 mM glutamine solution and 0.1 g D-glucose in 98 mL XF base medium. Filtrate the assay medium with 0.22 μm filter.
Reagent Final concentration Amount 100 mM pyruvate solution 1 mM 1 mL 200 mM glutamine solution 2 mM 1 mL D-Glucose 1 g/L 0.1 g XF base medium – 98 mL -
c.Warm the assay medium to 37°C and adjust to pH 7.4 with 1 M NaOH.Note: The assay medium must be prepared when it will be used and keep 37°C prior to use. Do not prepare too much assay medium, 100 mL is sufficient for one XF96 Cell Culture Microplate.
-
a.
-
7.Wash cells
-
a.Retrieve the XF96 Cell Culture Microplate from the cell incubator.
-
b.Remove cell growth medium with 20 μL remaining and replace with 180 μL of assay medium, repeat 3 times.
-
c.The last time, aspirate 180 μL of assay medium and replace with 160 μL of assay medium.
-
d.To de-gas, incubate the XF96 Cell Culture Microplate in a 37°C incubator without CO2 for 1 h.
-
a.
Note: The cells must be incubated in a 37°C incubator without CO2 for 1 h to de-gas prior to replacing the XF96 Cell Culture Microplate on the tray.
-
8.Prepare and load XF Cell Stress Test Compounds
-
a.Suspend the compounds with assay medium according to Table 1.
-
b.Dilute the stock solutions of and Oligomycin, FCCP and Rotenone/antimycin A according to Table 2, then load 20 μL of 2 μM oligomycin in port A, 22 μL of 1 μM FCCP in port B and 25 μL of 0.5 μM Rotenone/antimycin A in port C of the hydrated sensory cartridge.
-
a.
Note: The compounds must be prepared and loaded 20 min prior to the assay.
Note: The recommended concentration of Oligomycin and Rotenone/antimycin A can meet most cell types. The maximum respiratory rate is caused by injection of uncoupler FCCP, so if OCR is not increased following the FCCP injection, you should perform a careful titration of FCCP to optimized the appropriate concentration.
-
9.Run assay
-
a.Select XF Cell Mito Stress Test on the Templates window and set up the program as follows:
-
b.At the Plate map page, click “add group” and select corresponding wells to edit the information of your group.
-
c.At the Protocol page, the parameters are as follows: baseline, 3 cycles; inject port A (oligomycin), 3 cycles; inject port B (FCCP), 3 cycles; inject port C (Rotenone/antimycin A), 3 cycles. Each cycle is composed of mix 3 min, wait 0 min, and measure 3 min (Figure 5).
-
d.At the Run Assay page, select “Start Run” and choose a location to save your assay result file. The tray will auto-eject and put the sensory cartridge on it, the instrument will initiate the calibration of the sensory cartridge. Time to complete calibration is approximately 20 min.
-
e.When the calibration is over, click “open the tray,” remove the utility plate and replace the XF96 Cell Culture Microplate on the tray with the correct direction as labeled on corner of the plate, which should be located at the lower-left corner of the tray, then load the tray.
-
a.
Note: The default XF Cell Mito Stress Test protocol does not require modifications. The total time of OCR measurements is 1 h 24 min. If the readings are very slow the cells will have reduced viability which will affect the results.
-
10.Data Analysis
-
a.Remove the cell plate and the sensory cartridges when the run is completed.
-
b.Insert a USB drive and export the results.
-
c.Results will be automatically generated and analysis by the wave software, which can export your data as an Excel or Prism file. (https://www.agilent.com/zh-cn/product/cell-analysis/real-time-cell-metabolic-analysis/xf-software/seahorse-wave-desktop-software-740897).
-
a.
Note: Desirable range of starting OCR should be between 20 and 160 pmol/O2 /min.
Table 1.
Stock solutions of oligomycin, FCCP (carbonyl cyanide 4-(trifluoromethoxy) phenylhydrazone) and rotenone/antimycin A
| Compound | Volume of assay medium | Stock concentration |
|---|---|---|
| Oligomycin | 630 μL | 100 μM |
| FCCP | 720 μL | 100 μM |
| Rotenone/antimycin A | 540 μL | 50 μM |
Table 2.
Working concentration of oligomycin, FCCP, and rotenone/antimycin A
| Compound | Final concentration in well (μM) | Stock volume (μL) | Assay medium volume (μL) | Add to port (μL) |
|---|---|---|---|---|
| Oligomycin | 2.0 | 600 | 2,400 | 20 |
| FCCP | 1.0 | 300 | 2,700 | 22 |
| Rotenone/antimycin A | 0.5 | 300 | 2,700 | 25 |
Figure 5.

The interface of a typical running protocol and experimental parameters
Expected outcomes
Though different cell types exhibit different metabolic characteristics, a desirable Seahorse Cell Mito Stress Test will show a few same hallmarks. The result shows the Oxygen Consumption Rate (OCR) data in rate mode (Figure 6). It begins with measuring the base level of OCR, as the complex III inhibitor oligomycin injects, the OCR is rapidly decreased. This will be reversed by the injection of FCCP, an uncoupling agent that can dissipate the proton gradient and maximize the OCR. Finally, followed by the injection of Rotenone/antimycin A, the OCR decreases again. Parameters calculated in the form of bar chart include ATP-linked respiration, proton leak, basal respiration, maximal respiration, and spare respiratory capacity.
Figure 6.

Seahorse XF96 Mito stress test analysis
Using the optimal cell seeding density (0.6 × 10⁴ cell per well). The data are presented as means ± SEM. Injection series: (A) oligomycin (2 μM); (B) FCCP (1 μM); (C) rotenone and antimycin A (0.5 μM).
Basal respiration (Figure 6) shows the energetic demand of cells under basal conditions, the oxygen consumption of basal respiration used to meet ATP synthesis and result in mitochondrial proton leak. ATP-linked respiration (Figure 6) is reflected by the decrease in OCR following the injection of the ATP synthase inhibitor oligomycin, which is the portion of basal respiration. The remaining basal respiration not coupled to ATP synthesis after oligomycin injection represents the proton leak (Figure 6), which can be a sign of mitochondrial damage. Maximal respiration (Figure 6) represents the maximum capacity that the electron respiratory chain can achieve. The maximal oxygen consumption rate is measured by injection of the uncoupler FCCP. Spare respiration (Figure 6) is the difference between maximal and basal respiration, which reflects the capability of the cells to respond to changes in energetic demand and indicates the fitness of the cells. Non-mitochondrial respiration is the oxygen consumption due to cellular enzymes other than mitochondria after injection of rotenone and antimycin A.
Here, we show an example of cells treated with SQSTM1/p62 overexpression plasmids which induces changes of mitochondrial respiration (Figure 7). Figure 7A is the rate data, which is the primary output of the Seahorse XFe96 analyzer showing a quantitative measurement of oxygen consumption of cellular respiration over time. The bar chart in Figure 7B is a way to present the key parameters of mitochondrial function by analyzing and calculating as described in a previous paragraph. Compared with transfected with control plasmids pcDNA 3.1(+), transfected with SQSTM1/p62 overexpression plasmids results in the increases of basal and maximal respiratory capacity, spare respiratory capacity, and ATP-linked OCR, which suggests SQSTM1/p62 could affect mitochondrial respiration.
Figure 7.

Mitochondrial respiration function parameters of HK-2 cells transfected with p62 overexpression plasmid and its control plasmid pcDNA3.1(+) using the Seahorse XFe96 extracellular flux analyzer
(A) The result shows the oxygen consumption rate (OCR) changes in rate mode after transfected with plasmids in HK-2 cells.
(B) Bar chart showing the results of mitochondrial respiration changes in transfected HK2 cells, which were analyzed with basal respiration, ATP production, maximal respiration, and spare respiratory capacity. One-way ANOVA followed by Sidak’s multiple comparisons test, n = 4 biological replicates, ∗p < 0.05, ∗∗p < 0.01, ∗∗∗p< 0.001.
Figure 7 reprinted with permission from Ma et al. (2020).
Limitations
The Cell Mito Stress Test is a common assay to measure the oxygen consumption rate (OCR) of live cells for the evaluation of mitochondrial respiration function by using Seahorse XFe96 extracellular flux analyzer. Though the measurement requires only a small number of cells (Gonzalez-Ortiz et al., 2019; van der Windt et al., 2016), it still has limitations. First, compared to the Clark-Type Oxygen Electrode, the Cell Mito Stress Test cannot measure the OCR of tissues (Divakaruni et al., 2014), but it can measure respiration in isolated mitochondria from tissues (Long et al., 2016). In addition, this protocol is strict with cell operations. Accurate cell counting is important for lowering variability between groups. Optimal cell density to ensure cells are uniformly and evenly seeded in a monolayer configuration (Lange et al., 2012). If there are cells clusters, it may cause poor cell adhesion and inaccurate measurement of OCR (Luz et al., 2015).
The Seahorse XFe96 extracellular flux analyzer can automatically inject the drugs through air pressure (Wettmarshausen and Perocchi, 2019), however, the main restriction is that mitochondria cannot directly accessible to the full dose of drugs in intact cells, which might be impermeable to the mitochondrial complex inhibitors. Therefore, it needs to be taken into account the permeability of cell membrane and the complexity of cytoplasmic metabolism when assessing the mitochondrial respiration in intact cells. Nevertheless, compared with the organism, the intact cells still lack in vivo context. This technique needs to add some substrate like medium, pyruvate, glutamine, and glucose, which may affect the outcome of the measurement (Brand and Nicholls, 2011; Hill et al., 2012).
Troubleshooting
Problem 1
Poor basal signal (step 10)
Potential solution
Poor basal signal could be caused by insufficient cell number and you can increase the number of cells (step 3). Another reason for poor basal signal may be incubate the cell microplate in a non-CO2, 37°C incubator too long (step 7d). This will decrease the viability of cells. Make sure the time for incubating the cell plate in a non-CO2, 37°C incubator is at least 30 min but no more than 1 h.
Problem 2
Minimal or unexpected changes in OCR after compounds injection (step 10)
Potential solution
When the changes in OCR is minimal in a certain well, it may be because there is no drug injected to the port of the sensory cartridge, to make sure all the ports are filled with drugs after injection (after step 8). If the changes in OCR are minimal in most wells, this may be caused by the low concentration of the drugs or the poor condition of cells. View the cells under microscope before run the assay to make sure that the cells are healthy, uniform, and in a monolayer configuration. Titration of drugs’ concentration when the cells are healthy.
Problem 3
High variability between replicates (steps 3 and 4)
Potential solution
The major cause of variation might be uneven cell numbers or the sensors does not work properly.
Therefore, it is important to make sure the same volume of cells is seeded in each well of the replicates. Meanwhile, make sure all the sensors are submerged in the XF Calibrant and hydrated in the non-CO2, 37°C incubator for 12–18 h. Make sure to use sensory cartridges and cell microplate before the expiration date.
Problem 4
Variability between wells (step 3)
Potential solution
Cells need to culture in incubator with a humidified atmosphere of 5% CO2 at 37°C for 12–18 h prior to an XF assay. Because of interventions introduced to the cells, including genetic modifications and compound treatments, the cell number might be changed during the culture. This need to be taken into account before seeding cells. One method is to test the doubling time of cells, thus choosing the optimal number of cells in different groups. Another method is to use the CyQuant cell proliferation assay (Wettmarshausen and Perocchi, 2019).
Resource availability
Lead contact
Further information and requests for resources and reagents should be directed to and will be fulfilled by the Lead Contact, Qiang Wan (wanqiang@sdu.edu.cn).
Materials availability
This study did not generate new unique reagents.
Data and code availability
Original data for figures in the paper are available upon request.
Acknowledgments
This work was supported by the National Natural Science Foundation of China (NSFC) (grant nos. 81770729, 91749111, 82070756) and Shandong Province Taishan Scholar Project (grant no. tsqn20161073).
Author contributions
Investigation, Y.M.; writing – original draft, X.G.; writing – review & editing, Y.L.; funding acquisition and supervision, Q.W.
Declaration of interests
The authors declare no competing interests.
References
- Brand M.D., Nicholls D.G. Assessing mitochondrial dysfunction in cells. Biochem. J. 2011;435:297–312. doi: 10.1042/BJ20110162. [DOI] [PMC free article] [PubMed] [Google Scholar]
- Divakaruni A.S., Rogers G.W., Murphy A.N. Measuring mitochondrial function in permeabilized cells using the Seahorse XF analyzer or a Clark-type oxygen electrode. Curr. Protoc. Toxicol. 2014;60:25.2.1–25.2.16. doi: 10.1002/0471140856.tx2502s60. [DOI] [PubMed] [Google Scholar]
- Gonzalez-Ortiz L.M., Sánchez-Villamil J.P., Celis-Rodríguez M.A., Lineros G., Sanabria-Barrera S., Serrano N.C., Rincon M.Y., Bautista-Nino P.K. Measuring mitochondrial respiration in adherent cells infected with Trypanosoma cruzi Chagas, 1909 using Seahorse extracellular flux analyser. Folia Parasitol. (Praha) 2019;66:2019.016. doi: 10.14411/fp.2019.016. [DOI] [PubMed] [Google Scholar]
- Hill B.G., Benavides G.A., Lancaster J.R., Jr., Ballinger S., Dell'Italia L., Jianhua Z., Darley-Usmar V.M. Integration of cellular bioenergetics with mitochondrial quality control and autophagy. Biol. Chem. 2012;393:1485–1512. doi: 10.1515/hsz-2012-0198. [DOI] [PMC free article] [PubMed] [Google Scholar]
- Lange M., Zeng Y., Knight A., Windebank A., Trushina E. Comprehensive method for culturing embryonic dorsal root ganglion neurons for Seahorse extracellular flux XF24 analysis. Front. Neurol. 2012;3:175. doi: 10.3389/fneur.2012.00175. [DOI] [PMC free article] [PubMed] [Google Scholar]
- Long J.Z., Svensson K.J., Bateman L.A., Lin H., Kamenecka T., Lokurkar I.A., Lou J., Rao R.R., Chang M.R., Jedrychowski M.P. The secreted enzyme PM20D1 regulates lipidated amino acid uncouplers of mitochondria. Cell. 2016;166:424–435. doi: 10.1016/j.cell.2016.05.071. [DOI] [PMC free article] [PubMed] [Google Scholar]
- Lundholt B.K., Scudder K.M., Pagliaro L. A simple technique for reducing edge effect in cell-based assays. J. Biomol. Screen. 2003;8:566–570. doi: 10.1177/1087057103256465. [DOI] [PubMed] [Google Scholar]
- Luz A.L., Smith L.L., Rooney J.P., Meyer J.N. Seahorse Xfe 24 extracellular flux analyzer-based analysis of cellular respiration in Caenorhabditis elegans. Curr. Protoc. Toxicol. 2015;66:25.7.1–25.7.15. doi: 10.1002/0471140856.tx2507s66. [DOI] [PMC free article] [PubMed] [Google Scholar]
- Ma Y., Zhu S., Lv T., Gu X., Feng H., Zhen J., Xin W., Wan Q. SQSTM1/p62 controls mtDNA expression and participates in mitochondrial energetic adaption via MRPL12. iScience. 2020;23:101428. doi: 10.1016/j.isci.2020.101428. [DOI] [PMC free article] [PubMed] [Google Scholar]
- van der Windt G.J.W., Chang C.-H., Pearce E.L. Measuring bioenergetics in T cells using a Seahorse Extracellular Flux Analyzer. Curr. Protoc. Immunol. 2016;113:3.16B.1–3.16B.14. doi: 10.1002/0471142735.im0316bs113. [DOI] [PMC free article] [PubMed] [Google Scholar]
- Wettmarshausen J., Perocchi F. Assessing calcium-stimulated mitochondrial bioenergetics using the Seahorse XF96 analyzer. Methods Mol. Biol. 2019;1925:197–222. doi: 10.1007/978-1-4939-9018-4_18. [DOI] [PubMed] [Google Scholar]
Associated Data
This section collects any data citations, data availability statements, or supplementary materials included in this article.
Data Availability Statement
Original data for figures in the paper are available upon request.