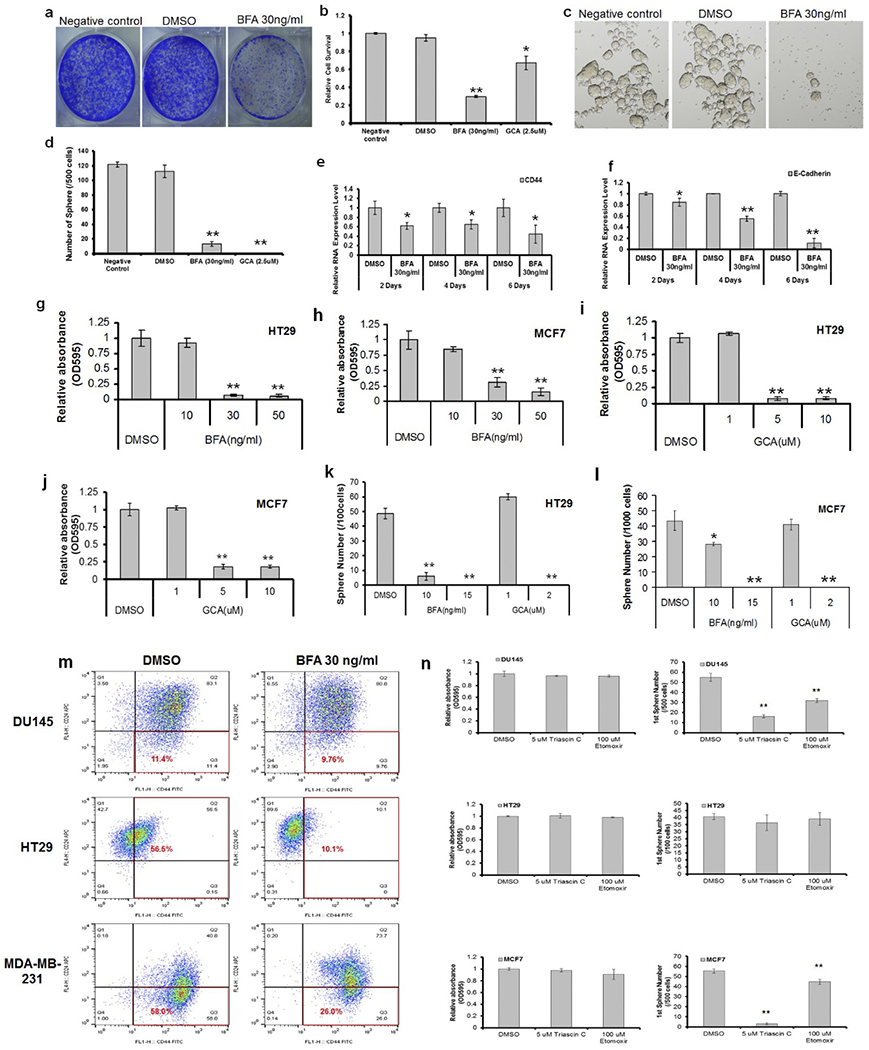
Extended Data Figure 10 |. Arf1 and FAO inhibitors suppress CSCs in human cancer cell lines.

(a–f) Arft inhibitors suppress proliferation and sphere formation in DU145 cells. a, b, Crystal violet staining was used to detect cell survival after 2 days of treatment with BFA or GCA at the indicated concentrations in DU145 cells. The growth of DU145 cells was strongly inhibited by 30 ng ml−1 BFA (a, b) and 2.5 μM GCA (b). We also tested the two inhibitors in tumour sphere formation by cancer cells, a widely used in vitro technique for assessing CSC self-renewal capacity56. Spheres were cultured with or without BFA or GCA. The two inhibitors also inhibited tumour sphere formation (c, d). GCA was a weak inhibitor of growth (b), but a strong inhibitor of tumour sphere formation (d) in DU145 cells, indicating that these inhibitors may specifically target CSCs. The mRNA level of CD44 and E-Cadherin, two potent prostate cancer tumour-initiating cell markers, were reduced by BFA treatment (e, f). Data show the mean ± s.e.m. Statistical significance was determined by Student’s t-test, *P < 0.05; **P < 0.01 (compared to DMSO). g–l, Arf1 inhibitors suppress proliferation and sphere formation in HT29 and MCF7 cells. Crystal violet staining was used to detect cell survival after 2 days of treatment with BFA or GCA at the indicated concentrations in HT29 and MCF7 cells. The inhibitors reduced the cell survival rate (g–j). Spheres were cultured with or without BFA or GCA. The inhibitors inhibited sphere formation dramatically (k, l). Data show the mean ± s.e.m. Statistical significance was determined by Student’s t-test, * P < 0.05; **P < 0.01 (compared to DMSO). (m, n) BFA and FAO inhibitors reduce CSC in DU145, HT29, MCF7 and MDA-MB-231 cells. m, Flow cytometry was used to detect cancer stem cell surface makers in DU145, HT29 and MDA-MB-231 cells after 2 days of treatment with BFA. Cell subpopulations enriched with cancer stem cells (CD44+ and CD24− for DU145 and MDA-MB-231, CD44+ for HT29) were marked with red line. n, Crystal violet staining was used to detect cell survival after 2 days of treatment with triascin C or etomoxir using indicated concentrations in DU145, HT29 and MCF7 cells (left). Spheres were cultured with or without triascin C or etomoxir. The inhibitors markedly inhibited sphere formation in DU145 and MCF7 cells (right). Data show the mean ± s.e.m. Statistical significance was determined by Student’s t-test, **, P < 0.01 (compared to DMSO).
