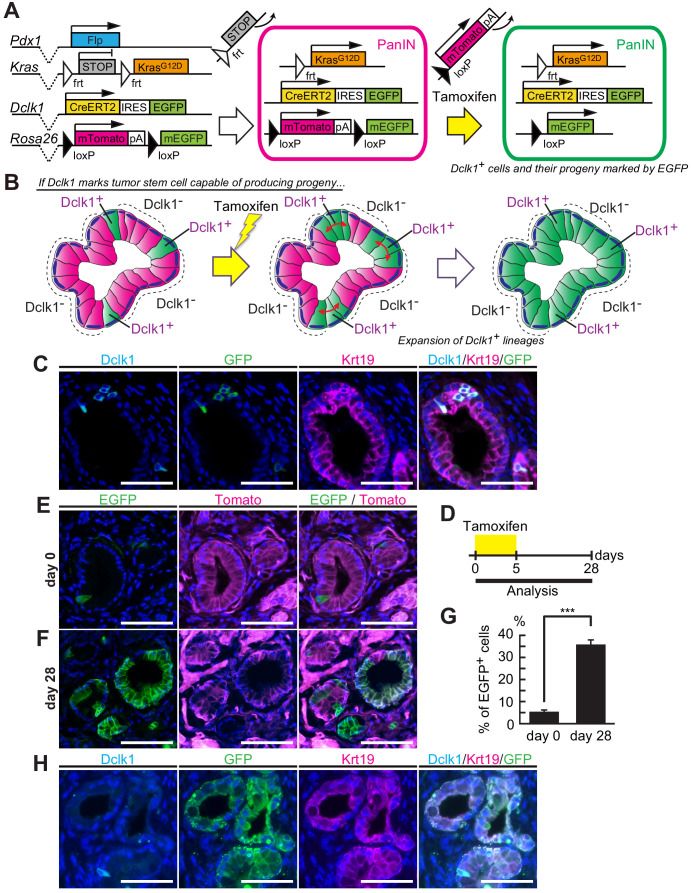
Figure 2. Dclk1+ PanIN cells supply descendant PanIN cells.
(A) The scheme of Dclk1CreERT2-IRES-EGFP/+; Rosa26mTmG/+; Pdx1-Flp; KrasFSF-G12D/+ (DRKF) mouse constructs, flippase-mediated Kras activation, and CreERT2-driven reporter recombination. (B) The scheme of lineage tracing of Dclk1+ cells in established PanINs. Before tamoxifen administration, there were a small subset of Dclk1+/EGFP+ cells (left panel). After tamoxifen administration, if Dclk1+ cells are stem cells, EGFP+ progeny cells expand in the PanINs (middle and right panels). (C) Immunofluorescence staining for Dclk1 (cyan), GFP (green), Krt19 (magenta), and Hoechst (blue) of PanINs developed in DRKF mice before tamoxifen administration. Scale bars, 50 µm. (D) Experimental strategy of Cre-mediated lineage tracing in PanINs developed in 3-month-old DRKF mice. (E and F) Representative fluorescence microscopy images for EGFP encoded in Dclk1CreERT2-IRES-EGFP knock-in allele (green), Tomato (magenta), and Hoechst (blue) in sections of PanINs developed in DRKF mice. (E) Before tamoxifen injection (day 0), EGFP (green) was expressed in Dclk1+ cells among Tomato-expressed PanIN cells (magenta). (F) After tamoxifen injection (day 28), the progeny of Dclk1+ cells expressed EGFP (green) and non-progeny cells still expressed Tomato (magenta). Scale bar, 50 µm. (G) Quantification of EGFP+ PanIN cells formed in DRKF mice before (day 0) and 28 days after tamoxifen injection (day 28). The number of PanIN lesions was 85 and 141 per mouse in day 0 and day 28 respectively (mean ± SEM; day 0, n = 6, left bar; day 28, n = 7, right bar; n: number of mice). Statistical significance of the difference is indicated as ***p<0.001, Student’s t-test. (H) Immunofluorescence staining for Dclk1 (cyan), GFP (green), Krt19 (magenta), and Hoechst (blue) of PanINs developed in DRKF mice 28 days after tamoxifen administration. Scale bars, 50 µm.

