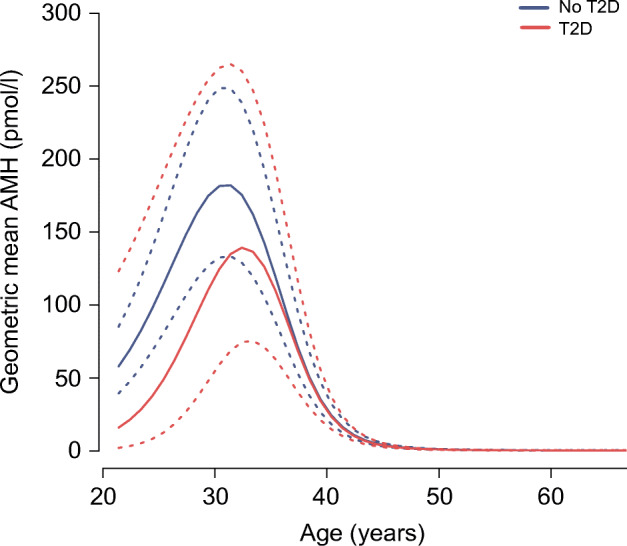
Fig. 2.

Predicted geometric mean AMH trajectories (pmol/l) (solid lines) and 95% CIs (dashed lines) over age in women who were diagnosed with type 2 diabetes compared with women who were not diagnosed with type 2 diabetes during follow-up. Plots show average predicted AMH trajectories across ten imputed datasets. Trajectories are adjusted for current oral contraceptive use, current smoking, BMI, menopausal status, alcohol consumption, physical activity, hypertension, total cholesterol, parity and educational level. T2D, type 2 diabetes
