



Abstract
Grain size is an important trait for crops. The endogenous hormones brassinosteroids (BRs) play key roles in grain size and mass. In this study, we identified an ethyl methylsulfonate (EMS) mutant wheat line, SM482gs, with increased grain size, 1000-grain weight, and protein content, but decreased starch content, compared with the levels in the wild type (WT). Comparative transcriptomic analysis of SM482gs and WT at four developmental stages [9, 15, 20, and 25 days post-anthesis (DPA)] revealed a total of 264, 267, 771, and 1038 differentially expressed genes (DEGs) at these stages. Kyoto Encyclopedia of Genes and Genomes (KEGG) database analysis showed that some DEGs from the comparison at 15 DPA were involved in the pathway of “brassinosteroid biosynthesis,” and eight genes involved in BR biosynthesis and signal transduction were significantly upregulated in SM482gs during at least one stage. This indicated that the enhanced BR signaling in SM482gs might have contributed to its increased grain size via network interactions. The expression of seed storage protein (SSP)-encoding genes in SM482gs was upregulated, mostly at 15 and 20 DPA, while most of the starch synthetase genes showed lower expression in SM482gs at all stages, compared with that in WT. The expression patterns of starch synthase genes and seed storage protein-encoding genes paralleled the decreased level of starch and increased storage protein content of SM482gs, which might be related to the increased seed weight and wrinkled phenotype.
Supplementary Information
The online version contains supplementary material available at 10.1007/s13205-020-02579-6.
Keywords: Wheat mutant, Grain size, BR signaling, Seed storage protein, Starch
Introduction
The allohexaploid wheat (Triticum aestivum L.) provides approximately 20% of the calories consumed by humans globally (Pfeifer et al. 2014). Grain size, shape, and density determine the yield of wheat and other crops (Brown et al. 2009; Shahidullah et al. 2010; Zhang et al. 2013) and grain width, length, and thickness determine the grain weight. Thus, increasing grain size is one of the most important approaches for increasing grain weight and high-yield breeding in wheat (Hong et al. 2014). Numerous genes, such as TaGW2, TaBRI1, TaGS5-3A, TaCKX6a02, and TaSDIR1-4A (Hong et al. 2014; Lu et al. 2015; Ma et al. 2016; Singh et al. 2016; Wang et al. 2020), associated with grain size/weight have been identified in einkorn wheat (Yu et al. 2019), tetraploid wheat (Blanco et al. 2001; Patil et al. 2013), and hexaploid wheat (Breseghello and Sorrells 2006; Gegas et al. 2010; Singh et al. 2016). More recently, one of the TONNEAU1-recruiting motif (TRM) protein genes, TaGW7, was identified (Wang et al. 2019). TaGW7 is a homolog of rice OsGW7 and it was shown that the CRISPR-Cas9 gene editing of TaGW7 affected grain shape and weight in allohexaploid wheat. Various studies including on the function of the TaGW7 gene have revealed the mechanism by which organ size is regulated, which is mainly determined by cell proliferation and elongation (Liu et al. 2015). In addition, Singh et al. (2016) characterized TaBRI1, transmembrane receptor kinase Brassinosteroid-Insensitive 1, from T. aestivum. Overexpression of TaBRI1 in Arabidopsis was found to lead to early flowering, increased silique size, and increased seed yield (Singh et al. 2016). Study of the TaBRI1 gene has provided evidence proving the important role of BR hormones in grain size.
Studies on the roles of brassinosteroids (BRs) in determining seed size, mass, and shape have been reported for Arabidopsis (Jiang et al. 2013), pea (Nomura et al. 2007), tomato (Goetz et al. 2000), and rice (Che et al. 2015; Tanaka et al. 2009; Wu et al. 2008). In Arabidopsis, the BR-deficient mutant de-etiolated2 (det2) was found to have smaller and shorter seeds than wild-type (WT) plants (Jiang et al. 2013). The dwf4 mutant of Arabidopsis is completely male sterile and has a dwarf phenotype (Choe et al. 1998). Overexpression of the gene encoding sterol C-22 hydroxylases that control BR hormone levels was also shown to increase grain filling in rice (Wu et al. 2008). The biosynthesis and signal pathways of BRs have been comprehensively established by molecular genetic studies in Arabidopsis (Gudesblat and Russinova 2011; Kim and Wang 2010). The signal pathway of BRs starts with the BR signal and BRI1 receptor kinase, and then the signal is transmitted and enhanced through a variety of enzymes including BRI1, BKI1, BSK1, BSU1, BIN2, BES1, and BZR1. Finally, the downstream target genes are activated to elicit a specific physiological response, such as cell elongation (Clouse 2011; He et al. 2002). However, the molecular mechanisms underlying the regulatory effects of BRs on grain size and shape in wheat are unclear.
The reserve substance in wheat grains is composed of seed storage proteins (SSPs) and starch. SSPs are mainly composed of glutenins and gliadins, and their content and composition markedly affect the processing quality of wheat flour (Jenner et al. 1991). Glutenins can be classified as high- and low-molecular-weight glutenin subunits (HMW-GS and LMW-GS) (Lagrain et al. 2008). Glutenin determines the elasticity of wheat dough, while gliadins affect its extensibility (Khatkar et al. 2013; Melnyk et al. 2012; Song and Zheng 2008). Greater amounts of gliadin in wheat flour can decrease the mixing time and contribute to dough stability (Song and Zheng 2008). Starch represents approximately 70% of the dry weight of wheat grains (Hannah and James 2008). Starch yield had been successfully increased in various studies aimed at increasing grain yield (Meyer et al. 2004; Smidansky et al. 2002, 2007; Tuncel and Okita 2013). Starch comprises two D-glucose homopolymers, amylose and amylopectin. Starch production involves at least four enzyme families: adenosine diphosphate glucose pyrophosphorylase (AGPase), starch synthases (SSs), starch branching enzymes (SBEs), and starch debranching enzymes (DBEs) (Hannah and James 2008). SSs catalyze the elongation of the chains, granule-bound starch synthase (GBSS) is involved in the synthesis of amylose, while the soluble starch synthases elongate glucan chains of amylopectin. Branch points are introduced by the action of SBE, while amylopectin is synthesized by the coordinated actions of SS, SBE, and DBE. Genetic evidence has demonstrated that DBEs such as isoamylase play a role in starch synthesis and are essential for the formation of crystalline amylopectin (Wang et al. 2014). Therefore, the expression of starch synthetase genes determines the content and composition of starch (Nakamura et al. 1993; Hoshino et al. 1996; Mangalika et al. 2003).
Mutation breeding, for example, by ethyl methanesulfonate (EMS) treatment, is one of the most important approaches for broadening the genetic variation in crops (Rao and Sears 1964). In this study, we generated a mutant line, SM482gs, of common wheat variety Shumai 482 (SM482) using EMS. The mutant displayed larger grain size and higher protein content, but lower starch content, than WT. Furthermore, we analyzed the putative mechanism associated with the increased grain size in SM482gs by comparative transcriptomic analysis at multiple developmental stages.
Materials and methods
Plant materials and growth conditions
The common wheat cultivar Shumai 482 was developed at the Triticeae Research Institute, Sichuan Agricultural University, China. The mature seeds of Shumai 482 were treated with 0.6% (m/v) EMS and then grown in fields. The mutant line SM482gs with increased grain size was selected from M6 progeny. All accessions of the mutant line and WT (Shumai 482) plants were grown in a phytotron chamber under a 16 h light/8 h dark cycle with 24 °C day/18 °C night temperatures for RNA extraction.
Grain size, protein, and starch analyses
We collected the grains of three separate wheat plants from WT and SM482gs mutant, and randomly selected 1000 and 30 normal grains to measure the 1000-grain weight and grain length/width, respectively. For determining grain length and width, grains were scanned with the Epson Perfection V700 Photo (EPSON, Beijing, China) and analyzed using the WinSEEDLE software. All data were analyzed using Student’s t test in IBM SPSS Statistics.
Grain protein (dry weight) was measured using an automatic azotometer (Kjelec 8400; FOSS, Hillerød, Denmark). Total starch and amylose starch contents were measured using the Total Starch Assay Kit and Amylose/Amylopectin Assay Kit (Megazyme, Ireland), in accordance with the manufacturer’s protocols.
RNA extraction, transcriptome sequencing, and read mapping
Grains of WT and SM482gs mutant were harvested at 9, 15, 20, and 25 days post-anthesis (DPA), transferred immediately into liquid nitrogen, and stored at − 80 °C until RNA extraction. Total RNA was isolated using the Plant RNA kit (Biofit, Chengdu, China), in accordance with the manufacturer’s protocol. For each developmental stage, RNA from three individual plants was pooled, and two biological replicates were prepared for RNA-seq analysis at each stage. The yield and purity of each RNA sample were assessed and 16 RNA samples were used to isolate poly(A) mRNA and to prepare a nondirectional Illumina RNA-seq library with an mRNA-Seq Sample Prep Kit (Illumina) (Basebiotech, Chengdu, China). We used the genome of common wheat [cultivar Chinese Spring, downloaded from the Plant Ensembl database, TGACv1 genome (Clavijo et al. 2017) (http://plants.ensembl.org/Triticum_aestivum/Info/Index)] as a reference sequence. Then, we mapped the reads from each sample to the wheat genome using TopHat version 2.1.1 (Trapnell et al. 2009). TopHat split a read in three or more segments of approximately equal size (25 bp) and then mapped them independently. Reads with segments that could be mapped to the genome only non-contiguously were marked as possible intron-spanning reads. TopHat accumulated an index of potential splice junctions by performing segment mapping for all contiguously unmappable reads. The segments of the contiguously unmappable reads were then aligned against these synthetic sequences with Bowtie (version 1.2.2) (Langmead et al. 2009). The resulting contiguous and spliced segment alignments for these reads were merged to form complete alignments to the genome, each spanning one or more splice junctions. The raw sequencing data were deposited into the NCBI SRA database with accession number SRP145867 (https://www.ncbi.nlm.nih.gov/Traces/study/?acc=SRP145867).
Statistical analysis and functional annotation of differentially expressed genes (DEGs)
Based on the RNA-seq data, the gene expression analysis and identification of DEGs were conducted using the R package DESeq (version 1.30.0) (Anders and Huber 2010), in accordance with the manual. Raw count data were prepared by a custom Perl script based on the results obtained from exPress software (version 1.5.1) and were imported into the DESeq framework. Experimental design information was also imported into the DESeq framework to form a count data set. The data were filtered to remove transcripts in the lowest 40% quantile of the overall sum of counts (irrespective of biological condition) to increase the rate of detection of differentially expressed transcripts. The estimate size factors function was used to estimate the effective library size to normalize the transcript counts. The estimate dispersions function was used to estimate dispersion. The nbinomTest function was used to determine whether there was differential expression between two conditions. Transcripts per million (TPM) was used to measure the proportion of transcripts in the pool of RNA (Wagner et al. 2012). The DEGs were defined based on the following criteria: false discovery rate (FDR) < 0.05 and log2(fold change) ≥ 1. Evaluations of the reproducibility and reliability of expression data between biological replicates and hierarchical clustering of DEGs were based on Pearson’s correlation of gene expression, and distance and average linkage, respectively. DEGs for each genome of A, B, and D were counted. Gene Ontology (GO) (Mungall et al. 2011) and KEGG (Ogata et al. 1999) were used to analyze functional enrichment of DEGs based on the hypergeometric test in R (Hush and Scovel 2005). Significance was set at p < 0.05.
Gene expression pattern mining and analyses
Pattern recognition and clustering analysis have often been used to analyze gene expression. Based on the similarity of gene expression profiles, the clustering algorithm was used to classify genes into different clusters. Using the cluster analysis, it was possible to identify the gene sets that have similar functions or participate in the same biological processes. From this analysis, DEGs between WT and SM482gs grains were identified. We used K-means clustering to analyze the dynamic patterns in gene expression. A matrix of expression values for genes vs. samples was used as input data. K-means clustering analysis was one of the mean z-normalized stage replicate transcript expression means and several clusters was performed with k set (k = 12) using the centered correlation as a dissimilarity measure in cluster R packages (version 3.4.1).
Characterization of genes related to grain size and reserve
Genes involved in BR synthesis/signaling and grain quality were identified using BLAST at the NCBI and Ensembl database. The sequences of homologous genes involved in BR synthesis/signaling from Triticum species, rice, Arabidopsis, and wheat are publicly available at the NCBI (Table S4). Next, the sequence of these genes were blasted in the Ensembl database using an E-value threshold of ≤ 1e − 1. The candidate genes were identified with the maximum alignment score, alignment length, and same GO annotation as the query gene. The transcript IDs of the candidate genes were finally identified in the Ensembl database. The expression levels (TPM) of these genes were determined and log10(TPM + 0.001)-transformed using the GeneMiner program (version 1.2, developed by the company Basebio), and were then presented in heatmaps.
Real-time quantitative PCR (RT-qPCR) validation
The expression levels of 16 genes encoding components of BR synthesis/signaling, gliadin, LMW-GS, and starch were quantified by RT-qPCR to verify the RNA-seq data. First-strand cDNA was synthesized using the PrimeScript™ RT Reagent Kit with gDNA Eraser (TaKaRa, Dalian, China), and RT-qPCR was carried out with SYBR® Premix Ex Taq™ II (TaKaRa) on a CFX 96 Real-Time System (Bio-Rad, Hercules, CA, USA). The CFX Manager software (Bio-Rad) was used to analyze the RT-qPCR data and to calculate relative expression with the 2−△△Ct method. The wheat β-actin and glyceraldehyde 3-phosphate dehydrogenase (GAPDH) genes were used as internal reference genes to normalize the relative expression of candidate genes.
Results
Characterization of SM482gs grain size
We identified a mutant line, SM482gs, from a population of EMS-treated T. aestivum cv. Shumai 482. The SM482gs mutant exhibited increased grain size compared with WT (Shumai 482) (Fig. 1). We examined the phenotype of WT and SM482gs at four developmental stages (9, 15, 20, and 25 DPA), which represent embryonic development, and the initial, middle, and late stages of grain filling, respectively. Although the phenotypic differences of grains between WT and mutant were not obvious at 9 DPA, the size (length and width) of the SM482gs mutant grains was significantly (p ≤ 0.05) greater than that of WT grains at the filling stages (15–25 DPA) (Fig. 1a–c). In addition, the wrinkled characteristics of mature SM482gs mutant grains were observed (Fig. 1d). Specifically, the grain length, grain width, and 1000-grain weight of the mutant line were significantly (p ≤ 0.05) increased by 13.6%, 20.7%, and 8.1%, respectively, compared with those in WT (Fig. 1e, f). As we speculated that the grain phenotype of SM482gs might be associated with hormone levels and the accumulation of reserve substances, we further examined the SSP and starch contents. The results showed that SM482gs had significantly higher (5.69%) grain protein content (Fig. 2a). However, the starch content, including total starch and amylose of SM482gs, was significantly lower than that of WT. Specifically, we observed a 4.11% decrease in total starch and a 4.12% decrease in amylose (Fig. 2b).
Fig. 1.

Morphology of WT (S482) and SM482gs mutant grains. a The grain phenotype of WT and SM482gs mutant in four developmental stages. Bar = 1 mm. b Average grain length of WT and SM482gs mutant in four developmental stages (n = 30 each). c Average grain width of WT and SM482gs mutant in four developmental stages (n = 30 each). d Mature grains of WT and SM482gs mutant. Bar = 1 mm. e Average grain length and width of the mature grains (n = 30 each). f 1000-grain weight of the mature grains (n = 100). Data (b, c, e, f) are expressed as means ± SDs. *p ≤ 0.05 (Student’s t-test)
Fig. 2.

Quantification of the reserve substances in mature grains of WT and SM482gs mutant. a Grain protein content in mature grains expressed as the percentage of dry weight (n = 3 each). b Total starch and amylose contents in mature grains expressed as the percentage of dry weight and total starch, respectively (n = 3 each). Data are expressed as means ± SDs. *p ≤ 0.05 (Student’s t-test)
Comparative RNA-seq analysis of WT and SM482gs
We surveyed the transcriptomic patterns of grain-specific gene expression to obtain detailed insights into the mechanism underlying the SM482gs mutant grain phenotype. We applied RNA sequencing at four different developmental stages (9, 15, 20, and 25 DPA), which covered the complete progression of reserve substance accumulation. Therefore, the differences between WT and SM482gs mutant at these stages were suitable focus for further transcriptomic profiling (Fig. 1a).
After raw-read filtering and quality control, approximately 452 million reads (Q > 20) of 150 bp were generated from 16 cDNA libraries through paired-end Illumina sequencing (Table 1). Approximately 73% of these reads could be uniquely mapped to the reference genome [Chinese Spring, Plants Ensemble, TGACv1 genome (Clavijo et al. 2017)], while 4%–7% of reads had non-unique positions in the gene set, and 9%–13% of reads were unmappable. The rates of reads with quality values up to Q20 or Q30 (an error probability for base calling of 1% or 0.1%) were higher than 95% or 91%, respectively. The hierarchical clustering heatmap of Pearson’s correlation coefficients showed the highly correlated expression values of the biological replicates for each sample (Fig. S1). The red color in this figure represents expression values with correlations of R2 > 0.85. The high-quality sequencing results and the high correlation between replicate samples showed that these transcriptomic data could be used for subsequent analysis.
Table 1.
Summary of sequencing data and the results of quality statistical analysis from different developmental stages (9, 15, 20, and 25 DPA) of WT (W) and the SM482gs mutant (M)
| Sample | Total.reads | Ratio.Q20 (%) |
Ratio.Q30 (%) |
GC.content (%) | Unmapped. reads (%) | Non.unique match (%) | Unique match (%) | Length reads (bp) |
|---|---|---|---|---|---|---|---|---|
| W 9d-1 | 34,214,134 | 96.58 | 92.50 | 53.68 | 9.78 | 4.96 | 78.52 | 150 |
| W 9d-2 | 41,401,355 | 96.76 | 92.81 | 53.54 | 9.40 | 5.25 | 78.21 | 150 |
| W 15d-1 | 8,873,110 | 96.07 | 91.67 | 52.22 | 12.34 | 5.38 | 74.25 | 150 |
| W 15d-2 | 42,542,572 | 96.09 | 91.74 | 52.39 | 12.44 | 6.49 | 70.59 | 150 |
| W 20d-1 | 37,325,971 | 95.97 | 91.59 | 52.47 | 12.80 | 6.73 | 69.57 | 150 |
| W 20d-2 | 5,676,445 | 95.83 | 91.34 | 52.15 | 13.41 | 5.48 | 73.01 | 150 |
| W 25d-1 | 35,364,182 | 96.04 | 91.73 | 53.36 | 12.02 | 6.27 | 72.01 | 150 |
| W 25d-2 | 42,744,555 | 95.94 | 91.59 | 53.39 | 12.38 | 6.25 | 71.29 | 150 |
| M 9d-1 | 8,838,343 | 96.59 | 92.54 | 52.93 | 10.45 | 4.58 | 78.76 | 150 |
| M 9d-2 | 39,464,688 | 96.52 | 92.41 | 52.82 | 10.37 | 5.45 | 76.41 | 150 |
| M 15d-1 | 36,748,995 | 96.16 | 91.89 | 52.76 | 11.81 | 6.01 | 73.25 | 150 |
| M 15d-2 | 14,711,493 | 96.22 | 92.03 | 52.86 | 12.38 | 5.16 | 75.07 | 150 |
| M 20d-1 | 32,411,147 | 96.20 | 91.94 | 51.42 | 12.17 | 6.87 | 70.23 | 150 |
| M 20d-2 | 35,934,835 | 96.19 | 91.92 | 51.50 | 12.37 | 7.09 | 69.52 | 150 |
| M 25d-1 | 12,841,871 | 96.23 | 91.99 | 51.91 | 12.86 | 5.49 | 73.61 | 150 |
| M 25d-2 | 23,042,213 | 95.80 | 91.39 | 51.44 | 13.36 | 6.00 | 71.49 | 150 |
Biological replicates of each sample are indicated as “1, 2.” The abbreviations “W9d” and “M9d” represent the 9 DPA samples of WT and SM482gs mutant, respectively. This nomenclature is applied to all samples in this study. Total reads mean the number of all reads that were sequenced from samples. Ratios Q20 and Q30 mean the error probability for base calling of 1% or 0.1%, respectively
Statistical and functional analyses of DEGs between WT and SM482gs
Analyzing DEGs is an effective way of exploring the molecular mechanism behind the grain phenotype of the SM482gs mutant. A comparison between the two wheat materials yielded data regarding differentially expressed genes at different grain filling stages (Table 2). From grain growth to early grain filling in WT (W15_vs_W9, this comparison means the sample of WT at 15 DPA compared with the sample of WT at 9 DPA; the same comparison nomenclature was applied throughout this paper), the number of upregulated genes exceeded the number of downregulated ones (2167 DEGs; 1109 upregulated, 1058 downregulated). As grain filling proceeded, the number of DEGs increased and the number of DEGs was highest at 25 DPA (W25_vs_W9, 5263 DEGs). Contrary to the comparison of W15_vs_W9, the number of downregulated genes exceeded the number of upregulated genes in the comparisons of W20_vs_W9 (1455 upregulated, 1484 downregulated) and W25_vs_W9 (2326 upregulated, 2937 downregulated). In SM482gs, the number of downregulated genes was greater than the number of upregulated genes at all grain filling stages. There were 2167 DEGs in the W15_vs_W9 comparison of WT, while only 1239 DEGs (603 upregulated, 636 downregulated) were identified in the M15_vs_M9 comparison of SM482gs. The numbers of DEGs from M20_vs_M9 (3137 DEG; 1309 upregulated, 1828 downregulated) and M25_vs_M9 comparisons (5705 DEGs; 2452 upregulated, 3253 downregulated) were greater than in the comparisons at the same stage with WT, and the number of upregulated genes in the M25_vs_M9 comparison was greater than that in the same comparison of WT.
Table 2.
Statistics of differentially expressed genes. The DEGs were defined based on false discovery rate (FDR) < 0.05 and log2(fold change) ≥ 1
| Comparison | No. of upregulated DEGs | No. of downregulated DEGs | No. of all DEGs |
|---|---|---|---|
| W15d_vs_W9d | 1109 | 1058 | 2167 |
| W20d_vs_W9d | 1455 | 1484 | 2939 |
| W25d_vs_W9d | 2326 | 2937 | 5263 |
| M15d_vs_M9d | 603 | 636 | 1239 |
| M20d_vs_M9d | 1309 | 1828 | 3137 |
| M25d_vs_M9d | 2452 | 3253 | 5705 |
Regarding the comparison of W15d_vs_W9d, the data mean that a total of 2167 DEGs (1109 genes upregulated and 1058 genes downregulated) were identified in the 15 DPA samples of WT compared with the 9 DPA samples of WT. This nomenclature is applied to all comparisons in this study
We also performed comparisons between WT and SM482gs mutant at the same stage to identify DEGs associated with grain development. DEG sets at the same developmental stages in both WT and SM482gs (M9_vs_W9, M15_vs_W15, M20_vs_W20, M25_vs_W25) were compared (Fig. 3a). The number of upregulated DEGs (120 upregulated) was lowest at 15 DPA among all developmental stages in SM482gs. At 20 and 25 DPA, 771 (288 upregulated, 483 downregulated) and 1038 (399 upregulated, 639 downregulated) DEGs were identified in SM482gs mutant, which were greater numbers than at other developmental stages. Moreover, the three wheat genomes (A, B, and D) contributed approximately equally to the number of DEGs at each stage (Fig. 3b). Hierarchical clustering revealed the transcript patterns of all DEGs in the 16 cDNA libraries (Fig. 3c). A clear difference between early and late stages of grain development was apparent, in which 9 DPA samples of WT and SM482gs formed a separate cluster and showed similar expression profiles.
Fig. 3.

Overview of DEGs identified from the transcriptomes of the SM482gs mutant and WT at the four developmental stages. a Numbers of up- and downregulated DEGs in SM482gs mutant compared with the levels in WT at different stages. b The distribution of DEGs in three genomes (green, A; blue, B; yellow, D) in the different comparisons. c Hierarchical clustering of all DEGs. The DEGs were defined based on false discovery rate (FDR) < 0.05 and log2(fold change) ≥ 1. Red indicates high expression and blue means low expression
DEGs were functionally annotated based on GO term enrichment analysis (P ≤ 0.05). The GO terms including biological process (BP), cellular component (CC), and molecular function (MF) are shown in Fig. S2. Most of the DEGs of SM482gs were significantly enriched for “organelle,” “cell part,” and “cell” categories of CC; “catalytic activity” and “binding” categories of MF; and “single-organism process,” “metabolic process,” and “cellular process” categories of BP. We further analyzed the BP-related DEGs from each comparison (Table S1). In the comparison of each stage, the downregulated DEGs were mainly enriched for “glycolytic process,” “starch biosynthetic process,” “glycogen biosynthetic processes,” “asparagine biosynthetic process,” and “embryo development.” The upregulated DEGs in SM482gs were mainly enriched for “glutamine biosynthetic process” and translation including “translational frameshifting,” “positive regulation of translational elongation and termination,” and “translational elongation” during the middle stages of grain development (15 and 20 DPA).
Additionally, KEGG pathway enrichment was analyzed for all DEGs in each comparison (P ≤ 0.05) (Fig. S3). This showed that “fructose and mannose metabolism,” “carbon fixation in photosynthetic organisms,” “pentose phosphate pathway,” “galactose metabolism,” and “inositol phosphate metabolism” were significantly enriched in the comparison at 9 DPA. The DEGs at the other three stages were enriched for protein metabolism, such as “phenylalanine metabolism,” “glycine, serine, and threonine metabolism,” “alanine, aspartate, and glutamate metabolism,” “valine, leucine, and isoleucine degradation,” and “arginine and proline metabolism.” We further analyzed the KEGG pathway enrichment for the down- and upregulated DEGs in SM482gs (Table S2). Sucrose-related metabolism was significantly enriched in the downregulated DEGs of SM482gs, while protein metabolism was significantly enriched in the upregulated DEGs. These observations were in line with the data of grain starch and protein contents.
Clustering analysis of DEGs between WT and SM482gs
A k-means clustering analysis for all DEGs was performed to reveal differences of expression patterns between WT and SM482gs throughout all of the developmental stages (Fig. 4). Gene sets generated using the k-means (k = 12) and heatmaps could be used to explore the different expression patterns. From the k-means heatmap, the expression level of SM482gs was lower than that of WT in clusters 4, 9, 11, and 12. However, in clusters 1, 2, 3, 5, 6, 7, 8, and 10, SM482gs had a higher expression level than WT during 15 to 25 DPA. Interestingly, in almost all clusters, the 15 DPA samples of SM482gs exhibited a steady increase in gene expression compared with the 15 DPA WT samples.
Fig. 4.
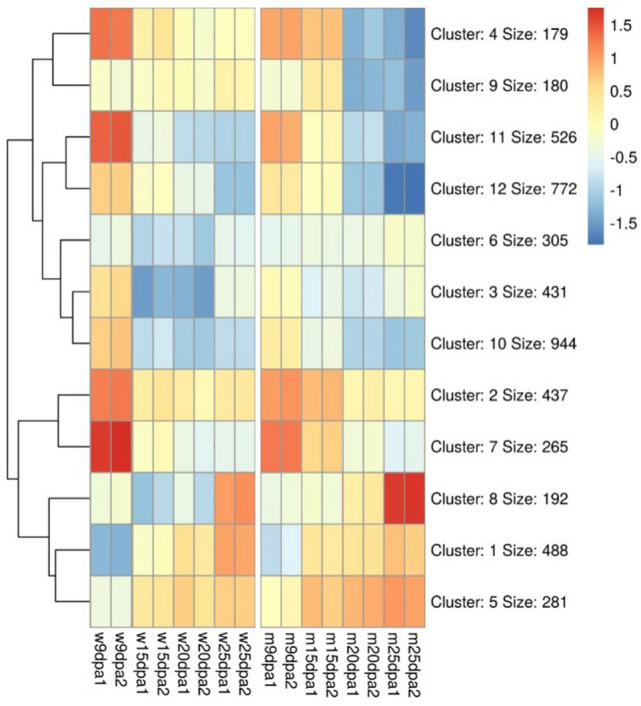
Heatmap for k-means clusters of DEGs in WT and SM482gs mutant at the four developmental stages. The color gradient from blue to red indicates down- and upregulation (see the colored bar). The “size” indicates the number of DEGs in the cluster
We collected GO annotations to classify the clusters identified between WT and SM482gs (Table S3). In the patterns of clusters 4, 9, 11, and 12, the levels of DEGs were decreased in SM482gs, except for at 15 DPA. GO analysis showed that the genes enriched in the four clusters were involved in nutrient reservoir activity, aspartic-type endopeptidase activity, carbohydrate metabolic process, defense response, glucose-1-phosphate adenylyl transferase activity, and glycogen biosynthetic process. The expression levels of clusters 1, 5, and 8 showed sustained increases in SM482gs, and the GO analysis showed main enrichments in nutrient reservoir activity, serine-type endopeptidase inhibitor activity, aspartic-type endopeptidase activity, tricarboxylic acid cycle, and carbohydrate metabolic process.
Genes involved in BR signal transduction are highly expressed in SM482gs in comparison to WT at all grain developmental stages
In the analysis of the KEGG pathway enrichment for the down- and upregulated DEGs, “brassinosteroid biosynthesis” was significantly (p ≤ 0.05) enriched from the comparison at 15 DPA (Table S2). As BR is a critical factor controlling seed size (Che et al. 2015; Wu et al. 2008), we next focused on the expression patterns of critical genes (DWF4, DET2, BRI1, BZR1, BAK1, BZR2/BES1, LIC, BU1, GSK3, GSK1, BSU1) involved in BR biosynthesis and signal transduction (Bajguz 2007; Duan et al. 2006; Koh et al. 2007; Li et al. 2009; Navarro et al. 2015; Tong et al. 2012; Wang et al. 2008, 2006) in SM482gs and WT. The sequences of homologous gene involved in BR synthesis/signaling from Triticum species, rice, Arabidopsis, and wheat were retrieved from NCBI (Table S4). Then, the sequences of these genes were used to identify the transcript IDs of candidate genes in the Ensembl database. The dynamic changes of BR-associated genes during the grain developmental stages are shown in Fig. 5. Only one BR biosynthetic gene (DWF4) showed significantly (p ≤ 0.05, log2fold change ≥ 1) lower expression in SM482gs than in WT from 15 to 25 DPA. The expression levels of LIC, BU1, BSU1, BAK1, and BZR1 genes were significantly (p ≤ 0.05, log2fold change ≥ 1) upregulated at the middle grain filling stages (15 and 20 DPA) or at all of them (15 to 25 DPA). The BZR2/BES1, DET2, and BRI1 genes were significantly (p ≤ 0.05, log2fold change ≥ 1) upregulated in SM482gs at 15 DPA and had the opposite expression pattern in SM482gs when compared with WT. In addition, the expression of GSK1 and GSK3 was slightly higher in SM482gs than in WT from 15 to 25 DPA. Thus, the expression levels of BR genes were mostly higher in SM482gs than in WT in the middle or late stages of grain development.
Fig. 5.

Comparison of the expression levels of genes involved in the BR pathway in RNA-seq data. *represents p ≤ 0.05 and log2fold change ≥ 1
Differential expression of genes related to reserve substances
The expression patterns of DEGs related to reserve substances were investigated during grain development in WT and SM482gs. In a screening for SSPs, we found that gliadin and LMW-GS genes were differentially expressed between WT and SM482gs. Twenty-four gliadin-encoding DEGs were characterized in all libraries, while they shared a tendency for a gradual decrease in expression during grain maturation in WT and SM482gs (Fig. 6a). Of these gliadin DEGs, four expression patterns were identified in SM482gs compared with WT: three genes (AA1549910.1, AA1555680.1, AA1573520.1) were downregulated in all stages; seven (AA1574250.1, AA1549240.1, AA1577600.1, AA1637120.1, AA1668380.1, AA2147070.1, AA2153870.1) genes were upregulated at 9 DPA of SM482gs; 13 genes exhibited increased expression in two or three stages; and only one gene (AA0150060.1) was highly expressed in all four stages. BLAST searches against the NCBI database revealed that the three downregulated genes encoded alpha-gliadin, while the upregulated genes encoded gamma-gliadin. Omega-gliadin genes were not found among the 24 gliadin DEGs.
Fig. 6.

Expression patterns of SSP and starch biosynthesis genes in the four grain developmental stages of WT and SM482gs. a Comparison of gliadin protein-encoding genes. b Comparison of LMW-GS genes. c Comparison of starch biosynthesis-related genes. W: WT, M: SM482gs mutant. The color bar represents log10(TPM + 0.001)-transformed TPM values for each gene. Red and blue colors indicate high and low expression, respectively. The gene names of (a) and (b) are the transcript IDs of the Ensembl database
In addition, we identified 10 LMW-GS DEGs that were mostly upregulated at 9 and 25 DPA in SM482gs, while their expression levels at 15 and 20 DPA were lower than those of WT (Fig. 6b). Only one gene (AA0071580.1) showed increased expression during the middle developmental stages (15 and 20 DPA).
Starch synthetase genes, including AGPase, SS, SBE, and DBE, were identified in all cDNA libraries. The results indicated that the expression patterns in SM482gs were similar to those in WT, but the expression levels were significantly lower than those in WT (Fig. 6c). For example, AGP-S1, AGP-L2, SS1, SSIIa, SSIIIa, SBEIIa, SBEIIb, GBSSIa, and ISA1 showed lower expression in SM482gs at all four stages than WT. ISA3 and PUL showed increased expression in SM482gs at three stages, while the remaining genes tended to show lower expression in the mutant than in WT.
Verification of DEGs through RT-qPCR
Sixteen genes involved in BR and reserve substances were selected for RT-qPCR validation of the RNA-seq data. The IDs and primers of the selected genes are listed in Tables S4 and S5. The results of RT-qPCR are shown in Fig. 7. Correlation analysis based on Pearson’s correlation coefficient (r) between the RT-qPCR and log10(TPM + 0.001)-transformed RNA-seq data indicated that nine genes showed statistically significant correlations (P ≤ 0.05), and six genes showed moderate correlations with r > 0.5, while only one gene of LMW-GS showed r < 0.45. These results suggested that the RNA-seq data were reliable for expression pattern analysis.
Fig. 7.

Validation of 16 candidate genes in WT and SM482gs by RT-qPCR and RNA-seq. The gene numbers (Gliadin 1–4, LMW-GS 1–2) correspond to the gene ID in Supplemental Table S3. The data of RT-qPCR are means ± SDs, n = 3, and different letters indicate significant differences between samples at p < 0.05. The RNA-seq values are log10(TPM + 0.001)-transformed TPM values for each gene. The correlation coefficient (r) for each gene between the RT-qPCR and RNA-seq is shown with the significance level of *p < 0.05
Discussion
Grain size is an important trait that has undergone selection during crop domestication and breeding (Ma et al. 2015; Shomura et al. 2008). EMS induction is an efficient method to generate mutants of target traits in crops. In addition, EMS mutants are useful for characterizing the mechanisms of action on the target trait and have been widely used in crop improvement (Mishra et al. 2016; Regina et al. 2015; Xiong et al. 2017). In this study, we generated an EMS-induced wheat mutant displaying enlarged grain size and increased grain weight. To date, only a few genes controlling seed size and weight have been identified, although numerous QTL controlling grain size and yield components have been reported (Guan et al. 2019; Ma et al. 2015). Thus, our knowledge of wheat grain size is limited. Considering the shrinkage phenotype and variation of the storage substance in SM482gs mutant grain, we investigated the potential mechanism involved in this using RNA-seq for WT and SM482gs, at four grain developmental stages.
Guan et al. (2019) performed transcriptomic surveys of early wheat grains at two developmental stages (5 and 14 DAP) and obtained 9,358 DEGs, which were involved in carbohydrate metabolism, transcription, signal transduction, glycolysis/gluconeogenesis metabolism, and protein processing in the endoplasmic reticulum. The transcriptomic data showed that all of these metabolic pathways participated in early wheat grain development (Guan et al. 2019). In our study, although 264 DEGs were identified in the comparison of M9d_vs_W9d (Fig. 3a), there was no significant difference in grain phenotype between the SM482gs mutant and WT at 9 DPA (Fig. 1). According to previous studies, plant hormones were also identified as the main regulators of early grain development (Guan et al. 2019; Hauvermale et al. 2012; Robert et al. 2015), which is consistent with our study. The brassinosteroid biosynthesis pathway was enriched in the comparison of M15d_vs_W15d (Fig. S3), indicating that the phenotypic difference of the SM482gs mutant might be related to the BR pathway.
Previous work on BR-deficient or BR-insensitive mutants indicated that BR plays a key role in reproductive growth and seed development in Arabidopsis, tomato, and rice (Hong et al. 2005; Morinaka 2006; Fujioka et al.1997; Tanabe 2005; Wu et al. 2008; Ye et al. 2010). Rice mutants with defects in BR biosynthesis or signaling were shown to have reduced grain sizes (Hong et al. 2005; Liu et al. 2015; Morinaka 2006; Tanabe 2005). Wu et al. (2008) generated a transgenic rice line overexpressing a BR biosynthesis gene, which showed a 15%–44% increase in grain yield per plant (Wu et al. 2008). However, the molecular mechanisms behind the effect of BRs on grain size and shape in wheat have remained unclear. In our study, some DEGs identified in the comparison of M15_vs M15 were significantly (p ≤ 0.05) enriched in the “brassinosteroid biosynthesis” pathway. This indicated that BR-related pathways might be involved in the development of SM482gs grains. Therefore, we detected genes involved in BR biosynthesis and signal transduction based on homology analysis using known rice and Arabidopsis genes. Although the BR-biosynthetic gene DWF4 exhibited lower expression in SM482gs, most of the BR signal transduction genes in SM482gs showed higher expression levels to varying degrees.
The current model of BR signal transduction in Arabidopsis is that the active BR binds to the BRI1 receptor kinase to phosphorylate the negative regulator BKI1, releasing it from the membrane and allowing BRI1 to associate with BAK1. BRI1 and BAK1 transphosphorylate each other on specific residues to enhance the signaling capacity of BRI1. The activated BSK1 activates BSU1 and dephosphorylates the BIN2 kinase to inactivate it. The unphosphorylated forms of the transcription factors BES1 and BZR1 then accumulate and bind to the promoters of BR-related target genes, eliciting a specific physiological response, such as cell elongation (Clouse 2011; He et al. 2002). The BR signaling pathway in rice is analogous to that of Arabidopsis. In rice, BR binds to OsBRI1 to promote its association with OsBAK1 (Oryza sativa BRI1 associated receptor kinase 1) and inactivate GSK2. GSK2 phosphorylates OsBZR1, LIC (Oryza sativa leaf and tiller angle increased controller), and DLT (dwarf and low tillering) and inhibits their activity by promoting proteasome-mediated degradation of these factors (Khew et al. 2015; Liu et al. 2017; Tong et al. 2012; Zhang et al. 2014). GSK3 and GSK1 are homologous genes belonging to the GSK3/SHAGGY kinase family, which are a group of highly conserved serine/threonine kinases implicated in multiple signaling pathways that control metabolism and cell activities (Li and Nam 2002; Bittner et al. 2013; Tong et al. 2012).
These studies have demonstrated that the functions of genes involved in BR signaling are conserved in both Arabidopsis and rice. Although several BR signaling genes have been identified in wheat, their interaction in the BR signaling network is still unclear (Kovalchuk et al. 2009; Bittner et al. 2013). In our data, the expression of the BR biosynthesis gene DET2 was higher (4.3 TPM) in SM482gs than in WT at 15 DPA, which was consistent with the changes in BRI1 expression. This would in turn influence the expression of downstream genes in SM482gs at 15 DPA. Activated BSU1, as a positive regulator, not only dephosphorylates GSK1 and GSK3 to inactivate them, but also activates the transcription factors BZR1, BZR2/BES1, and LIC (Clouse 2011; Gudesblat and Russinova 2011). Indeed, from 15 to 25 DPA, BSU1 showed higher expression in SM482gs than in WT, and might have positively regulated the expression of the downstream genes BZR1 and LIC in SM482gs. GSK1 and GSK3, the homologs of OsGSK1 and AtBIN2 (Koh et al. 2007), acted downstream of BAK1 and BSU1 and should be inactivated based on the signaling pathways of Arabidopsis and rice. However, the expression patterns of GSK1 and GSK3 in our RNA-seq data were similar to that of BSU1 in SM482gs. Against this background, the functions of GSK1 and GSK3 and BSU1 downstream substrates in wheat remain unclear and require further research. BU1 (brassinosteroid-upregulated 1) is a novel BR-induced gene, encoding a helix-loop-helix protein (Tanaka et al. 2009). Rice plants overexpressing BU1 show enhanced bending of the lamina joint and increased grain size (Tanaka et al. 2009). In our RNA-seq and RT-qPCR data, BU1 was significantly more highly expressed in SM482gs from 15 to 25 DPA. According to previous reports, BR homeostasis is regulated via a feedback loop in which the BR biosynthesis genes are downregulated by the signaling components BZR1 and BES1 in Arabidopsis, and by OsBZR1 and OsDLT in rice (Yin et al. 2002; Zhang et al. 2014; Wang et al. 2002). Our data also suggested such a feedback loop, in which the expression of DWF4 was lower in SM482gs than in WT, while BZR1, BZR2/BES1, and LIC were more strongly expressed in the mutant. LIC, BU1, BSU1, BAK1, BZR1, and BZR2/BES2 acted as positive regulators in the BR signal pathway and were upregulated to varying degrees in SM482gs grains, suggesting that they might regulate grain shape and size.
More recently, a study showed that not only plant hormone signal transduction but also starch and sucrose metabolism and ubiquitin-mediated proteolysis participate in grain-size formation during grain development (Guan et al. 2019). As for the reserve substances, the rate and duration of both starch and protein deposition in the endosperm of wheat are independent variables, controlled by separate mechanisms, but both are determined by the balance between the capacity of the plant to produce substrate (source-limited) and the capacity of the grain to utilize it (sink-limited) (Abdoli et al. 2013; Jenner et al. 1991). In our study, the RNA-seq data indicated that SSP-encoding and starch synthetase genes showed opposite expression patterns, which were in agreement with the changes in protein content (+ 5.69%) and starch content (–4.11%) in the mutant SM482gs compared with the levels in WT. AGP-S1, AGP-L2, SS1, SSIIa, SSIIIa, SBEIIa, SBEIIb, and GBSSIa are key genes encoding enzymes for starch biosynthesis and their expression levels could affect starch synthesis and accumulation. The different patterns of expression of these starch synthase genes might together contribute to final grain weight by affecting starch accumulation throughout grain filling (Yu et al. 2019). Research by Wang et al. (2014) showed that wheat with high starch content had higher expression of starch synthetase genes than wheat with low starch content (Wang et al. 2014). In the shx shrunken endosperm barley mutant, soluble starch synthase activity was drastically lowered, resulting in reduced starch content, which was regarded as a possible reason for the shrunken phenotype (Schulman et al. 1994). In addition, the deficiency of OsAGPL2 was regarded as the factor responsible for the shrunken rice mutant w24. The endosperm of w24 showed not only severe inhibition of starch synthesis and significant accumulation of sugar, but also clear defects in compound granule formation and storage protein synthesis (Tang et al. 2016). In our results, these starch synthase genes were downregulated throughout grain development in SM482gs, which was usually one of the reasons for the decrease in starch synthesis and accumulation. Therefore, we inferred that starch biosynthesis in our mutant was similarly insufficient for grain filling and might be related to the wrinkled phenotype of SM482gs grains. Although total starch and amylose levels were significantly lower in SM482gs than in WT, the increased expression level of gluten genes resulted in increased protein content, and thus contributed to higher grain weight of the mutant (Fig. 6). This study provided novel insights into the putative mechanism determining grain size based on a wheat mutant.
Supplementary Information
Figure S1. Hierarchical clustering heatmap of Pearson’s correlation coefficients between samples. The biological replicates of each sample are indicated as “1, 2.” The color scale represents the values of Pearson’s correlation coefficients.
Figure S2. GO terms of all DEGs of the SM482gs mutant compared with WT in different grain developmental stages. (A) GO terms of all upregulated DEGs in different comparisons. (B) GO terms of all downregulated DEGs in different comparisons. W: WT, M: SM482gs mutant. p≤0.05.
Figure S3. KEGG pathway enrichment of DEGs of the SM482gs mutant compared with WT in different grain developmental stages. W: WT, M: SM482gs mutant. p≤0.05.
Table S1. Top ten biological processes (BP) enriched among the down- and upregulated DEGs of the SM482gs mutant as compared with WT in different grain developmental stages. W: WT, M: SM482gs mutant.
Table S2. Top ten KEGG pathways enriched among the down- and upregulated DEGs of the SM482gs mutant as compared with WT in different grain developmental stages. W: WT, M: SM482gs mutant.
Table S3. Functional classification of DEGs in each k-means cluster. The numbers represent the numbers of genes.
Table S4. NCBI and transcript IDs of starch synthetase genes, BR-related homologous genes from Triticum species, rice, Arabidopsis, and storage protein genes.
Table S5. The detailed information and primers of genes analyzed for RT-qPCR.
Below is the link to the electronic supplementary material.
Abbreviations
- BR
Brassinosteroid
- EMS
Ethyl methanesulfonate
- WT
Wild type
- DPA
Days post-anthesis
- DEG
Differentially expressed gene
- GO
Gene ontology
- KEGG
Kyoto encyclopedia of genes and genomes
- HMW-GS
High-molecular-weight glutenin subunit
- LMW-GS
Low-molecular-weight glutenin subunit
- RT-qPCR
Real-time quantitative reverse transcription polymerase chain reaction
- RNA-Seq
Ribonucleic acid sequencing
- TPM
Transcripts per million
- AGPase
Adenosine diphosphate glucose pyrophosphorylase
- SS
Starch synthase
- SBE
Starch branching enzyme
- DBE
Starch debranching enzyme
- GBSS
Granule-bound starch synthase
Author contributions
XJZ carried out analysis of RNA sequencing, qRT-PCR and wrote this article. NL and JJD analyzed the bioinformatics. QY carried out material preparation. JYL and HPT contribute to the material planting, the succession of mutant material and management. QTJ conceived and designed the experiments. PFQ, MD, JM, JRW, GYC, XJL, YMW, and YLZ partially participated in its design and revised the manuscript. All authors read and approved the final manuscript.
Funding
This work was supported by the National Key Research and Development Program of China (2017YFD0100900), the Key Research and Development Program of Sichuan Province (2018NZDZX0002), Sichuan Science and Technology Program (2020YFH0140), the International Science & Technology Cooperation Project of Chengdu, Sichuan Province, China (2019-GH02-00078-Hz), and the Technological Innovation Project of Chengdu, Sichuan Province, China (2018-YF05-00059-SN).
Data availability
The raw sequencing data were deposited in the NCBI SRA database with accession numbers SRP115001/SRR5908629 (https://www.ncbi.nlm.nih.gov/Traces/study/?acc=SRP115001).
Compliance with ethical standards
Conflict of interest
The authors declare that there is no conflict of interest.
Footnotes
Xiaojuan Zhong and Na Lin contributed equally to this paper.
References
- Abdoli M, Saeidi M, Jalali-Honarmand S, Mansourifar S, Ghobadi M-E, Cheghamirza K (2013) Effect of source and sink limitation on yield and some agronomic characteristics in modern bread wheat cultivars under post anthesis water deficiency. Acta agriculturae Slovenica 101 (2). doi:10.2478/acas-2013-0013
- Anders S, Huber W. Differential expression analysis for sequence count data. Genome Biol. 2010;11(10):R106. doi: 10.1186/gb-2010-11-10-r106. [DOI] [PMC free article] [PubMed] [Google Scholar]
- Bajguz A. Metabolism of brassinosteroids in plants. Plant Physiol Biochem. 2007;45(2):95–107. doi: 10.1016/j.plaphy.2007.01.002. [DOI] [PubMed] [Google Scholar]
- Bittner T, Campagne S, Neuhaus G et al (2013) Identification and characterization of two wheat Glycogen Synthase Kinase 3/SHAGGY-like kinase. BMC Plant Biol 13 [DOI] [PMC free article] [PubMed]
- Blanco A, Lotti C, Simeone R, et al. Detection of quantitative trait loci for grain yield and yield components across environments in durum wheat. Cereal Res Commun. 2001;29:237–244. doi: 10.1534/genetics.105.044586. [DOI] [Google Scholar]
- Breseghello F, Sorrells ME. Association mapping of kernel size and milling quality in wheat (Triticum aestivum L.) cultivars. Genetics. 2006;172(2):1165–1177. doi: 10.1534/genetics.105.044586. [DOI] [PMC free article] [PubMed] [Google Scholar]
- Brown TA, Jones MK, Powell W, Allaby RG. The complex origins of domesticated crops in the Fertile Crescent. Trends Ecol Evol. 2009;24(2):103–109. doi: 10.1016/j.tree.2008.09.008. [DOI] [PubMed] [Google Scholar]
- Che R, Tong H, Shi B, Liu Y, Fang S, Liu D, Xiao Y, Hu B, Liu L, Wang H, Zhao M, Chu C. Control of grain size and rice yield by GL2-mediated brassinosteroid responses. Nature plants. 2015;2:15195. doi: 10.1038/nplants.2015.195. [DOI] [PubMed] [Google Scholar]
- Choe S, Dilkes BP, Fujioka S, et al. The DWF4 gene of Arabidopsis encodes a cytochrome P450 that meditates multiple 22a-Hydroxylation steps in brassinosteroid biosynthesis. Plant Cell. 1998;10:231–243. doi: 10.1105/tpc.10.2.231. [DOI] [PMC free article] [PubMed] [Google Scholar]
- Clavijo BJ, Venturini L, Schudoma C, et al. An improved assembly and annotation of the allohexaploid wheat genome identifies complete families of agronomic genes and provides genomic evidence for chromosomal translocations. Genome Res. 2017;27(5):885–896. doi: 10.1101/gr.217117.116. [DOI] [PMC free article] [PubMed] [Google Scholar]
- Clouse SD. Brassinosteroid signal transduction: from receptor kinase activation to transcriptional networks regulating plant development. Plant Cell. 2011;23(4):1219–1230. doi: 10.1105/tpc.111.084475. [DOI] [PMC free article] [PubMed] [Google Scholar]
- Duan K, Li L, Hu P, Xu SP, Xu ZH, Xue HW. A brassinolide-suppressed rice MADS-box transcription factor, OsMDP1, has a negative regulatory role in BR signaling. Plant J. 2006;47(4):519–531. doi: 10.1111/j.1365-313X.2006.02804.x. [DOI] [PubMed] [Google Scholar]
- Fujioka S, Li J, Choi YH, et al. The Arabidopsis deetiolated2 mutant is blocked early in brassinosteroid biosynthesis. Am Soc Plant Physiol. 1997;9:1951–1962. doi: 10.1105/tpc.9.11.1951. [DOI] [PMC free article] [PubMed] [Google Scholar]
- Gegas VC, Nazari A, Griffiths S, Simmonds J, Fish L, Orford S, Sayers L, Doonan JH, Snape JW. A genetic framework for grain size and shape variation in wheat. Plant Cell. 2010;22(4):1046–1056. doi: 10.1105/tpc.110.074153. [DOI] [PMC free article] [PubMed] [Google Scholar]
- Goetz M, Godt DE, Roitsch T. Tissue-specific induction of the mRNA for an extracellular invertase isoenzyme of tomato by brassinosteroids suggests a role for steroid hormones in assimilate partitioning. Plant J. 2000;22(6):515–522. doi: 10.1046/j.1365-313x.2000.00766.x. [DOI] [PubMed] [Google Scholar]
- Guan Y, Li G, Chu Z, Ru Z, Jiang X, Wen Z, Zhang G, Wang Y, Zhang Y, Wei W. Transcriptome analysis reveals important candidate genes involved in grain-size formation at the stage of grain enlargement in common wheat cultivar "Bainong 4199". PLoS ONE. 2019;14(3):e0214149. doi: 10.1371/journal.pone.0214149. [DOI] [PMC free article] [PubMed] [Google Scholar]
- Gudesblat GE, Russinova E. Plants grow on brassinosteroids. Curr Opin Plant Biol. 2011;14(5):530–537. doi: 10.1016/j.pbi.2011.05.004. [DOI] [PubMed] [Google Scholar]
- Hannah LC, James M. The complexities of starch biosynthesis in cereal endosperms. Curr Opin Biotechnol. 2008;19(2):160–165. doi: 10.1016/j.copbio.2008.02.013. [DOI] [PubMed] [Google Scholar]
- Hauvermale AL, Ariizumi T, Steber CM. Gibberellin signaling: a theme and variations on DELLA repression. Plant Physiol. 2012;160(1):83–92. doi: 10.1104/pp.112.200956. [DOI] [PMC free article] [PubMed] [Google Scholar]
- He JX, Gendron JM, Yang Y, Li J, Wang ZY. The GSK3-like kinase BIN2 phosphorylates and destabilizes BZR1, a positive regulator of the brassinosteroid signaling pathway in Arabidopsis. Proc Natl Acad Sci USA. 2002;99(15):10185–10190. doi: 10.1073/pnas.152342599. [DOI] [PMC free article] [PubMed] [Google Scholar]
- Hong Z, Ueguchi-Tanaka M, Fujioka S, Takatsuto S, Yoshida S, Hasegawa Y, Ashikari M, Kitano H, Matsuoka M. The Rice brassinosteroid-deficient dwarf2 mutant, defective in the rice homolog of Arabidopsis DIMINUTO/DWARF1, is rescued by the endogenously accumulated alternative bioactive brassinosteroid, dolichosterone. Plant Cell. 2005;17(8):2243–2254. doi: 10.1105/tpc.105.030973. [DOI] [PMC free article] [PubMed] [Google Scholar]
- Hong Y, Chen L, Du LP, Su Z, Wang J, Ye X, Qi L, Zhang Z. Transcript suppression of TaGW2 increased grain width and weight in bread wheat. Funct Integr Genomics. 2014;14(2):341–349. doi: 10.1007/s10142-014-0380-5. [DOI] [PubMed] [Google Scholar]
- Hoshino T, Ito S, Hatta K, et al. Development of waxy common wheat by haploid breeding. Breed Sci. 1996;46:185–188. [Google Scholar]
- Hush D, Scovel HC. Concentration of the hypergeometric distribution. Stat Probabil Lett. 2005;2(75):127–132. doi: 10.1016/j.spl.2005.05.019. [DOI] [Google Scholar]
- Jenner C, Ugalde T, Aspinall D. The physiology of starch and protein deposition in the endosperm of wheat. AustJPlant Physiol. 1991;18:211–226. [Google Scholar]
- Jiang WB, Huang HY, Hu YW, Zhu SW, Wang ZY, Lin WH. Brassinosteroid regulates seed size and shape in Arabidopsis. Plant Physiol. 2013;162(4):1965–1977. doi: 10.1104/pp.113.217703. [DOI] [PMC free article] [PubMed] [Google Scholar]
- Khatkar BS, Barak S, Mudgil D. Effects of gliadin addition on the rheological, microscopic and thermal characteristics of wheat gluten. Int J Biol Macromol. 2013;53:38–41. doi: 10.1016/j.ijbiomac.2012.11.002. [DOI] [PubMed] [Google Scholar]
- Khew CY, Teo CJ, Chan WS, Wong HL, Namasivayam P, Ho CL. Brassinosteroid insensitive 1-associated kinase 1 (OsI-BAK1) is associated with grain filling and leaf development in rice. J Plant Physiol. 2015;182:23–32. doi: 10.1016/j.jplph.2015.05.003. [DOI] [PubMed] [Google Scholar]
- Kim TW, Wang ZY. Brassinosteroid signal transduction from receptor kinases to transcription factors. Annu Rev Plant Biol. 2010;61:681–704. doi: 10.1146/annurev.arplant.043008.092057. [DOI] [PubMed] [Google Scholar]
- Koh S, Lee SC, Kim MK, Koh JH, Lee S, An G, Choe S, Kim SR. T-DNA tagged knockout mutation of rice OsGSK1, an orthologue of Arabidopsis BIN2, with enhanced tolerance to various abiotic stresses. Plant Mol Biol. 2007;65(4):453–466. doi: 10.1007/s11103-007-9213-4. [DOI] [PubMed] [Google Scholar]
- Kovalchuk N, Smith J, Pallotta M, et al. Characterization of a wheat endosperm transfer cell specific protein TaPR60. Plant Mol Biol. 2009;71:81–98. doi: 10.1007/s11103-009-9510-1). [DOI] [PubMed] [Google Scholar]
- Lagrain B, Thewissen BG, Brijs K, Delcour JA. Mechanism of gliadin–glutenin cross-linking during hydrothermal treatment. Food Chem. 2008;107(2):753–760. doi: 10.1016/j.foodchem.2007.08.082. [DOI] [Google Scholar]
- Langmead, B., Trapnell, C., Pop, M. et al (2009) Ultrafast and memory-efficient alignment of short DNA sequences to the human genome. Genome Biology 10:R25 (3). doi:10.1093/bioinformatics/btp120 [DOI] [PMC free article] [PubMed]
- Li J, Nam KH. Regulation of brassinosteroid signaling by a GSK3/SHAGGY-like kinase. Science. 2002;295(5558):1299–1301. doi: 10.1126/science.1065769. [DOI] [PubMed] [Google Scholar]
- Li D, Wang L, Wang M, Xu YY, Luo W, Liu YJ, Xu ZH, Li J, Chong K. Engineering OsBAK1 gene as a molecular tool to improve rice architecture for high yield. Plant Biotechnol J. 2009;7(8):791–806. doi: 10.1111/j.1467-7652.2009.00444.x. [DOI] [PubMed] [Google Scholar]
- Liu S, Hua L, Dong S, Chen H, Zhu X, Jiang J, Zhang F, Li Y, Fang X, Chen F. OsMAPK6, a mitogen-activated protein kinase, influences rice grain size and biomass production. Plant J. 2015;84(4):672–681. doi: 10.1111/tpj.13025. [DOI] [PubMed] [Google Scholar]
- Liu J, Chen J, Zheng X, Wu F, Lin Q, Heng Y, Tian P, Cheng Z, Yu X, Zhou K, Zhang X, Guo X, Wang J, Wang H, Wan J. GW5 acts in the brassinosteroid signalling pathway to regulate grain width and weight in rice. Nat Plants. 2017;3:17043. doi: 10.1038/nplants.2017.43. [DOI] [PubMed] [Google Scholar]
- Lu J, Chang C, Zhang HP, Wang SX, Sun G, Xiao SH, Ma CX. Identification of a novel allele of TaCKX6a02 associated with grain size, filling rate and weight of common wheat. PLoS ONE. 2015;10(12):e0144765. doi: 10.1371/journal.pone.0144765. [DOI] [PMC free article] [PubMed] [Google Scholar]
- Ma M, Wang Q, Li Z, Cheng H, Li Z, Liu X, Song W, Appels R, Zhao H (2015) Expression of TaCYP78A3, a gene encoding cytochrome P450 CYP78A3 protein in wheat (Triticum aestivum L.), affects seed size. The Plant journal: for cell and molecular biology 83(2):312–325. doi:10.1111/tpj.12896 [DOI] [PubMed]
- Ma L, Li T, Hao C, Wang Y, Chen X, Zhang X. TaGS5-3A, a grain size gene selected during wheat improvement for larger kernel and yield. Plant Biotechnol J. 2016;14(5):1269–1280. doi: 10.1111/pbi.12492. [DOI] [PMC free article] [PubMed] [Google Scholar]
- Mangalika WHA, Miura H, Yamauchi H, et al. Properties of starches from near-isogenic wheat lines with different Wx protein deficiencies. Cereal Chem. 2003;6(80):662–666. doi: 10.1094/CCHEM.2003.80.6.662. [DOI] [Google Scholar]
- Melnyk JP, Dreisoerner J, Marcone MF, Seetharaman K. Using the gluten peak tester as a tool to measure physical properties of gluten. J Cereal Sci. 2012;56(3):561–567. doi: 10.1016/j.jcs.2012.07.015. [DOI] [Google Scholar]
- Meyer FD, Smidansky ED, Beecher B, Greene TW, Giroux MJ. The maize Sh2r6hs ADP-glucose pyrophosphorylase (AGP) large subunit confers enhanced AGP properties in transgenic wheat (Triticum aestivum) Plant Sci. 2004;167(4):899–911. doi: 10.1016/j.plantsci.2004.05.031. [DOI] [Google Scholar]
- Mishra A, Singh A, Sharma M, Kumar P, Roy J. Development of EMS-induced mutation population for amylose and resistant starch variation in bread wheat (Triticum aestivum) and identification of candidate genes responsible for amylose variation. BMC Plant Biol. 2016;16(1):217. doi: 10.1186/s12870-016-0896-z. [DOI] [PMC free article] [PubMed] [Google Scholar]
- Morinaka Y. Morphological alteration caused by brassinosteroid insensitivity increases the biomass and grain production of rice. Plant Physiol. 2006;141(3):924–931. doi: 10.1104/pp.106.077081. [DOI] [PMC free article] [PubMed] [Google Scholar]
- Mungall CJ, Bada M, Berardini TZ, Deegan J, Ireland A, Harris MA, Hill DP, Lomax J. Cross-product extensions of the Gene Ontology. J Biomed Inform. 2011;44(1):80–86. doi: 10.1016/j.jbi.2010.02.002. [DOI] [PMC free article] [PubMed] [Google Scholar]
- Nakamura T, Yamamori M, Hirano H, Hidaka S. Identification of three Wx proteins in wheat (Triticum aestivum L.) Biochem Genet. 1993;31(1–2):75–86. doi: 10.1007/BF02399821. [DOI] [PubMed] [Google Scholar]
- Navarro C, Moore J, Ott A, Baumert E, Mohan A, Gill KS, Sandhu D. Evolutionary, comparative and functional analyses of the brassinosteroid receptor gene, BRI1, in wheat and its relation to other plant genomes. PLoS ONE. 2015;10(5):e0127544. doi: 10.1371/journal.pone.0127544. [DOI] [PMC free article] [PubMed] [Google Scholar]
- Nomura T, Ueno M, Yamada Y, Takatsuto S, Takeuchi Y, Yokota T. Roles of brassinosteroids and related mRNAs in pea seed growth and germination. Plant Physiol. 2007;143(4):1680–1688. doi: 10.1104/pp.106.093096. [DOI] [PMC free article] [PubMed] [Google Scholar]
- Ogata H, Goto S, Sato K, Fujibuchi W, Bono H, Kanehisa M. KEGG: kyoto encyclopedia of genes and genomes. Nucleic Acids Res. 1999;27(1):29–34. doi: 10.1093/nar/27.1.29. [DOI] [PMC free article] [PubMed] [Google Scholar]
- Patil RM, Tamhankar SA, Oak MD, et al. Mapping of QTL for agronomic traits and kernel characters in durum wheat (Triticum durum Desf.) Euphytica. 2013;190:117–129. doi: 10.1007/s10681-012-0785-y). [DOI] [Google Scholar]
- Pfeifer M, Kugler KG, Sandve SR, et al. Genome interplay in the grain transcriptome of hexaploid bread wheat. Science. 2014;345(6194):1250091–1250095. doi: 10.1126/science.1251788. [DOI] [PubMed] [Google Scholar]
- Rao HKS, Sears ER. Chemical mutagenesis in Triticum aestivum. Mutation Res Fundamental Mol Mech Mutagenesis. 1964;1(4):387–399. doi: 10.1016/0027-5107(64)90032-6. [DOI] [Google Scholar]
- Regina A, Berbezy P, Kosar-Hashemi B, Li S, Cmiel M, Larroque O, Bird AR, Swain SM, Cavanagh C, Jobling SA, Li Z, Morell M. A genetic strategy generating wheat with very high amylose content. Plant Biotechnol J. 2015;13(9):1276–1286. doi: 10.1111/pbi.12345. [DOI] [PubMed] [Google Scholar]
- Robert HS, Grunewald W, Sauer M, Cannoot B, Soriano M, Swarup R, Weijers D, Bennett M, Boutilier K, Friml J. Plant embryogenesis requires AUX/LAX-mediated auxin influx. Development. 2015;142(4):702–711. doi: 10.1242/dev.115832. [DOI] [PubMed] [Google Scholar]
- Schulman AH, Tester RF, Ahokas H, Morrison WR. The effect of the shrunken endosperm mutation shx on starch granule development in barley seeds. J Cereal Sci. 1994;19(1):49–55. doi: 10.1006/jcrs.1994.1007. [DOI] [Google Scholar]
- Shahidullah SM, Hanafi MM, Ashrafuzzaman M, et al. Analysis of grain density and yield characters in aromatic rice genotypes. Agrociencia. 2010;44(7):325–227. [Google Scholar]
- Shomura A, Izawa T, Ebana K, Ebitani T, Kanegae H, Konishi S, Yano M. Deletion in a gene associated with grain size increased yields during rice domestication. Nat Genet. 2008;40(8):1023–1028. doi: 10.1038/ng.169. [DOI] [PubMed] [Google Scholar]
- Singh A, Breja P, Khurana JP, Khurana P. Wheat brassinosteroid-insensitive1 (TaBRI1) interacts with members of TaSERK gene family and cause early flowering and seed yield enhancement in Arabidopsis. PLoS ONE. 2016;11(6):e0153273. doi: 10.1371/journal.pone.0153273. [DOI] [PMC free article] [PubMed] [Google Scholar]
- Smidansky ED, Clancy M, Meyer FD, Lanning SP, Blake NK, Talbert LE, Giroux MJ. Enhanced ADP-glucose pyrophosphorylase activity in wheat endosperm increases seed yield. Proc Natl Acad Sci USA. 2002;99(3):1724–1729. doi: 10.1073/pnas.022635299. [DOI] [PMC free article] [PubMed] [Google Scholar]
- Smidansky ED, Meyer FD, Blakeslee B, Weglarz TE, Greene TW, Giroux MJ. Expression of a modified ADP-glucose pyrophosphorylase large subunit in wheat seeds stimulates photosynthesis and carbon metabolism. Planta. 2007;225(4):965–976. doi: 10.1007/s00425-006-0400-3. [DOI] [PubMed] [Google Scholar]
- Song Y, Zheng Q. Influence of gliadin removal on strain hardening of hydrated wheat gluten during equibiaxial extensional deformation. J Cereal Sci. 2008;48(1):58–67. doi: 10.1016/j.jcs.2007.08.001. [DOI] [Google Scholar]
- Tanabe S. A Novel cytochrome P450 is implicated in brassinosteroid biosynthesis via the characterization of a rice dwarf mutant, dwarf11, with reduced seed length. Plant Cell Online. 2005;17(3):776–790. doi: 10.1105/tpc.104.024950. [DOI] [PMC free article] [PubMed] [Google Scholar]
- Tanaka A, Nakagawa H, Tomita C, Shimatani Z, Ohtake M, Nomura T, Jiang CJ, Dubouzet JG, Kikuchi S, Sekimoto H, Yokota T, Asami T, Kamakura T, Mori M. BRASSINOSTEROID UPREGULATED1, encoding a helix-loop-helix protein, is a novel gene involved in brassinosteroid signaling and controls bending of the lamina joint in rice. Plant Physiol. 2009;151(2):669–680. doi: 10.1104/pp.109.140806. [DOI] [PMC free article] [PubMed] [Google Scholar]
- Tang XJ, Peng C, Zhang J, Cai Y, You XM, Kong F, Yan HG, Wang GX, Wang L, Jin J, Chen WW, Chen XG, Ma J, Wang P, Jiang L, Zhang WW, Wan JM. ADP-glucose pyrophosphorylase large subunit 2 is essential for storage substance accumulation and subunit interactions in rice endosperm. Plant Sci. 2016;249:70–83. doi: 10.1016/j.plantsci.2016.05.010. [DOI] [PubMed] [Google Scholar]
- Tong H, Liu L, Jin Y, Du L, Yin Y, Qian Q, Zhu L, Chu C. DWARF AND LOW-TILLERING acts as a direct downstream target of a GSK3/SHAGGY-like kinase to mediate brassinosteroid responses in rice. Plant Cell. 2012;24(6):2562–2577. doi: 10.1105/tpc.112.097394. [DOI] [PMC free article] [PubMed] [Google Scholar]
- Trapnell C, Pachter L, Salzberg SL. TopHat: discovering splice junctions with RNA-Seq. Bioinformatics. 2009;25(9):1105–1111. doi: 10.1093/bioinformatics/btp120. [DOI] [PMC free article] [PubMed] [Google Scholar]
- Tuncel A, Okita TW. Improving starch yield in cereals by over-expression of ADPglucose pyrophosphorylase: expectations and unanticipated outcomes. Plant Sci. 2013;211:52–60. doi: 10.1016/j.plantsci.2013.06.009. [DOI] [PubMed] [Google Scholar]
- Wagner GP, Kin K, Lynch VJ. Measurement of mRNA abundance using RNA-seq data: RPKM measure is inconsistent among samples. Theory Biosci. 2012;131(4):281–285. doi: 10.1007/s12064-012-0162-3. [DOI] [PubMed] [Google Scholar]
- Wang ZY, Nakano T, Gendron J, et al. Nuclear-localized BZR1 mediates brassinosteroid-induced growth and feedback suppression of brassinosteroid biosynthesis. Development Cell. 2002;2:505–513. doi: 10.1016/S1534-5807(02)00153-3. [DOI] [PubMed] [Google Scholar]
- Wang L, Xu YY, Ma QB, Li D, Xu ZH, Chong K. Heterotrimeric G protein alpha subunit is involved in rice brassinosteroid response. Cell Res. 2006;16(12):916–922. doi: 10.1038/sj.cr.7310111. [DOI] [PubMed] [Google Scholar]
- Wang L, Xu Y, Zhang C, Ma Q, Joo SH, Kim SK, Xu Z, Chong K. OsLIC, a novel CCCH-type zinc finger protein with transcription activation, mediates rice architecture via brassinosteroids signaling. PLoS ONE. 2008;3(10):e3521. doi: 10.1371/journal.pone.0003521. [DOI] [PMC free article] [PubMed] [Google Scholar]
- Wang Z, Li W, Qi J, Shi P, Yin Y. Starch accumulation, activities of key enzyme and gene expression in starch synthesis of wheat endosperm with different starch contents. J Food Sci Technol. 2014;51(3):419–429. doi: 10.1007/s13197-011-0520-z. [DOI] [PMC free article] [PubMed] [Google Scholar]
- Wang W, Pan Q, Tian B, He F, Chen Y, Bai G, Akhunova A, Trick HN, Akhunov E. Gene editing of the wheat homologs of TONNEAU1-recruiting motif encoding gene affects grain shape and weight in wheat. Plant J. 2019;100(2):251–264. doi: 10.1111/tpj.14440. [DOI] [PMC free article] [PubMed] [Google Scholar]
- Wang J, Wang R, Mao X, Zhang J, Liu Y, Xie Q, Yang X, Chang X, Li C, Zhang X, Jing R. RING finger ubiquitin E3 ligase gene TaSDIR1-4A contributes to grain size in common wheat. J Exp Bot. 2020 doi: 10.1093/jxb/eraa271. [DOI] [PMC free article] [PubMed] [Google Scholar]
- Wu CY, Trieu A, Radhakrishnan P, Kwok SF, Harris S, Zhang K, Wang J, Wan J, Zhai H, Takatsuto S, Matsumoto S, Fujioka S, Feldmann KA, Pennell RI. Brassinosteroids regulate grain filling in rice. Plant Cell. 2008;20(8):2130–2145. doi: 10.1105/tpc.107.055087. [DOI] [PMC free article] [PubMed] [Google Scholar]
- Xiong H, Guo H, Xie Y, Zhao L, Gu J, Zhao S, Li J, Liu L. RNAseq analysis reveals pathways and candidate genes associated with salinity tolerance in a spaceflight-induced wheat mutant. Sci Rep. 2017;7(1):2731. doi: 10.1038/s41598-017-03024-0. [DOI] [PMC free article] [PubMed] [Google Scholar]
- Yamamori M, Hirano H et al. (1993) Identification of three Wxproteinsin wheat. Biochemica Genetics 31:75-86 [DOI] [PubMed]
- Ye Q, Zhu W, Li L, Zhang S, Yin Y, Ma H, Wang X. Brassinosteroids control male fertility by regulating the expression of key genes involved in Arabidopsis anther and pollen development. Proc Natl Acad Sci USA. 2010;107(13):6100–6105. doi: 10.1073/pnas.0912333107. [DOI] [PMC free article] [PubMed] [Google Scholar]
- Yin Y, Wang ZY, Mora-Garcia S, et al. BES1 accumulates in the nucleus in response to brassinosteroids to regulate gene expression and promote stem elongation. Cell. 2002;109:181–191. doi: 10.1016/S0092-8674(02)00721-3. [DOI] [PubMed] [Google Scholar]
- Yu K, Liu D, Chen Y, Wang D, Yang W, Yang W, Yin L, Zhang C, Zhao S, Sun J, Liu C, Zhang A. Unraveling the genetic architecture of grain size in einkorn wheat through linkage and homology mapping and transcriptomic profiling. J Exp Bot. 2019;70(18):4671–4688. doi: 10.1093/jxb/erz247. [DOI] [PMC free article] [PubMed] [Google Scholar]
- Zhang YC, Yu Y, Wang CY, Li ZY, Liu Q, Xu J, Liao JY, Wang XJ, Qu LH, Chen F, Xin P, Yan C, Chu J, Li HQ, Chen YQ. Overexpression of microRNA OsmiR397 improves rice yield by increasing grain size and promoting panicle branching. Nat Biotechnol. 2013;31(9):848–852. doi: 10.1038/nbt.2646. [DOI] [PubMed] [Google Scholar]
- Zhang C, Bai MY, Chong K. Brassinosteroid-mediated regulation of agronomic traits in rice. Plant Cell Rep. 2014;33(5):683–696. doi: 10.1007/s00299-014-1578-7. [DOI] [PMC free article] [PubMed] [Google Scholar]
Associated Data
This section collects any data citations, data availability statements, or supplementary materials included in this article.
Supplementary Materials
Data Availability Statement
The raw sequencing data were deposited in the NCBI SRA database with accession numbers SRP115001/SRR5908629 (https://www.ncbi.nlm.nih.gov/Traces/study/?acc=SRP115001).