

Abstract
This study examines coronavirus disease 2019 hospitalization trends for pediatric patients in 22 states.
While early evidence and experience with coronavirus disease 2019 (COVID-19) suggests that children are less susceptible to infection and have a lower risk for symptomatic and severe disease, pediatric patients are not immune from the virus. We examined pediatric COVID-19 hospitalization trends in 22 states for indications of both severity among this population and spread of the virus.
Methods
Using data extracted from the University of Minnesota COVID-19 Hospitalization Tracking Project,1 we identified the 22 states that reported cumulative COVID-19 hospitalizations overall and for patients 19 years and younger (in some states younger than 17 or 14 years) between May 15, 2020, and November 15, 2020. The University of Minnesota institutional review board reviewed the study data and determined that it was not human subject research. We combined state-level hospitalization data with population estimates from the US Census.2 Cumulative pediatric COVID-19 hospitalizations per 100 000 children were calculated at regular time intervals, and growth rates were calculated on the changes in per capita hospitalizations. Cross-sectional analyses done include tabulations by state over time.
Results
There were a total of 301 102 COVID-19 hospitalizations and 5364 pediatric COVID-19 hospitalizations in 22 states during the study period (Table). At the beginning of the study, the average cumulative hospitalization rate per 100 000 children was 2.0, increasing to 17.2 by the end of the study. There were large variations across states at the beginning and end of the study and in the extent of change in rates. For example, at the start of the study, Hawaii and Rhode Island had the lowest pediatric hospitalization rates at 0.0 per 100 000 children, whereas New Jersey and Colorado had the highest at 5.0 and 4.4 per 100 000 children. At the end of the study, Hawaii and New Hampshire had the lowest rates at 4.3 and 3.4 per 100 000 respectively and South Dakota and Arizona had the highest rates at 33.7 and 32.8 per 100 000. There was also significant variance between states in the magnitude of change from the beginning to the end of the study period, with rates in Hawaii and New Hampshire increasing by 4.3 and 1.0 per 100 000 compared with much larger growth in the rates in Arizona and South Dakota (32.0 and 31.2 per 100 000 respectively). Several states saw significant growth in 3 months, with Utah experiencing a 5067% increase from 0.3 hospitalizations to 15.5 per 100 000 at the high end, compared with 42% increase from 2.4 to 3.4 per 100 000 in New Hampshire. The Figure shows the percentage of cumulative COVID-19–related hospitalizations attributable to pediatric patients during the study period for each state.
Table. Cumulative Pediatric and Adult COVID-19 Hospitalization Ratesa.
| State | Study observation period | Pediatric age range, y | Cumulative Hospitalizations, No. | Cumulative hospitalizations per 100 000 persons, No. | |||||||
|---|---|---|---|---|---|---|---|---|---|---|---|
| Pediatric | Adult | ||||||||||
| Beginning | End | All age groupsb | Pediatricb | Beginning | End | % Growth | Beginning | End | % Growth | ||
| Arizona | May 15, 2020 | November 15, 2020 | 0-19 | 23 122 | 602 | 0.8 | 32.8 | 4000 | 30.8 | 415.3 | 1248 |
| Colorado | May 15, 2020 | November 15, 2020 | 0-19 | 11 124 | 337 | 4.4 | 24.0 | 445 | 73.9 | 249.9 | 238 |
| Florida | July 15, 2020 | November 15, 2020 | 0-14 | 51 900 | 653 | 4.8 | 18.6 | 288 | 107.1 | 286.3 | 167 |
| Georgia | June 15, 2020 | November 15, 2020 | 0-17 | 33 241 | 547 | 3.0 | 21.8 | 627 | 114.8 | 405.4 | 253 |
| Hawaii | May 15, 2020 | November 15, 2020 | 0-19 | 1209 | 14 | 0.0 | 4.3 | NA | 7.8 | 96.0 | 1131 |
| Indiana | May 15, 2020 | November 15, 2020 | 0-19 | 20 704 | 267 | 2.6 | 15.2 | 485 | 99.3 | 400.3 | 303 |
| Kansas | May 15, 2020 | November 15, 2020 | 0-17 | 4431 | 82 | 0.6 | 11.7 | 1850 | 32.9 | 198.5 | 503 |
| Massachusetts | May 15, 2020 | August 15, 2020 | 0-19 | 12 170 | 123 | 3.4 | 7.9 | 132 | 155.0 | 224.5 | 45 |
| Minnesota | June 15, 2020 | November 15, 2020 | 0-19 | 12 443 | 406 | 1.6 | 28.1 | 1656 | 26.7 | 287.1 | 975 |
| Mississippi | May 15, 2020 | November 15, 2020 | 0-17 | 7091 | 109 | 2.4 | 15.6 | 550 | 76.5 | 308.5 | 303 |
| North Dakota | May 15, 2020 | October 1, 2020 | 0-19 | 884 | 8 | 1.0 | 4.0 | 300 | 23.1 | 135.1 | 485 |
| Nebraska | June 1, 2020 | November 15, 2020 | 0-19 | 3575 | 66 | 2.5 | 12.5 | 400 | 54.1 | 251.1 | 364 |
| New Hampshire | June 1, 2020 | November 15, 2020 | 0-19 | 817 | 10 | 2.4 | 3.4 | 42 | 41.6 | 75.6 | 82 |
| New Jersey | May 15, 2020 | November 15, 2020 | 0-17 | 41 221 | 453 | 5.0 | 23.4 | 368 | 267.3 | 587.3 | 120 |
| Ohio | May 15, 2020 | November 15, 2020 | 0-19 | 22 265 | 502 | 1.5 | 17.4 | 1060 | 54.0 | 247.4 | 358 |
| Oregon | May 15, 2020 | November 15, 2020 | 0-19 | 3754 | 110 | 0.6 | 11.4 | 1800 | 21.0 | 111.9 | 433 |
| Rhode Island | May 15, 2020 | November 15, 2020 | 0-19 | 3428 | 69 | 0.0 | 29.0 | NA | 144.4 | 407.1 | 182 |
| South Dakota | May 15, 2020 | November 15, 2020 | 0-19 | 3644 | 81 | 2.5 | 33.7 | 1248 | 45.3 | 556.1 | 1128 |
| Utah | May 15, 2020 | November 15, 2020 | 0-14 | 6769 | 120 | 0.3 | 15.5 | 5067 | 23.2 | 274.0 | 1081 |
| Virginia | May 15, 2020 | November 15, 2020 | 0-19 | 13 504 | 263 | 2.4 | 12.6 | 425 | 56.9 | 208.5 | 266 |
| Washington | May 15, 2020 | November 15, 2020 | 0-19 | 9425 | 189 | 1.0 | 10.3 | 930 | 53.8 | 163.0 | 203 |
| Wisconsin | May 15, 2020 | November 15, 2020 | 0-19 | 14 381 | 353 | 1.9 | 24.8 | 1205 | 44.3 | 319.0 | 620 |
| Average | NA | NA | NA | NA | NA | 2.0 | 17.2 | 760 | 70.6 | 282.2 | 300 |
Abbreviations: COVID-19, coronavirus disease 2019; NA, not applicable.
There were a total of 301 102 COVID-19 hospitalizations and 5364 pediatric COVID-19 hospitalizations in 22 states during the study period.
Through November 15.
Figure. Trends in Pediatric Percentage of Cumulative Hospitalizations.
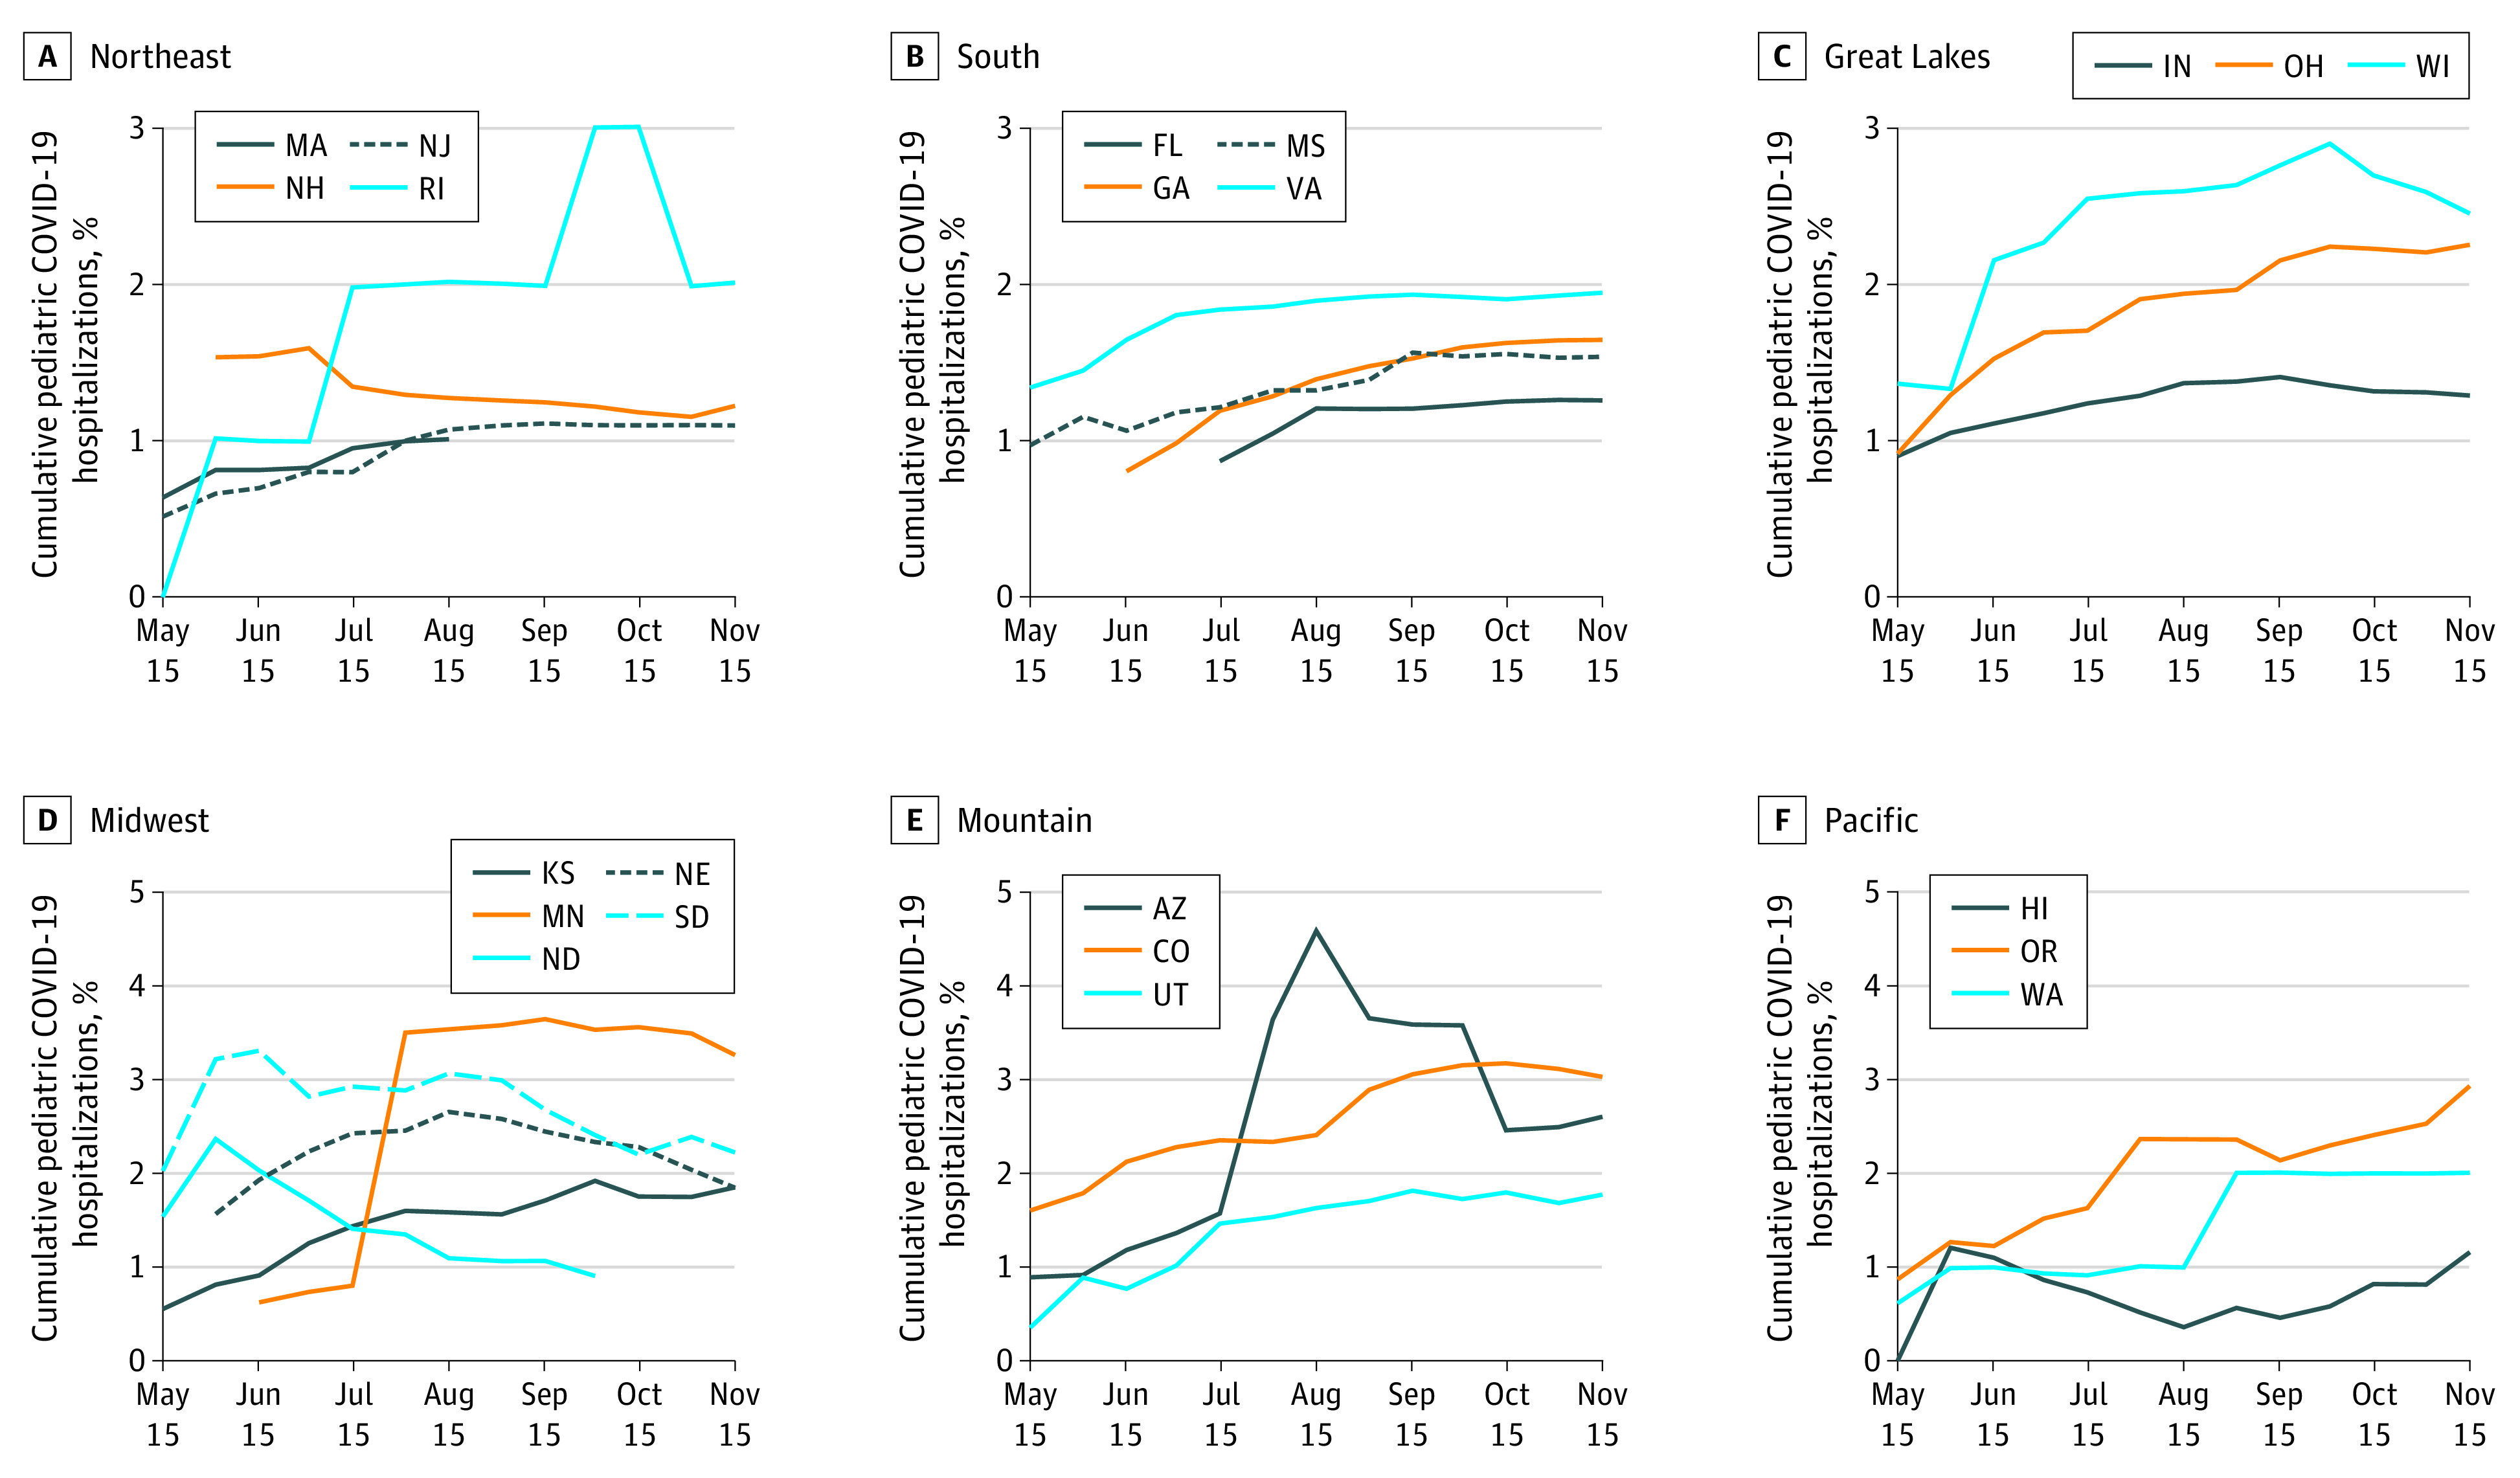
Pediatric percentage of cumulative coronavirus disease 2019 (COVID-19) hospitalizations in 22 states, May 15, 2020, through November 15, 2020.
Discussion
Pediatric hospitalization rates for COVID-19 exhibit significant variation across states and over the course of the pandemic. When ordering the 20 states observed at the end of the study period, most ranked similarly for adult and pediatric hospitalization rates, with some notable exceptions: New Jersey ranked highest for adult hospitalizations in the sample by November 15 but only seventh highest for pediatric hospitalizations. Indiana also had a significant difference, ranking sixth highest for adult hospitalizations but only thirteenth highest for pediatrics. Similarly, Colorado was thirteenth highest for adult but sixth highest for pediatric hospitalizations.
Our results present concerning trends in pediatric hospitalizations. Adult, and especially geriatric, incidence of COVID-19 continues to dominate the national picture, but pediatric populations may require resources that are not readily available across the country. Our study is limited by including only states where breakdown of cumulative hospitalizations by age is available, leaving approximately 56% of states out of the analysis. Still, the states included in our analyses are geographically representative and include more than 29 million children in the United States. As conversations around in-person education continue, hospitalization growth may offer reasons for concern.
References
- 1.University of Minnesota COVID-19 Hospitalization Tracking Project . Accessed December 1, 2020. https://carlsonschool.umn.edu/mili-misrc-covid19-tracking-project
- 2.Census Bureau . Single Year of Age and Sex Population Estimates: April 1, 2010 to July 1, 2019. Accessed December 1, 2020. https://www.census.gov/data/tables/time-series/demo/popest/2010s-state-detail.html