

Abstract
G Protein-Coupled Receptor Kinase-Interacting Protein-1 (GIT1) regulates neuronal functions, including cell and axon migration and synapse formation and maintenance, and GIT1 knockout (KO) mice exhibit learning and memory deficits. We noted that male and female GIT1-KO mice exhibit neuroimaging phenotypes including microcephaly, and altered cortical layering, with a decrease in neuron density in cortical layer V. Micro-CT and magnetic resonance microscopy (MRM) were used to identify morphometric phenotypes for the skulls and throughout the GIT1-KO brains. High field MRM of actively-stained mouse brains from GIT1-KO and wild type (WT) controls (n=6 per group) allowed segmenting 37 regions, based on co-registration to the Waxholm Space atlas. Overall brain size in GIT1-KO mice was ~32 % smaller compared to WT controls. After correcting for brain size, several regions were significantly different in GIT1-KO mice relative to WT, including the gray matter of the ventral thalamic nuclei and the rest of the thalamus, the inferior colliculus, and pontine nuclei. GIT1-KO mice had reduced volume of white matter tracts, most notably in the anterior commissure (~26% smaller), but also in the cerebral peduncle, fornix, and spinal trigeminal tract. On the other hand, the basal ganglia appeared enlarged in GIT1-KO mice, including the globus pallidus, caudate putamen, and particularly the accumbens - supporting a possible vulnerability to addiction. Volume based morphometry based on high-resolution MRM (21.5 μm isotropic voxels) was effective in detecting overall, and local differences in brain volumes in GIT1-KO mice, including in white matter tracts. The reduced relative volume of specific brain regions suggests a critical, but not uniform, role for GIT1 in brain development, conducive to brain microcephaly, and aberrant connectivity.
Keywords: Magnetic resonance microscopy, micro-CT, G Protein-Coupled Receptor Kinase-Interacting Protein-1 (GIT1), morphometry, shape analysis, volume covariance, brain networks
Graphical Abstract
1. Introduction
G Protein-coupled Receptor Kinase-Interacting Protein-1 (GIT1) is GTPase-activating protein (GAP) for the ADP-ribosylation factor (Arf) family of small GTP-binding proteins (Premont, Claing et al. 1998). GIT1 functions most often as a component of a multisubunit complex formed with p21-activated protein kinase (PAK)-interacting guanine nucleotide exchange factor (PIX) proteins (Zhou, Li et al. 2016), which bind to PAK kinases and activate the Rac1 and Cdc42 small GTPases that activate PAKs (Manser, Loo et al. 1998). GIT proteins dimerize and PIX proteins trimerize, and together form oligomeric GIT/PIX complexes (Zhou, Li et al. 2016). The GIT/PIX complex serves as a recruitable scaffold for multiple types of signaling molecules to function as a signal integration center (Zhou, Li et al. 2016). In addition to regulating two distinct families of small GTP-binding proteins, this complex participates in multiple fundamental cellular processes (Zhou, Li et al. 2016). Most prominently, GIT/PIX regulates cytoskeletal organization and focal adhesion–matrix attachment subserving cell motility and migration (Zhou, Li et al. 2016).
GIT/PIX complexes have important functions in the brain. In neurons, GIT1 and PIX function has been shown to be important for axon migration and branching (Zhang, Webb et al. 2003, Zhang, Webb et al. 2005, Dyer, Demarco et al. 2010, Habig, Gellhaar et al. 2013, Santiago-Medina, Gregus et al. 2013), synapse formation (Parnas, Haghighi et al. 2001, Zhang, Webb et al. 2003, Zhang, Webb et al. 2005, Segura, Essmann et al. 2007), regulation of presynaptic neurotransmitter vesicles (Kim, Ko et al. 2003, Podufall, Tian et al. 2014, Montesinos, Dong et al. 2015) and regulation of postsynaptic neurotransmitter receptors (Ko, Kim et al. 2003, Saneyoshi, Wayman et al. 2008). Humans with defects in the X-linked ARHGEF7 (βPIX) or PAK3 genes exhibit X-linked intellectual disability (Allen, Gleeson et al. 1998, Kutsche, Yntema et al. 2000), and these effects have been observed in mouse Arhgef7 and Pak3/Pak1 knockouts (Huang, Zhou et al. 2011, Ramakers, Wolfer et al. 2012). Behavioral studies have revealed that GIT1-KO mice are a model for intellectual disability as well, with defects in fear conditioning (Schmalzigaug, Rodriguiz et al. 2009), operant learning (Menon, Deane et al. 2010), spatial memory (Won, Mah et al. 2011, Martyn, Toth et al. 2018), object recognition (Won, Mah et al. 2011, Martyn, Toth et al. 2018), and working memory (Fass, Lewis et al. 2018). GIT1 deletion also has been shown to result in markedly reduced dendritic length and spine density in the hippocampus (Menon, Deane et al. 2010, Martyn, Toth et al. 2018). These results suggest possible neuroanatomical phenotypes in regions associated with learning and memory (e.g., hippocampus) and fear (e.g., amygdala). However, the role of GIT1 is unlikely to be limited to just these behavioral domains or brain regions. Indeed, based on gross brain size measurements, GIT1-KO mice have been reported to exhibit overall microcephaly attributed to reduced neuron size (Hong and Mah 2015); ARHGEF7/ β-PIX has also been implicated recently in microcephaly (Bellucco, Rodrigues de Oliveira-Junior et al. 2019). Moreover, GIT1 has been proposed to act as a key regulator of bone mass in vivo by regulating osteoclast function (Menon, Yin et al. 2010).
With the present study we aim to complement these cellular and behavioral findings with skull bone shape and structural characteristics, and with neuroanatomical phenotypes. Because of the widespread presence of GIT1 throughout the brain, magnetic resonance imaging (MRI) is suited for generating hypotheses for the effects GIT1 activity across the brain, as it images the whole volume of the undistorted brain.
Previous efforts have pushed the use of high field preclinical MRI for phenotyping mouse models of neurological and psychiatric conditions (Benveniste and Blackband 2002, Natt, Watanabe et al. 2002, Bock, Nieman et al. 2005, Johnson, Ali-Sharief et al. 2007) and laid the foundation for our work. Such developments in imaging technology, animal support and specimen preparation have been reviewed before, e.g. in (Driehuys, Nouls et al. 2008, Badea and Johnson 2013). The next stepping stone has been to incorporate quantitative morphometry (Badea, Ali-Sharief et al. 2007, Johnson, Badea et al. 2011), which usually relies on anatomical priors (Kovačević, Henderson et al. 2005, Badea, Ali-Sharief et al. 2007, Ma, Smith et al. 2008, Aggarwal, Zhang et al. 2010, Johnson, Badea et al. 2010, Calabrese, Badea et al. 2015), and image analysis pipelines using single or multiple MR imaging protocols (Ali, Dale et al. 2005, Sharief, Badea et al. 2008, Friedel, van Eede et al. 2014, Anderson, Cook et al. 2019, Celestine, Nadkarni et al. 2020), relying on image registration and statistical analyses (Wu, Bae et al. 2012). Such developments have helped reveal phenotypes associated with genotype (Badea, Johnson et al. 2009) - some conferring risk for disease (Badea, Johnson et al. 2010, Badea, Kane et al. 2016, Badea, Delpratt et al. 2019, Badea, Wu et al. 2019, Yang, Walder-Christensen et al. 2019), with age (Wadghiri, Blind et al. 2004), or with interventions (Badea, Ng et al. 2019).
Here we have used morphometry to characterize the GIT1-KO neuroanatomical phenotypes, at the level of the whole brain, at the level of brain regions, and voxel-wise. We have examined volume covariance networks, since they are likely to reflect concerted developmental effects in distributed brain regions (Alexander-Bloch, Raznahan et al. 2013), potentially forming connected in subnetworks. Besides morphometry, MRI can provide microstructural information based on differences in image contrast and texture (Badea, Nicholls et al. 2007) using endogenous or exogenous contrast, and also quantitative relaxation parameters, or diffusion parameters (Kelm, West et al. 2016). Like in structural imaging, such measures need to be acquired at high resolution to discriminate fine structural details in the mouse brain, e.g. to discern cellular layers in the cortex or hippocampus. These layers measure on the order of 10–100 μm (Badea, Nicholls et al. 2007, Badea, Johnson et al. 2010), while amyloid plaques measure 10s of μm in models of Alzheimer’s disease (Badea and Johnson 2013). Both hardware improvements, in particular gradient strength and speed, and also acquisition strategies are important to provide sufficient resolutions, with high SNR, and fast. Here we have used partial Fourier acquisitions, with asymmetric sampling, where the receiver gain was sequentially decreased from the edge towards the center of k space during phase encoding steps, increasing dynamic range towards the center, and matching the signal levels (Johnson, Ali-Sharief et al. 2007). This allowed us to obtain 21.5 μm isotropic image resolution in approximately 2 hours for the whole brain.
To detect the neuroanatomical phenotypes present in GIT1-KO mice we have used, besides high field MRI, an in house developed microCT (Badea, Johnston et al. 2008) system to reconstruct images at 88 μm resolution. Our multivariate study demonstrated anatomical phenotypes such as a flatter skull, reduced head, and brain size in mice lacking GIT1. We investigated white matter and cortical layering defects, and main drivers for brain atrophy. Our results starting from macroscopic volumetric changes, and down to the microscopic levels demonstrated for the first time myelin deficiencies through the GIT1-KO brain, suggesting alterations in brain connectivity.
2. Methods
2.1. Mice
GIT1-KO and WT controls were generated by breeding male GIT1−/+ and GIT1−/− mice to female GIT1−/+ mice on a mixed C57 × 129 genetic background (Schmalzigaug et al 2007), since the rate of KO survival to weaning was very low in heterozygote crosses (Schmalzigaug, Rodriguiz et al. 2009) and attempts to create a backcrossed C57BL/6J strain failed due to increased neonatal lethality (Martyn, Toth et al. 2018). All animal procedures were approved by the Duke University Institutional Animal Care and Use Committee (IACUC).
For measuring gross microcephaly, adult (4–10 months of age) male and female GIT1-KO and WT controls were euthanized, and dissected brain and liver were weighed and compared to body weight. N=21 female WT, and 32 female GIT1-KO, 21 male WT and 24 male GIT1-KO (mean age 5.8±1.6 months).
For measuring global and local structural changes in the skull and brain, the same 12 adult male mice at 10–13 weeks of age were imaged using CT and MRI to identify structural differences, 6 for each genotype. The CT and MRI studies were performed at the Duke Center for In Vivo Microscopy. Transcardiac perfusion was used to actively stain the specimens with 1:10 ProHance (Bracco Diagnostics Inc., Princeton, NJ) in 0.9% saline, followed by 1:10 ProHance in 10% formalin (Johnson, Cofer et al. 2002, Johnson, Ali-Sharief et al. 2007). The brain specimens were left within the cranium, and fixed for 12 hours in formalin, then stored in 1:100 ProHance/PBS for 48 hours.
2.2. Micro-CT imaging and analysis
Micro-CT images were acquired using an in house developed system (Badea, Johnston et al. 2008) and reconstructed at 88 μm resolution. We calculated Hounsfield numbers, which estimate physical tissue density through X-ray attenuation, and re-scaled it linearly such that water is set to 0 and air to −1000 Hounsfield units (HU). HUs were compared globally and regionally, and skull shapes were compared using deformation-based morphometry. We used a cross correlation metric for both the affine and diffeomorphic transform, with a kernel radius of 4. We used a SyN parameter of 0.75, and Gaussian regularization of 3 voxels for the update field, and 1 voxel for the total warp. 4000 iterations were allowed at each of the resolution levels. Micro-CT images were analyzed for differences in skull shape and Hounsfield numbers (HU). Shape estimates were based on the deformation between the skulls identified based on the thresholded Hounsfield maps. The threshold-based segmented skulls were mapped to a common template, and genotype specific shape differences were compared through the log Jacobian of the deformation fields required to map individual to the mean deformation template.
The significance of deformation-based morphometric differences was assessed using the Statistical Parametric Mapping (SPM) toolbox, version 12 (Worsley, Poline et al. 1997). All images included in this analysis were first aligned to the average template based on WT controls, and smoothed with a 3 voxel size kernel. Voxel-wise statistics (t maps) were computed for the log Jacobian of the deformation fields between each specimen skull and the template, and also for the Hounsfield numbers. False discovery rate (FDR) corrections were done cluster-wise, allowing for 1–5% false positives.
2.3. Magnetic Resonance Imaging and Analysis
The gadolinium-stained mouse brain specimens from GIT1 knockout (KO) and wild type (WT) controls (N=6 per group) were imaged using high field MRI (9.4T) by placing specimens in fomblin-filled tubes and scanning within the cranium to avoid mechanical distortions. We used an 8.9 cm vertical bore Oxford magnet, with shielded coils providing gradients of up to 2000 mT/m (Resonance Research, Inc. Billerica, MA), controlled by a General Electric (GE Healthcare, Milwaukee, WI) EXCITE console (Epic 11.0). We used a solenoid radiofrequency coil, built in house from a single sheet of microwave substrate (12 mm diameter). Each specimen remained in the same position in the magnet during the entire image acquisition protocol.
We have used a 3D T1w spin echo sequence with the following parameters: echo time (TE) 5.2 ms, repetition time (TR) 50 ms, 62.5 kHz bandwidth, field of view (FOV) of 11 × 11 × 22 mm. Fourier space was sampled asymmetrically at 384 × 384 × 768 locations, with zero filling on one side of the array to 512 × 512 × 1024. The receiver gain was increased at the periphery of Fourier space, to provide an expanded dynamic range and effectively weight (amplify) these higher frequencies during the phase encoding steps. This allowed acquisition of high-resolution images (21.5 μm isotropic) with in 2 h 7 minutes (Johnson, Ali-Sharief et al. 2007).
As a baseline for assessing morphometric changes, we have used an MR atlas to define a common reference for rigid registration, the Waxholm Space (WHS), and priors on 37 manually labeled regions (Johnson, Badea et al. 2010) from the Waxholm Space reference brain. The individual brains were segmented using an image processing pipeline implemented in Perl (Badea, Gewalt et al. 2012) (Anderson, Cook et al. 2019). We used mutual information as a metric for affine registration (32 bins) with histogram matching, 3 and 0.5 regularization parameters, 4 levels with 3000 iterations per level (each of the levels representing a down sampling by a factor of 2), no iterations at the full resolution level. We used cross correlation as a metric (radius 4), SyN 0.5, regularization parameters 1 for the velocity/update field and 0.5 for the total warp, 3000 iterations per level, but no iterations at the full resolution level, for the diffeomorphic registration. The processing pipeline modules perform: a) raw image retrieval from an archive database and conversion to NIFTI format; b) stripping extra cranial tissue using mathematical morphology tools implemented in MATLAB (MathWorks, Natick, MA); c) multivariate registration between the atlas and new brain specimens if applicable. The ANTs registration software (Avants, Duda et al. 2008) (Avants, Tustison et al. 2011a) was used sequentially for: 1) rigid co-registration among images acquired for one specimen; 2) rigid registration to WHS; 3) affine registration between the WHS atlas and the query set, i.e. all images acquired for one specimen, to remove global differences; 4) diffeomorphic registration between the WHS atlas and the query set, to compensate for local differences. Volumes were calculated as voxel volume multiplied by voxel count for the regions defined by the atlas.
Volumes are expressed in mm3, or as percentage of the brain volume, as mean ± standard deviation. We used t-tests to assess the effect of genotype on the volume of each structure, after correcting for overall brain size, and differences were considered significant at FDR corrected p values <0.05.
Automatically generated labels were manually corrected using Avizo (FEI Visualization Sciences Group). Individual brain slices were annotated in all 3 dimensions (1024 × 512 × 512 slices), first outlining the entire brain, and then specific brain regions. To calculate size of brain regions relative to the entire brain, the number of voxels assigned to a region was multiplied with the voxel volume, and divided by the entire brain of the same mouse.
Voxel based morphometry relied on the Statistical Parametric Mapping (SPM) toolbox, version 12 (Worsley, Poline et al. 1997). All images included in this analysis were first aligned to an unbiased template average for the controls, and smoothed with a 3 voxel size kernel. Voxel-wise statistics (t maps) were computed for the log Jacobian of the deformation fields between each of the WT controls and GIT1 KO brains and the average template. False discovery rate (FDR) corrections were done cluster-wise, allowing for 1–5% false positives.
The absolute brain regions volume covariance networks for the two genotypes provided adjacency matrices that were thresholded to 0.5 before we compared graph properties using the Brain Connectivity Toolbox (Rubinov and Sporns 2010), using pairwise t tests for the nodal metrics, including degree, clustering coefficient, eccentricity, and path length.
2.4. Brain staining and immunohistochemistry
For verifying the cortical layering defects, a separate set of mice (N=7 per group; x days of age) was prepared for immunohistochemistry. Brain specimens were fixed by transcardiac perfusion with 4% PFA and saturated with sucrose prior to preparing frozen sections. Floating sections at the level of hippocampus (Bregma −2) were stained with NeuroTrace 530/615 Red Fluorescent Nissl stain (ThermoFisher) and nuclei counterstained with Hoechst 33342 (Thermo Fisher), or were immunostained with anti-NeuN primary antibody (Abcam) and Goat Anti-Rabbit IgG-AlexaFluor 610 (Abcam), prior to immunofluorescent imaging. Neuronal cell bodies were quantified from Nissl-stained cortical sections (40 μm) using FIJI/ImageJ (Schindelin, Arganda-Carreras et al. 2012).
3. Results
We and others have reported that mice lacking GIT1 exhibit substantial perinatal lethality, and that surviving mice remain runted through adulthood (Schmalzigaug, Rodriguiz et al. 2009) (Pang, Hoefen et al. 2009) (Won, Mah et al. 2011). To examine this early mortality more closely, we set up heterozygote breeding pairs with timed breeding and examined pups daily after birth until weaning (Figure 1A). GIT1-KO pups were born at a normal Mendelian ratio (including pups stillborn), but exhibited 90% mortality in the first day after birth. Knockout pups that survived to postnatal day 2 survived to weaning at 21 days. This is in contrast to a prior report where a distinct strain of GIT1-KO mice (a NEO insertion knockout, in contrast to our floxed and markerless knockout) exhibited a near-constant daily chance of post-natal lethality through day 10 after birth, before survival stabilized leaving about 30% of those born as survivors to adulthood (Pang, Hoefen et al. 2009). Note that backcrossing GIT1-KO to the C57BL/6J background reduces survival to near 0% (Won, Mah et al. 2011) (Martyn, Toth et al. 2018), indicating that genetic background is a strong modifier of GIT1 lethality, although the reasons why remain unknown.
Figure 1. Survival of GIT1-deficient pups and adult microcephaly.

Survival of GIT1-KO (KO, red), GIT1-heterozygote (Het, grey) and wildtype (WT, black) pups from birth. Pups resulting from timed breeding of GIT1-Het pairs were scored for survival daily from day of birth until weaning (n=92). Data are plotted as percent of pups born on Day 0 still alive on the indicated day. Differences were assessed by RM-ANOVA followed by Tukey’s posthoc test. (B) Brain weight as % of body weight for adult female WT (n=21) and GIT1-KO (n=32), and for male WT (n=21) and GIT1-KO (n=24) mice. Body weight for adult female WT was 23.2 ±1.5 g and GIT1-KO was 22.7± 2.0 g (n.s.); and for male WT 30.7±5.5 g and GIT1-KO 25.6±2.2 g (t=−4.9, p=1.34*10−5). *, p=1.1E-15 for female WT vs KO, and p=1.5E-05 for male WT vs KO. (C) Liver weight percentage for adult female WT (n=21; age 5.2 ±1.8 months) and GIT1-KO (n=32; age 5.9±1.5 months) and for male WT (n=21; age 6.1±1.6 months) and GIT1-KO (n=24; age 6.1±1.5 months). Differences were assessed by 2-tail t-test. Differences were not significant for female WT vs KO; * p=0.0019 for male WT vs KO.
Although we (Schmalzigaug, Rodriguiz et al. 2009) and others (Menon, Deane et al. 2010) had reported that GIT1-KO brain appears grossly normal, we have observed that brains from GIT1-KO mice consistently appear smaller than expected. Indeed, others have reported that GIT1-KO mice are microcephalic (Hong and Mah 2015). In order to quantify this, we measured the brain:body weight ratio and liver:body weight ratio for adult GIT1-KO mice. Both male and female GIT1-KO mice exhibit significantly reduced brain size for their body weight, compared to WT controls (Figure 1B). Interestingly, microcephaly in female knockouts (33% of WT) was nearly twice that of male knockouts (18% of WT). Comparing liver to body weight, female GIT1-KO were normal, while male GIT1-KO actually had significantly enlarged liver (8% increase) compared to male WT mice (Figure 1C). In comparison the absolute average liver weight was 1.18 ±0.09 g in GIT1-KO females, compared to 1.18 ±0.15 g in WT females (n.s.). GIT1-KO males had liver weight average of 1.34±0.16 g, compared to WT males 1.48±0.2 g (p=0.01; t=−2.5). The average brain weight in females GIT1-KO was 302.5±51.8 g; compared with WT females at 464.8 ±35.3 g (p=3.3*10−17, t=12.6); while male GIT1-KO brain weighted 320.0±55.5 g, compared to WT at 466.7±50.7 g (p=1.3*10−15, t=11.4).
These results on microcephaly were supported by qualitative observation of the skulls size and shape. Micro-CT images for representative animals suggested that GIT1-KO skulls were smaller and flatter relative to age-matched WT controls (Figure 2A). A quantitative analysis of the local skull shapes and HU values performed after deformable registration confirmed that these local differences were significant, and supported our observations of a flatter dorsal and occipital head surface. These analyses showed lower HU values for the occipital areas, and regions above the prefrontal cortex (Figure 2B).
Figure 2. Micro-CT characterization of mouse skulls with respect to size, shape, and density.

A. Micro-CT images of representative GIT1-KO and age-matched WT controls showed qualitative differences in the skull size and shape. The t maps comparing local shapes were FDR corrected at a 5% level, with an initial cluster-forming threshold of 0.01. B. Micro-CT analyses after deformable registration to a population average confirmed significant differences in local shape and Hounsfield units for GIT1-KO animals relative to WT controls. Abbreviations: HU: Hounsfield units.
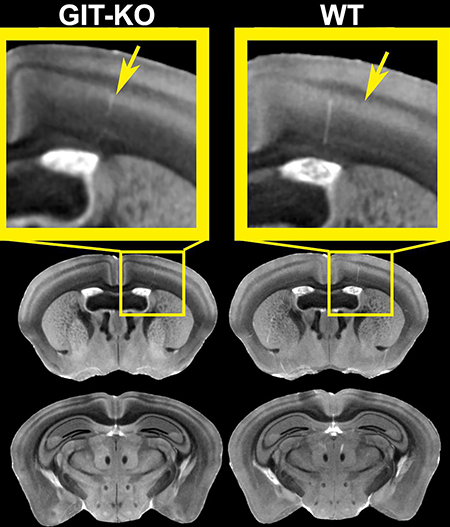
To gain insight into how loss of GIT1 expression results in brain structural changes, which may underlie the skull shape changes, we compared MR images at corresponding locations in representative GIT1-KO and age-matched WT controls. These representative images are shown in Figure 3, next to the group specific averages. The MR images indicated that adult GIT1-KO mice exhibited defects in cortical layering. Particularly, GIT1-KO mice showed reduced local thickness of cortical layers IV and V. Interestingly, adult GIT1-KO mice also have disproportionately small white matter fiber tracts compared to WT mice, in particular in the anterior commissure, and reduced contrast of the hypointense white matter tracts relative to the parenchyma in the MR images, indicative of lower fiber density and/or loss of myelin.
Figure 3. Qualitative structural differences indicative of brain, and in particular cortical layer dysmorphy shown in T1-weighted MR images.

Virtual brain slices from representative GIT1-KO and WT mice, and group averages, arrayed anterior to posterior (from top to bottom). Changes were observed in the cingulate cortex (Cg), and in other areas of the cortex (layer IV, Cx IV; and layer V, Cx V). We also noted reduced white matter (myelinated tracts), in particular in the anterior commissure (ac) and fornix (f), but also cerebral peduncle (cp), fasciculus retroflexus (fr), and medial fasciculus /longitudinal fasciculus of pons (ml/lfp). Abbreviations: AVG: average, aca: anterior branch of the anterior commissure, mtg: mamillo-tegmental tract, Cblm: cerebellum; Olf: olfactory cortex.
The MRI findings on cortical layer alterations were supported by both NeuN immunostaining and Nissl staining (Figure 4A). The decreased layer thickness observed by MRI appears to be due to a significant reduction (19%, t=4.9, p=4.33*10–5, df=26) in the total number of large neuron cell bodies, expected in this layer to be cortical pyramidal neurons (Figure 4B).
Figure 4. Cortical layering defects in GIT1-KO mouse.

(A) Immunohistochemistry and histology of GIT-KO brain slices in cerebral cortex reveals reduced thickness of Layer V. Immunofluorescent staining with NeuN antibody (left) and staining with Nissl plus Hoescht (right). Layers are indicated with dashed lines, and images are 25 μm wide. (B) Quantification of cell bodies in cortical Layer V. 500 μm sections from 2 slices from n=7 WT and KO mice were quantified for Nissl-stained pyramidal cell bodies using ImageJ. Differences were assessed by 2-tail t-test. *, p= 4.3E-5.
Segmenting the entire brain from MRI scans allowed calculation of the total brain volume in situ (Figure 5). As noted for dissected brain weight, brain volume of GIT1-KO mice was significantly reduced by ~30% compared to WT mice of the same age (p<0.001). When this brain volume was adjusted for the body weight of the individual mice used for MRI (age-matched MRI WT mice were 31.5±2.1g and MRI GIT1-KO mice were 27.0±1.7g (p=0.005)), half of this difference in brain volume was accounted for due to overall body runting (14% reduction, p=0.005), leaving an additional 15% reduction (p=0.016) in brain size due to microcephaly.
Figure 5. Qualitative differences between GIT1-KO and WT control were observed in brain overall shape, and selected regions.

(with significant quantitative differences in GIT1-KO mice). Abbreviations: ac: anterior commissure, Acb: accumbens, Amy: amygdala, cp: cerebral peduncle, CPu: caudate putamen, Spt: septum, VThal: ventral thalamic nuclei.
We have used an automated brain region segmentation pipeline (Anderson, Badea 2018) to annotate brain regions by reference to the Waxholm Space brain atlas (Johnson et al, 2010). Due to significant shape distortions compared to the atlas, the automated pipeline was noticeably less accurate on the KO mouse brains, so we manually corrected rlabels before calculating genotype-based differences in volume of multiple brain regions of interest including the anterior commissure, amygdala, accumbens and caudate putamen, shown in Figure 5.
A quantitative characterization of the significant changes surviving FDR correction is shown in Table 1, and Figure 6. GIT1-KO mice had 32% smaller brains than WT controls.
Table 1. Quantitative neuroanatomical phenotypes in GIT1-KO mice relative to WT controls (mean ± standard deviation).
Only regions that have survived the FDR correction, or indicated a trend are shown.
| Abbrev | Region | GIT1 | WT | pFDR | t | d | Diff (%) |
|---|---|---|---|---|---|---|---|
| Brain | Brain | 305.00±15.77 mm3 | 449.22±27.54 mm3 | 2.24E-05 | −11.13 | −6.43 | −32.10 |
| Pn | Pontine Nuclei | 0.20±0.05 % | 0.29±0.04 % | 0.04 | −3.05 | −1.76 | −30.44 |
| IC | Inferior Colliculus | 0.99±0.13 % | 1.20±0.05 % | 0.02 | −3.57 | −2.06 | −17.31 |
| Vthal | Ventral Thalamic Nuclei | 0.58±0.02 % | 0.66±0.05 % | 0.02 | −3.67 | −2.12 | −12.32 |
| DpMe | Deep Mesencephalic Nuclei | 0.53±0.02 % | 0.60±0.02 % | 0.003 | −5.55 | −3.20 | −11.42 |
| Thal | Thalamus Rest | 3.57±0.10 % | 3.80±0.10 % | 0.02 | −3.84 | −2.22 | −5.97 |
| ac | anterior commissure | 0.12 ± 0.02 % | 0.17 ± 0.01 % | 0.003 | −5.31 | −3.07 | −26.12 |
| sp5 | spinal trigeminal | 0.16 ± 0.01 % | 0.18 ± 0.02 % | 0.04 | −2.96 | −1.71 | −13.34 |
| fx | fornix | 0.072 ± 0.004 % | 0.078 ± 0.002 % | 0.04 | −3.03 | −1.75 | −7.57 |
| cp | cerebral peduncle | 0.30 ± 0.01 % | 0.33 ± 0.02 % | 0.05 | −2.81 | −1.62 | −6.71 |
| Acb | Accumbens | 1.00±0.12 % | 0.77±0.12 % | 0.03 | 3.39 | 1.96 | 29.85 |
| CPu | Caudate Putamen | 5.94±0.22 % | 5.02±0.28 % | 0.002 | 6.36 | 3.67 | 18.26 |
| Spt | Septum | 1.13±0.13 % | 0.97±0.03 % | 0.05 | 2.84 | 1.64 | 16.55 |
| Amy | Amygdala | 2.50±0.14 % | 2.24±0.13 % | 0.03 | 3.40 | 1.96 | 11.95 |
| GP | Globus Pallidus | 0.60±0.03 % | 0.54±0.02 % | 0.02 | 3.84 | 2.22 | 11.03 |
| PAG | Periaqueductal Gray | 0.90±0.05 % | 0.97±0.04 % | 0.07 | −2.57 | −1.49 | −7.32 |
| BS | BrainStemRest | 13.43±0.49 % | 14.41±0.82 % | 0.07 | −2.51 | −1.45 | −6.80 |
Figure 6. Significant volume differences between GIT1-KO and WT control mice.

Significant differences were identified in GIT1-KO mice, which had a smaller total brain volume (32%) relative to age matched WT controls, and also smaller relative volume (% of the brain) for the thalamus (ventral thalamic nuclei, and ret of thalamus), and pons, but also inferior colliculus, and deep mesencephalic nuclei (red nucleus). Among white matter tracts the anterior commissure has the largest difference (30% smaller) relative to WT controls. In contrast, the basal ganglia relative volumes were enlarged for the caudate putamen, globus pallidus, accumbens, as well as the septum and amygdala, which are part of the limbic circuitry. Unlabeled y axes denote relative volumes expressed as % of tht total brain volume. FDR corrected p <0.05.
When examining relative changes, expressed as % of the total brain volume, we noted that the largest atrophy for gray matter regions was found in the pontine nuclei and inferior colliculus (>17% smaller), while the accumbens, caudate putamen and septum were enlarged (>17% larger). Among white matter tracts, the anterior commissure showed the largest atrophy (26% smaller), but also the cerebral peduncle, fornix and spinal trigeminal were smaller (~7%). The periaqueductal gray and the rest of the brain stem showed a trend toward reduction (7% smaller in GIT1-KO animals).
We examined network properties for the adjacency matrices resulting from absolute regional volume correlations (Figure 7), and observed differences in the overall degree (774 in GIT1-KO versus 636 non zero entries in the WT adjacency matrix); and node average 20.92±7.15 for GIT1-KO versus 17.19±6.19 for WT mice; p=0.003, CI=[1.36, 6.10], df=36. The same was true for the node clustering coefficient, averaging 0.55±0.10 in GIT1-KO, relative to 0.48±0.07 in WT; p<0.0001, t=4.32, CI=[0.04, 0.1], df=36. We observed lower eccentricity (p=0.001, t=−3.48, CI=[−0.57,−0.15], df=36), corresponding to shorter path lengths (1.98 versus 2.20) in GIT1-KO relative to WT mice.
Figure 7. Graphical analysis of volume covariance patterns revealed significant differences in anatomical brain networks typical of GIT1-KO mice (left) relative to WT controls (right).

See Table 1 and Suppl Table 1 for abbreviations. P<0.05. The colorscale indicates Pearson correlation values.
To examine in more detail the changes in the brain networks, we used voxel-based morphometry (Figure 8). This analysis confirmed that multiple brain regions suffered local atrophy at the same time. Extensive areas of the cortex, thalamus, and hippocampus were involved, and we noted particular layers of the isocortex IV-V and VI were particularly affected. These confirmed the histology findings, and added new hypotheses for layers IV- VI being dysmorphic in GIT1-KO animals.
Figure 8. Voxel-based morphometry identified regional differences in multiple areas of GIT1-KO brains relative to WT controls.

Brain slices, showing the anatomy using a grayscale colormap are arrayed left-to-right, and top-to-bottom from anterior to posterior. The values of the t statistics comparing GIT1-KO and WT are indicated by the colorbar. Local atrophy was identified through voxel-based morphometry (A). This emphasized cortical layer thinning, as well as select local atrophy in regions such as cortical layers IV-VI, anterior commissure (ac), hippocampus (Hc), piriform cortex (Pir), and deep mesencephalic nuclei (DpMe), with extensive clusters over the thalamus (Thal) and cerebellum (Cblm). Local hypertrophy was also detected in cortical layer IV, the accumbens (Acb), caudate putamen (CPu), and amygdala (Amy), as well as in the cerebellum (Cblm) (B). Results were FDR corrected at a 5% level, with an initial cluster-forming threshold of 0.01. On the dorso-caudal axis, the bregma level 0 corresponds to the slice through the anterior commissure in the WT brain template (position 2,2 in the grid).
We noted local atrophy in regions such as olfactory areas, piriform cortex, primary sensory and motor cortex, cortical layers IV-VI, anterior commissure, hippocampus (ventral), deep mesencephalic nuclei, with extensive clusters over the thalamus and cerebellum, and also in the brainstem. Since we have examined morphometric changes remaining after removel of the affince component, local hypertrophy was also detected primarily in the basal ganglia, the accumbens, caudate putamen, and amygdala, as well as in the cortical layer IV, and cerebellum.
4. Discussion
4.1. Major Findings
G Protein–Coupled Receptor Kinase–Interacting Protein-1 (GIT1) has multiple and complex roles. For example, in the brain, it has been shown to regulate neuronal functions including cell and axon migration, as well as synapse formation and maintenance (Zhang, Webb et al. 2003, Schmalzigaug, Phee et al. 2007). GIT1 knockout mice (KO) exhibit learning and memory deficits consistent with mental retardation. GIT1 also has roles in regulating cytoskeleton attachment to matrix through focal adhesions and cell motility (Zhou, Li et al. 2016), and has been implicated in forming and maintaining bone structure (Dong, Yin et al. 2018, Zhao, Kong et al. 2018, Xu, Luo et al. 2019).
Our micro-CT analyses have shown that the lack of GIT1 expression is associated with abnormal skull bone shape and density, and with severe microcephaly. This finding complements the known role of GIT1 in bone modeling and remodeling during osteogenesis coupled with angiogenesis where GIT1 contributes to adjusting VEGF expression in osteoblasts, as well as regulates osteoclast function, and bone mass (Xu, Luo et al. 2019).
We sought supporting evidence for the observed microcephaly and to identify the main drivers in brain regions accounting for it using high resolution MRI. MRI supported these findings and also indicated abnormal cortical layering in the cingulate cortex, as well as in other areas of the isocortex including the primary sensory and motor cortex (S1 and M1), and the piriform cortex (Pir). While the total brain was substantially smaller in GIT1-KO animals compared to WT controls, the pons and inferior colliculi had the largest relative changes (atrophy), suggesting a possible role for the auditory system (Caicedo and Herbert 1993). Besides the auditory sensory system, the pontine nuclei have a role in collecting information from various parts of the cortex and subcortical nuclei to be integrated in the cerebellar cortex. For example, the auditory and visual cortices project to the dorso lateral pontine areas, the motor cortex to the rostral and medial areas, and the somatosensory cortex to its caudal regions (Odeh, Ackerley et al. 2005, Leergaard, Lillehaug et al. 2006). Moreover, such projection may partially overlap in the pontine areas. Subcortical structures including the superior and inferior colliculus, the trigeminal nuclei, and pretectum, and cerebellum also project to the pons (Kosinski, Neafsey et al. 1986, Kratochwil, Maheshwari et al. 2017). The pontine nuclei integrate signals from motor cortex and cerebellum, and projects to spinal cord interneurons and motor neurons through the propriospinal tract (RST). Both the pontine precerebellar nuclei, as well as the cerebellum and deep mesencephalic nuclei (including the red nucleus), showed extensive local atrophy, suggesting potentially altered sensory-motor integration. Large areas of the thalamus, including the ventral nuclei involved in integrating motor control, also were affected.
Besides these regions, the ventral hippocampus also suffered atrophy relative to WT mice. Such a phenotype supports the previously reported learning and memory defects consistent with an intellectual disability model (Martyn, Toth et al. 2018), where stress, emotion and affect can elicit different responses and interfere with the normal function of brain circuits involved in learning and memory(Fanselow and Dong 2010).
Interestingly, an important role for GIT1 is related to recruiting proteins to the synapse, and GIT1 knockout mice have been shown to have decreased dendritic length and spine density (Zhang, Webb et al. 2005, Menon, Deane et al. 2010). Fiuza et al (Fiuza, González-González et al. 2013) showed that juvenile NMDA-type glutamate receptors containing GluN3A subunits regulate spine rearrangements by controlling the function of GIT1, which results in cytoskeletal rearrangements. Binding to GluN3A limits the synaptic targeting of GIT1 and its ability to recruit actin regulators, thus limiting the maturation of nonused synapses.
While our study did not evaluate the direct role of GIT1 on synaptic connectivity, we observed that several white matter tracts, including the anterior commissure and fornix, were notably reduced in GIT1 mice. These white matter tracts showed volume loss, and also reduced Gd staining contrast.
While one study has suggested defects in basal ganglia circuitry leading to impaired inhibitory modulation of the thalamus that manifest as reported ADHD-associated behaviors in GIT1-KO mice (Won, Mah et al. 2011), such behavioral changes were not seen in our distinct strain of GIT1-KO mice (Martyn, Toth et al. 2018), consistent with similar conclusions by others (Klein, van der Voet et al. 2015). Unlike Lim et al. (Lim and Mah 2015), we did however find structural changes in the basal ganglia, which occupied a relatively larger area as a percentage of GIT1-KO brain size compared to WT controls. Since the basal ganglia, septum and amygdala were enlarged, our findings thus do not align to ADHD-associated volume loss reported in these regions (Qiu, Crocetti et al. 2009). An enlarged amygdala however, may be connected to the impaired responses to fear conditioning and fear-potentiated startle (Schmalzigaug, Rodriguiz et al. 2009). The septum, which we also found significantly enlarged, has also been linked to expression of the fear response. Interestingly, both the septal connections and the accumbens changes may be supportive of a possible addiction related phenotype.
Our volume covariance network analyses suggest that differences in axonal connectivity between cortical regions may result in altered trophic effects on regional growth in regions that cluster in connected subgraphs. The nodes with the largest differences in degree of connectivity included, besides the isocortex, the cerebellum, deep mesencephalic nuclei, thalamic nuclei, the hippocampus and amygdala; while the fimbria ranked 5th. Thus, the basal ganglia, cerebellum, as well as regions commonly associated with learning and memory (hippocampus, amygdala), and their connecting fibers, showed phenotypes at the level of brain networks, helping discriminate GIT1-KO from WT mice. Overall, our examination of the volume covariance patterns across the brain suggest that structural changes are not occurring independently; rather they happen in a concerted action, spanning several brain networks in GIT1-KO, and these may include distinct cell populations located in distinct cortical layers.
Cortical thinning has been associated in humans to lower cognitive performance. Loss of layer VI neurons would involve disturbances in the corticothalamic circuits. Loss of layer V neurons would involve loss of the cortico-cortical, but also cortical-subcortical connections. Deficits in connectivity to the internal capsule and brainstem and to the corticospinal tract, may result in problems with voluntary motor control, as in Huntington’s disease (Goehler, Lalowski et al. 2004). Deficits in the cortical to basal ganglia connectivity can results in deficits with procedural learning, cognition (Stocco, Lebiere et al. 2010), and emotion, supported by our findings on fear conditioning deficits in these mice (Schmalzigaug, Rodriguiz et al. 2009).
Our previous study (Martyn, Toth et al. 2018) identified reduced spine density in the hippocampal CA1 neurons, and cortical layer V, providing evidence that GIT1 functions within postsynaptic spines to help regulate proper cytoskeletal rearrangements underlying structural plasticity after synaptic activation. Our current study supports such findings through atrophy in the hippocampus and cortical layer V, and thus a role of GIT1 in synaptic plasticity during learning.
4.2. Other Imaging and Analysis Considerations for Neuroanatomical Phenotyping
MRI based contrast differences are largely due to differences in tissue composition (water and lipid content), as well as cellular density. While white matter to gray matter contrast is rather strong in our MR images, we have previously demonstrated gray matter layer-based changes at 21.5 μm resolution in mouse models of schizophrenia (Badea, Nicholls et al. 2007) and Alzheimer’s disease (Badea, Johnson et al. 2010) using comparable image resolutions. We demonstrated texture and size changes for cellular layers in the hippocampus, for both the pyramidal and granule cell layers which ranged in size from ~60–70 μm for the granule cell layer to 100–200 μm for stratum radiatum, while the primary somatosensory cortex thickness ranged from 800 μm in the Reln-KO to 1400 μm for control AD mice. The significant differences between corresponding hippocampal layers ranged from 30 μm to 100 μm for the granule cell layers and stratum radiatum respectively. The S1 cortical thickness differences between mouse models of AD and controls were ~120–130 μm and 200 μm between Reln-KO and WT controls. This underscores the need for spatial resolution. While we have not directly evaluated the thickness of the anterior commissure, made up normally of myelinated axons we were able to observe significant volume changes (and visible thinning), as well as lower contrast relative to gray matter, denoting defects in myelination.
White matter, made of tightly packed axons surrounded by lipid rich myelin shows increased contrast in T1 weighted images because it does not take as much Gd as the surrounding parenchyma, where shorter T1 caused by increased uptake of Gd causes signal to be brighter. Other effects besides Gd uptake may also affect contrast, including reduced axonal diameter (1/T1 ~ axonal diameter) (Harkins, Xu et al. 2016), myelin (longer T1 corresponding to demyelination) (Thiessen, Zhang et al. 2013), and density may also change contrast for white matter tracts. Considering that these differences are from 1.3 s for myelinated tracts, to 1.5 s for gray matter or cuprizone treated white matter tracts at 7T, or 200 ms (Thiessen, Zhang et al. 2013), while Gd causes a shortening of T1 to ~100 ms we suggest that such effects are rather likely smaller than the Gd effects.
We recognize the challenges coming from segmenting a mouse brain that has substantially different anatomy than the anatomical atlas references. Figure 9 shows challenging brain size and shape differences are accompanied by a lower contrast for the anterior commissure. We have thus aimed to optimize and evaluate segmentation accuracy, which depends on the accuracy of registration as well as on the suitability of anatomical priors in our reference atlas. We have evaluated segmentation accuracy through Dice coefficients in 4 brains (two controls, and two GIT1-KO) for two larger nuclei - the caudate putamen 89±2%, and hippocampus 88±1%; and also for smaller nuclei – the substantia nigra 83±5%, and a white matter tract - the anterior commissure 64±13%.
Figure 9. Size, shape and contrast differences constitute challenges for segmenting a mouse strain that has substantially different anatomy than the anatomical atlas references.

(A). Note the size and shape difference between WT and GIT1-KO were accompanied by lower contrast for the anterior commissure (B, shown in blue).
The average difference between the most accurately segmented control brain structure and the GIT1-KO labels ranged from 3% for the caudate putamen and hippocampus, to 10% for the substantia nigra and 25% for the anterior commissure. With the exception of the anterior commissure, these values are comparable to the accuracy of segmenting control brains. The anterior commissure manual label priors were sufficiently different that we aimed to improve the results of automated segmentation using manual edits. Alternatively, future studies should consider developing population/strain specific atlases for challenging studies.
4.3. Limitations
While in vivo MRI would more accurately represent the physiological brain environment, and there are concerns related to equivalence between in vivo and ex vivo measurements (Badea, Ng et al. 2019), detecting morphometric differences for thin white matter tracts or at the level of cellular layers requires high spatial resolution, at levels not currently achievable in vivo for the whole brain. We remain hopeful that future advances will lead to accelerating imaging protocols, such as translating those using compressed sensing in ex vivo specimens (Anderson, Wang et al. 2018, Wang, Anderson et al. 2018) to enable accurate measurements in vivo.
Reduction in white matter tracts suggests demyelination, but we have not directly evaluated myelination here. However, GIT1 has been identified as part of the substrates for substrates for protein tyrosine phosphatases ζ (Kawachi, Fujikawa et al. 2001), whose downregulation promotes remyelination in demyelinated lesions (Fujikawa and Noda 2016). Further studies will be needed to evaluate myelination and axonal density contributions to the reduced contrast we observed for the white matter tracts.
MRI accounts for larger areas than histology and immunohistochemistry, which can generate valid hypotheses expanding upon the point-based measurements in IHC, we also need to acknowledge that the lower resolution of MRI relative to histology, as well as voxel smoothing may result in large clusters, overlapping more than one cortical layer. Since our MRI images are from only 6 male mice, we cannot address sex-based differences. Nevertheless, our MRI images are some of the highest resolution reported, and it is apparent that we can distinguish distinct cortical layers that differ from control mice, and these MRI findings were supported by direct histological measures.
5. Conclusion
We have identified structural skull and brain changes resulting from the absence of GIT1, and these support an altered sensory-motor integration through volume loss in the cortico-pontine-cerebellar circuitry, impaired learning and memory though hippocampal loss, and overall loss of brain connectivity in groups of brain regions, due to reduced fiber density, myelination, or both. Particularly interesting are the layer-based changes which may support the role of GIT1 in cell migration (Lucanic and Cheng 2008). These results should inform future studies to understand the function of GIT1 in overall nervous system development.
Supplementary Material
Supplementary Table 1. Abbreviations for the segmented brain regions.
Highlights.
Micro-CT revealed microcephaly, significant differences in local skull shape and Hounsfield units for GIT1-KO animals relative to WT controls.
MRI and deformation based morphometry supported microcephaly findings, and identified main drivers for brain atrophy.
Mice lacking GIT1 have white matter and cortical layering defects
GIT1 has a critical but not uniform role in brain development, pointing to aberrant connectivity
High resolution MRI distinguishes cortical layers in GIT1-KO mice and WT controls..
Acknowledgements
We thank undergraduate researchers Scott Rong and Shannon McCarthy for assistance with manual segmentation. Supported by NIH R21 MH090556 and Department of Defense Medical Research and Development Program (DMRDP) contract W81XWH-11-2-0112 to RTP, and K01 AG041211, RF1 AG057895, and R01 AG066184 to AB. CIVM was supported by P41 EB015897 until 2018, and since then has been supported by U24 CA220245.
Abbreviation Region
- ac
anterior commissure
- Acb
Accumbens
- Amy
Amygdala
- APT
AnteriorPretectalNucleus
- Aq
Aqueduct
- Brain
Brain
- BS
BrainStemRest
- Cblm
Cerebellum
- cc
CorpusCallosum
- CN
CochlearNuclei
- cp
cerebral peduncle
- CPu
Caudate Putamen
- Cx
Cortex
- DpMed
Deep Mesencephalic Nuclei
- fi
fimbria
- fx
fornix
- GP
Globus Pallidus
- Hc
Hippocampus
- Hyp
Hypothalamus
- IC
Inferior Colliculus
- ic
InternalCapsule
- IPed
InterpeduncularNucleus
- LDThal
LateroDorsalNucleusThalamus
- LGN
LateralGeniculate
- ll
LateralLemniscus
- MGN
MedialGeniculate
- Olf
OlfactoryAreas
- ot
OpticTract
- PAG
PeriaqueductalGray
- Pi
PinealGland
- Pn
Pontine Nuclei
- SC
SuperiorColliculus
- SN
SubstantiaNigra
- sp5
spinaltrigeminal
- Spt
Septum
- Thal
Thalamus Rest
- VS
VentricularSystem
- Vthal
Ventral Thalamic Nuclei
Footnotes
Publisher's Disclaimer: This is a PDF file of an unedited manuscript that has been accepted for publication. As a service to our customers we are providing this early version of the manuscript. The manuscript will undergo copyediting, typesetting, and review of the resulting proof before it is published in its final form. Please note that during the production process errors may be discovered which could affect the content, and all legal disclaimers that apply to the journal pertain.
References
- 1.Aggarwal M, Zhang J and Mori S (2010). Magnetic resonance imaging-based mouse brain atlas and its applications. Methods in Molecular Biology. 711: 251–270. [DOI] [PubMed] [Google Scholar]
- 2.Alexander-Bloch A, Raznahan A, Bullmore E and Giedd J (2013). “The Convergence of Maturational Change and Structural Covariance in Human Cortical Networks.” The Journal of Neuroscience 33(7): 2889. [DOI] [PMC free article] [PubMed] [Google Scholar]
- 3.Ali AA, Dale AM, Badea A and Johnson GA (2005). “Automated segmentation of neuroanatomical structures in multispectral MR microscopy of the mouse brain.” NeuroImage 27(2): 425–435. [DOI] [PubMed] [Google Scholar]
- 4.Allen KM, Gleeson JG, Bagrodia S, Partington MW, MacMillan JC, Cerione RA, Mulley JC and Walsh CA (1998). “PAK3 mutation in nonsyndromic X-linked mental retardation.” Nat Genet 20(1): 25–30. [DOI] [PubMed] [Google Scholar]
- 5.Anderson RJ, Cook JJ, Delpratt N, Nouls JC, Gu B, McNamara JO, Avants BB, Johnson GA and Badea A (2019). “Small Animal Multivariate Brain Analysis (SAMBA) - a High Throughput Pipeline with a Validation Framework.” Neuroinformatics 17(3): 451–472. [DOI] [PMC free article] [PubMed] [Google Scholar]
- 6.Anderson RJ, Cook JJ, Delpratt N, Nouls JC, Gu B, McNamara JO, Avants BB, Johnson GA and Badea A (2019). “Small animal multivariate brain analysis (SAMBA)–a high throughput pipeline with a validation framework.” Neuroinformatics 17(3): 451–472. [DOI] [PMC free article] [PubMed] [Google Scholar]
- 7.Anderson RJ, Wang N, Cook JJ, Cofer GP, Dibb R, Johnson GA and Badea A (2018). A High Performance Computing Cluster Implementation Of Compressed Sensing Reconstruction For MR Histology [Google Scholar]
- 8.ISMRM, Paris, FR. [Google Scholar]
- 9.Badea A, Ali-Sharief A and Johnson GA (2007). “Morphometric analysis of the C57BL/6J mouse brain.” Neuroimage 37(3): 683–693. [DOI] [PMC free article] [PubMed] [Google Scholar]
- 10.Badea A, Ali-Sharief AA and Johnson GA (2007). “Morphometric analysis of the C57BL/6J mouse brain.” NeuroImage 37(3): 683–693. [DOI] [PMC free article] [PubMed] [Google Scholar]
- 11.Badea A, Delpratt NA, Anderson R, Dibb R, Qi Y, Wei H, Liu C, Wetsel WC, Avants BB and Colton C (2019). “Multivariate MR biomarkers better predict cognitive dysfunction in mouse models of Alzheimer’s disease.” Magnetic resonance imaging 60: 52–67. [DOI] [PMC free article] [PubMed] [Google Scholar]
- 12.Badea A and Johnson GA (2013). “Magnetic resonance microscopy.” Stud Health Technol Inform 185: 153–184. [PubMed] [Google Scholar]
- 13.Badea A, Johnson GA and Jankowsky JL (2010). “Remote sites of structural atrophy predict later amyloid formation in a mouse model of Alzheimer’s disease.” Neuroimage 50(2): 416–427. [DOI] [PMC free article] [PubMed] [Google Scholar]
- 14.Badea A, Johnson GA and Williams RW (2009). “Genetic dissection of the mouse CNS using magnetic resonance microscopy.” Current opinion in neurology 22(4): 379. [DOI] [PMC free article] [PubMed] [Google Scholar]
- 15.Badea A, Kane L, Anderson RJ, Qi Y, Foster M, Cofer GP, Medvitz N, Buckley AF, Badea AK and Wetsel WC (2016). “The fornix provides multiple biomarkers to characterize circuit disruption in a mouse model of Alzheimer’s disease.” Neuroimage 142: 498–511. [DOI] [PMC free article] [PubMed] [Google Scholar]
- 16.Badea A, Ng KL, Anderson RJ, Zhang J, Miller MI and O’Brien RJ (2019). “Magnetic resonance imaging of mouse brain networks plasticity following motor learning.” PloS one 14(5): e0216596. [DOI] [PMC free article] [PubMed] [Google Scholar]
- 17.Badea A, Nicholls PJ, Johnson GA and Wetsel WC (2007). “Neuroanatomical phenotypes in the reeler mouse.” Neuroimage 34(4): 1363–1374. [DOI] [PMC free article] [PubMed] [Google Scholar]
- 18.Badea A, Nicholls PJ, Johnson GA and Wetsel WC (2007). “Neuroanatomical phenotypes in the reeler mouse.” Neuroimage 34(4): 1363–1374. [DOI] [PMC free article] [PubMed] [Google Scholar]
- 19.Badea A, Wu W, Shuff JM, Wang M, Anderson RJ, Qi Y, Johnson GA, Wilson JG, Koudoro S and Garyfallidis E (2019). “Identifying vulnerable brain networks in mouse models of genetic risk factors for late onset Alzheimer’s disease.” Frontiers in Neuroinformatics 13: 72. [DOI] [PMC free article] [PubMed] [Google Scholar]
- 20.Badea CT, Johnston S, Johnson B, Lin M, Hedlund LW and Johnson GA (2008). “A dual micro-CT system for small animal imaging.” Proceedings of SPIE--the International Society for Optical Engineering 6913: 691342–691342. [DOI] [PMC free article] [PubMed] [Google Scholar]
- 21.Badea CT, Johnston S, Johnson B, Lin M, Hedlund LW and Johnson GA (2008). A dual micro-CT system for small animal imaging. Proc.SPIE. [DOI] [PMC free article] [PubMed] [Google Scholar]
- 22.Bellucco FT, Rodrigues de Oliveira-Junior H, Santos Guilherme R, Bragagnolo S, Alvarez Perez AB, Ayres Meloni V and Melaragno MI (2019). “Deletion of Chromosome 13 due to Different Rearrangements and Impact on Phenotype.” Mol Syndromol 10(3): 139–146. [DOI] [PMC free article] [PubMed] [Google Scholar]
- 23.Benveniste H and Blackband S (2002). “MR microscopy and high resolution small animal MRI: applications in neuroscience research.” Prog Neurobiol 67(5): 393–420. [DOI] [PubMed] [Google Scholar]
- 24.Bock NA, Nieman BJ, Bishop JB and Henkelman RM (2005). “In vivo multiple-mouse MRI at 7 Tesla.” Magnetic Resonance in Medicine 54(5): 1311–1316. [DOI] [PubMed] [Google Scholar]
- 25.Caicedo A and Herbert H (1993). “Topography of descending projections from the inferior colliculus to auditory brainstem nuclei in the rat.” J Comp Neurol 328(3): 377–392. [DOI] [PubMed] [Google Scholar]
- 26.Calabrese E, Badea A, Cofer G, Qi Y and Johnson GA (2015). “A Diffusion MRI Tractography Connectome of the Mouse Brain and Comparison with Neuronal Tracer Data.” Cereb Cortex 25(11): 4628–4637. [DOI] [PMC free article] [PubMed] [Google Scholar]
- 27.Celestine M, Nadkarni NA, Garin CM, Bougacha S and Dhenain M (2020). “Sammba-MRI: A Library for Processing SmAll-MaMmal BrAin MRI Data in Python.” Frontiers in Neuroinformatics 14. [DOI] [PMC free article] [PubMed] [Google Scholar]
- 28.Dong X, Yin J, Yun B, Lü B and Yin G (2018). “Research on influence mechanism of G protein coupled receptor kinase interacting protein 1 on differentiation of bone marrow mesenchymal stem cells into endothelial cells.” Zhongguo xiu fu chong jian wai ke za zhi = Zhongguo xiufu chongjian waike zazhi = Chinese journal of reparative and reconstructive surgery 32(3): 257–263. [DOI] [PMC free article] [PubMed] [Google Scholar]
- 29.Driehuys B, Nouls J, Badea A, Bucholz E, Ghaghada K, Petiet A and Hedlund LW (2008). “Small animal imaging with magnetic resonance microscopy.” ILAR journal 49(1): 35–53. [DOI] [PMC free article] [PubMed] [Google Scholar]
- 30.Dyer JO, Demarco RS and Lundquist EA (2010). “Distinct roles of Rac GTPases and the UNC-73/Trio and PIX-1 Rac GTP exchange factors in neuroblast protrusion and migration in C. elegans.” Small GTPases 1(1): 44–61. [DOI] [PMC free article] [PubMed] [Google Scholar]
- 31.Fanselow MS and Dong H-W (2010). “Are the dorsal and ventral hippocampus functionally distinct structures?” Neuron 65(1): 7–19. [DOI] [PMC free article] [PubMed] [Google Scholar]
- 32.Fass DM, Lewis MC, Ahmad R, Szucs MJ, Zhang Q, Fleishman M, Wang D, Kim MJ, Biag J, Carr SA, Scolnick EM, Premont RT and Haggarty SJ (2018). “Brain-Specific Deletion of GIT1 Impairs Cognition and Alters Phosphorylation of Synaptic Protein Networks Implicated in Schizophrenia Susceptibility.” bioRxiv: 290312. [DOI] [PMC free article] [PubMed] [Google Scholar]
- 33.Fiuza M, González-González I and Pérez-Otaño I (2013). “GluN3A expression restricts spine maturation via inhibition of GIT1/Rac1 signaling.” Proceedings of the National Academy of Sciences 110(51): 20807. [DOI] [PMC free article] [PubMed] [Google Scholar]
- 34.Friedel M, van Eede MC, Pipitone J, Chakravarty MM and Lerch JP (2014). “Pydpiper: a flexible toolkit for constructing novel registration pipelines.” Front Neuroinform 8: 67. [DOI] [PMC free article] [PubMed] [Google Scholar]
- 35.Fujikawa A and Noda M (2016). “Role of pleiotrophin-protein tyrosine phosphatase receptor type Z signaling in myelination.” Neural Regen Res 11(4): 549–551. [DOI] [PMC free article] [PubMed] [Google Scholar]
- 36.Goehler H, Lalowski M, Stelzl U, Waelter S, Stroedicke M, Worm U, Droege A, Lindenberg KS, Knoblich M, Haenig C, Herbst M, Suopanki J, Scherzinger E, Abraham C, Bauer B, Hasenbank R, Fritzsche A, Ludewig AH, Buessow K, Coleman SH, Gutekunst C-A, Landwehrmeyer BG, Lehrach H and Wanker EE (2004). “A Protein Interaction Network Links GIT1, an Enhancer of Huntingtin Aggregation, to Huntington’s Disease.” Molecular Cell 15(6): 853–865. [DOI] [PubMed] [Google Scholar]
- 37.Habig K, Gellhaar S, Heim B, Djuric V, Giesert F, Wurst W, Walter C, Hentrich T, Riess O and Bonin M (2013). “LRRK2 guides the actin cytoskeleton at growth cones together with ARHGEF7 and Tropomyosin 4.” Biochim Biophys Acta 1832(12): 2352–2367. [DOI] [PubMed] [Google Scholar]
- 38.Harkins KD, Xu J, Dula AN, Li K, Valentine WM, Gochberg DF, Gore JC and Does MD (2016). “The microstructural correlates of T1 in white matter.” Magnetic resonance in medicine 75(3): 1341–1345. [DOI] [PMC free article] [PubMed] [Google Scholar]
- 39.Hong ST and Mah W (2015). “A Critical Role of GIT1 in Vertebrate and Invertebrate Brain Development.” Exp Neurobiol 24(1): 8–16. [DOI] [PMC free article] [PubMed] [Google Scholar]
- 40.Huang W, Zhou Z, Asrar S, Henkelman M, Xie W and Jia Z (2011). “p21-Activated kinases 1 and 3 control brain size through coordinating neuronal complexity and synaptic properties.” Mol Cell Biol 31(3): 388–403. [DOI] [PMC free article] [PubMed] [Google Scholar]
- 41.Johnson GA, Ali-Sharief A, Badea A, Brandenburg J, Cofer G, Fubara B, Gewalt S, Hedlund LW and Upchurch L (2007). “High-throughput morphologic phenotyping of the mouse brain with magnetic resonance histology.” NeuroImage 37(1): 82–89. [DOI] [PMC free article] [PubMed] [Google Scholar]
- 42.Johnson GA, Badea A, Brandenburg J, Cofer G, Fubara B, Liu S and Nissanov J (2010). “Waxholm space: an image-based reference for coordinating mouse brain research.” Neuroimage 53(2): 365–372. [DOI] [PMC free article] [PubMed] [Google Scholar]
- 43.Johnson GA, Badea A and Jiang Y (2011). “Quantitative neuromorphometry using magnetic resonance histology.” Toxicologic pathology 39(1): 85–91. [DOI] [PMC free article] [PubMed] [Google Scholar]
- 44.Kawachi H, Fujikawa A, Maeda N and Noda M (2001). “Identification of GIT1/Cat-1 as a substrate molecule of protein tyrosine phosphatase zeta /beta by the yeast substrate-trapping system.” Proceedings of the National Academy of Sciences of the United States of America 98(12): 6593–6598. [DOI] [PMC free article] [PubMed] [Google Scholar]
- 45.Kelm ND, West KL, Carson RP, Gochberg DF, Ess KC and Does MD (2016). “Evaluation of diffusion kurtosis imaging in ex vivo hypomyelinated mouse brains.” NeuroImage 124: 612–626. [DOI] [PMC free article] [PubMed] [Google Scholar]
- 46.Kim S, Ko J, Shin H, Lee JR, Lim C, Han JH, Altrock WD, Garner CC, Gundelfinger ED, Premont RT, Kaang BK and Kim E (2003). “The GIT family of proteins forms multimers and associates with the presynaptic cytomatrix protein Piccolo.” J Biol Chem 278(8): 6291–6300. [DOI] [PubMed] [Google Scholar]
- 47.Klein M, van der Voet M, Harich B, van Hulzen KJE, Onnink AMH, Hoogman M, Guadalupe T, Zwiers M, Groothuismink JM, Verberkt A, Nijhof B, Castells-Nobau A, Faraone SV, Buitelaar JK, Schenck A, Arias-Vasquez A, Franke B and Psychiatric Genomics Consortium AWG (2015). “Converging evidence does not support GIT1 as an ADHD risk gene.” American Journal of Medical Genetics Part B: Neuropsychiatric Genetics 168(6): 492–507. [DOI] [PMC free article] [PubMed] [Google Scholar]
- 48.Ko J, Kim S, Valtschanoff JG, Shin H, Lee JR, Sheng M, Premont RT, Weinberg RJ and Kim E (2003). “Interaction between liprin-alpha and GIT1 is required for AMPA receptor targeting.” J Neurosci 23(5): 1667–1677. [DOI] [PMC free article] [PubMed] [Google Scholar]
- 49.Kosinski RJ, Neafsey EJ and Castro AJ (1986). “A comparative topographical analysis of dorsal column nuclear and cerebral cortical projections to the basilar pontine gray in rats.” Journal of Comparative Neurology 244(2): 163–173. [DOI] [PubMed] [Google Scholar]
- 50.Kovačević N, Henderson JT, Chan E, Lifshitz N, Bishop J, Evans AC, Henkelman RM and Chen XJ (2005). “A three-dimensional MRI atlas of the mouse brain with estimates of the average and variability.” Cerebral Cortex 15(5): 639–645. [DOI] [PubMed] [Google Scholar]
- 51.Kratochwil CF, Maheshwari U and Rijli FM (2017). “The Long Journey of Pontine Nuclei Neurons: From Rhombic Lip to Cortico-Ponto-Cerebellar Circuitry.” Front Neural Circuits 11: 33. [DOI] [PMC free article] [PubMed] [Google Scholar]
- 52.Kutsche K, Yntema H, Brandt A, Jantke I, Nothwang HG, Orth U, Boavida MG, David D, Chelly J, Fryns JP, Moraine C, Ropers HH, Hamel BC, van Bokhoven H and Gal A (2000). “Mutations in ARHGEF6, encoding a guanine nucleotide exchange factor for Rho GTPases, in patients with X-linked mental retardation.” Nat Genet 26(2): 247–250. [DOI] [PubMed] [Google Scholar]
- 53.Leergaard TB, Lillehaug S, De Schutter E, Bower JM and Bjaalie JG (2006). “Topographical organization of pathways from somatosensory cortex through the pontine nuclei to tactile regions of the rat cerebellar hemispheres.” European Journal of Neuroscience 24(10): 2801–2812. [DOI] [PubMed] [Google Scholar]
- 54.Lim S-Y and Mah W (2015). “Abnormal Astrocytosis in the Basal Ganglia Pathway of Git1−/− Mice.” Molecules and cells 38. [DOI] [PMC free article] [PubMed] [Google Scholar]
- 55.Lucanic M and Cheng HJ (2008). “A RAC/CDC-42-independent GIT/PIX/PAK signaling pathway mediates cell migration in C. elegans.” PLoS Genet 4(11): e1000269. [DOI] [PMC free article] [PubMed] [Google Scholar]
- 56.Ma Y, Smith D, Hof PR, Foerster B, Hamilton S, Blackband SJ, Yu M and Benveniste H (2008). “In vivo 3D digital atlas database of the adult C57BL/6J mouse brain by magnetic resonance microscopy.” Frontiers in Neuroanatomy 2(APR). [DOI] [PMC free article] [PubMed] [Google Scholar]
- 57.Manser E, Loo TH, Koh CG, Zhao ZS, Chen XQ, Tan L, Tan I, Leung T and Lim L (1998). “PAK kinases are directly coupled to the PIX family of nucleotide exchange factors.” Mol Cell 1(2): 183–192. [DOI] [PubMed] [Google Scholar]
- 58.Martyn AC, Toth K, Schmalzigaug R, Hedrick NG, Rodriguiz RM, Yasuda R, Wetsel WC and Premont RT (2018). “GIT1 regulates synaptic structural plasticity underlying learning.” PLoS One 13(3): e0194350. [DOI] [PMC free article] [PubMed] [Google Scholar]
- 59.Martyn AC, Toth K, Schmalzigaug R, Hedrick NG, Rodriguiz RM, Yasuda R, Wetsel WC and Premont RT (2018). “GIT1 regulates synaptic structural plasticity underlying learning.” PloS one 13(3): e0194350–e0194350. [DOI] [PMC free article] [PubMed] [Google Scholar]
- 60.Menon P, Deane R, Sagare A, Lane SM, Zarcone TJ, O’Dell MR, Yan C, Zlokovic BV and Berk BC (2010). “Impaired spine formation and learning in GPCR kinase 2 interacting protein-1 (GIT1) knockout mice.” Brain Res 1317: 218–226. [DOI] [PMC free article] [PubMed] [Google Scholar]
- 61.Menon P, Yin G, Smolock EM, Zuscik MJ, Yan C and Berk BC (2010). “GPCR kinase 2 interacting protein 1 (GIT1) regulates osteoclast function and bone mass.” Journal of cellular physiology 225(3): 777–785. [DOI] [PMC free article] [PubMed] [Google Scholar]
- 62.Montesinos MS, Dong W, Goff K, Das B, Guerrero-Given D, Schmalzigaug R, Premont RT, Satterfield R, Kamasawa N and Young SM Jr. (2015). “Presynaptic Deletion of GIT Proteins Results in Increased Synaptic Strength at a Mammalian Central Synapse.” Neuron 88(5): 918–925. [DOI] [PMC free article] [PubMed] [Google Scholar]
- 63.Natt O, Watanabe T, Boretius S, Radulovic J, Frahm J and Michaelis T (2002). “High-resolution 3D MRI of mouse brain reveals small cerebral structures in vivo.” Journal of Neuroscience Methods 120(2): 203–209. [DOI] [PubMed] [Google Scholar]
- 64.Odeh F, Ackerley R, Bjaalie JG and Apps R (2005). “Pontine Maps Linking Somatosensory and Cerebellar Cortices Are in Register with Climbing Fiber Somatotopy.” The Journal of Neuroscience 25(24): 5680–5690. [DOI] [PMC free article] [PubMed] [Google Scholar]
- 65.Pang J, Hoefen R, Pryhuber GS, Wang J, Yin G, White RJ, Xu X, O’Dell MR, Mohan A, Michaloski H, Massett MP, Yan C and Berk BC (2009). “G-protein-coupled receptor kinase interacting protein-1 is required for pulmonary vascular development.” Circulation 119(11): 1524–1532. [DOI] [PMC free article] [PubMed] [Google Scholar]
- 66.Parnas D, Haghighi AP, Fetter RD, Kim SW and Goodman CS (2001). “Regulation of postsynaptic structure and protein localization by the Rho-type guanine nucleotide exchange factor dPix.” Neuron 32(3): 415–424. [DOI] [PubMed] [Google Scholar]
- 67.Podufall J, Tian R, Knoche E, Puchkov D, Walter AM, Rosa S, Quentin C, Vukoja A, Jung N, Lampe A, Wichmann C, Bohme M, Depner H, Zhang YQ, Schmoranzer J, Sigrist SJ and Haucke V (2014). “A presynaptic role for the cytomatrix protein GIT in synaptic vesicle recycling.” Cell Rep 7(5): 1417–1425. [DOI] [PubMed] [Google Scholar]
- 68.Premont RT, Claing A, Vitale N, Freeman JL, Pitcher JA, Patton WA, Moss J, Vaughan M and Lefkowitz RJ (1998). “beta2-Adrenergic receptor regulation by GIT1, a G protein-coupled receptor kinase-associated ADP ribosylation factor GTPase-activating protein.” Proc Natl Acad Sci U S A 95(24): 14082–14087. [DOI] [PMC free article] [PubMed] [Google Scholar]
- 69.Qiu A, Crocetti D, Adler M, Mahone EM, Denckla MB, Miller MI and Mostofsky SH (2009). “Basal ganglia volume and shape in children with attention deficit hyperactivity disorder.” Am J Psychiatry 166(1): 74–82. [DOI] [PMC free article] [PubMed] [Google Scholar]
- 70.Ramakers GJ, Wolfer D, Rosenberger G, Kuchenbecker K, Kreienkamp HJ, Prange-Kiel J, Rune G, Richter K, Langnaese K, Masneuf S, Bosl MR, Fischer KD, Krugers HJ, Lipp HP, van Galen E and Kutsche K (2012). “Dysregulation of Rho GTPases in the alphaPix/Arhgef6 mouse model of X-linked intellectual disability is paralleled by impaired structural and synaptic plasticity and cognitive deficits.” Hum Mol Genet 21(2): 268–286. [DOI] [PubMed] [Google Scholar]
- 71.Rubinov M and Sporns O (2010). “Complex network measures of brain connectivity: Uses and interpretations.” NeuroImage 52(3): 1059–1069. [DOI] [PubMed] [Google Scholar]
- 72.Saneyoshi T, Wayman G, Fortin D, Davare M, Hoshi N, Nozaki N, Natsume T and Soderling TR (2008). “Activity-dependent synaptogenesis: regulation by a CaM-kinase kinase/CaM-kinase I/betaPIX signaling complex.” Neuron 57(1): 94–107. [DOI] [PMC free article] [PubMed] [Google Scholar]
- 73.Santiago-Medina M, Gregus KA and Gomez TM (2013). “PAK-PIX interactions regulate adhesion dynamics and membrane protrusion to control neurite outgrowth.” J Cell Sci 126(Pt 5): 1122–1133. [DOI] [PMC free article] [PubMed] [Google Scholar]
- 74.Schindelin J, Arganda-Carreras I, Frise E, Kaynig V, Longair M, Pietzsch T, Preibisch S, Rueden C, Saalfeld S, Schmid B, Tinevez J-Y, White DJ, Hartenstein V, Eliceiri K, Tomancak P and Cardona A (2012). “Fiji: an open-source platform for biological-image analysis.” Nature Methods 9(7): 676–682. [DOI] [PMC free article] [PubMed] [Google Scholar]
- 75.Schmalzigaug R, Phee H, Davidson CE, Weiss A and Premont RT (2007). “Differential expression of the ARF GAP genes GIT1 and GIT2 in mouse tissues.” J Histochem Cytochem 55(10): 1039–1048. [DOI] [PubMed] [Google Scholar]
- 76.Schmalzigaug R, Rodriguiz RM, Bonner PE, Davidson CE, Wetsel WC and Premont RT (2009). “Impaired fear response in mice lacking GIT1.” Neuroscience letters 458(2): 79–83. [DOI] [PMC free article] [PubMed] [Google Scholar]
- 77.Schmalzigaug R, Rodriguiz RM, Bonner PE, Davidson CE, Wetsel WC and Premont RT (2009). “Impaired fear response in mice lacking GIT1.” Neurosci Lett 458(2): 79–83. [DOI] [PMC free article] [PubMed] [Google Scholar]
- 78.Segura I, Essmann CL, Weinges S and Acker-Palmer A (2007). “Grb4 and GIT1 transduce ephrinB reverse signals modulating spine morphogenesis and synapse formation.” Nat Neurosci 10(3): 301–310. [DOI] [PubMed] [Google Scholar]
- 79.Sharief AA, Badea A, Dale AM and Johnson GA (2008). “Automated segmentation of the actively stained mouse brain using multi-spectral MR microscopy.” NeuroImage 39(1): 136–145. [DOI] [PMC free article] [PubMed] [Google Scholar]
- 80.Stocco A, Lebiere C and Anderson JR (2010). “Conditional routing of information to the cortex: a model of the basal ganglia’s role in cognitive coordination.” Psychological review 117(2): 541–574. [DOI] [PMC free article] [PubMed] [Google Scholar]
- 81.Thiessen JD, Zhang Y, Zhang H, Wang L, Buist R, Del Bigio MR, Kong J, Li XM and Martin M (2013). “Quantitative MRI and ultrastructural examination of the cuprizone mouse model of demyelination.” NMR Biomed 26(11): 1562–1581. [DOI] [PubMed] [Google Scholar]
- 82.Wadghiri YZ, Blind JA, Duan X, Moreno C, Yu X, Joyner AL and Turnbull DH (2004). “Manganese-enhanced magnetic resonance imaging (MEMRI) of mouse brain development.” NMR in Biomedicine 17(8): 613–619. [DOI] [PubMed] [Google Scholar]
- 83.Wang N, Anderson RJ, Badea A, Cofer G, Dibb R, Qi Y and Johnson GA (2018). “Whole mouse brain structural connectomics using magnetic resonance histology.” Brain Struct Funct 223(9): 4323–4335. [DOI] [PMC free article] [PubMed] [Google Scholar]
- 84.Won H, Mah W, Kim E, Kim JW, Hahm EK, Kim MH, Cho S, Kim J, Jang H, Cho SC, Kim BN, Shin MS, Seo J, Jeong J, Choi SY, Kim D, Kang C and Kim E (2011). “GIT1 is associated with ADHD in humans and ADHD-like behaviors in mice.” Nat Med 17(5): 566–572. [DOI] [PubMed] [Google Scholar]
- 85.Worsley KJ, Poline JB, Friston KJ and Evans AC (1997). “Characterizing the response of PET and fMRI data using multivariate linear models.” Neuroimage 6(4): 305–319. [DOI] [PubMed] [Google Scholar]
- 86.Wu T, Bae MH, Zhang M, Pan R and Badea A (2012). “A prior feature svm-mrf based method for mouse brain segmentation.” NeuroImage 59(3): 2298–2306. [DOI] [PMC free article] [PubMed] [Google Scholar]
- 87.Xu T, Luo Y, Kong F, Lv B, Zhao S, Chen J, Liu W, Cheng L, Zhou Z, Zhou Z, Huang Y, Li L, Zhao X, Qian D, Fan J and Yin G (2019). “GIT1 is critical for formation of the CD31 hi Emcn hi vessel subtype in coupling osteogenesis with angiogenesis via modulating preosteoclasts secretion of PDGF-BB.” Bone 122: 218–230. [DOI] [PubMed] [Google Scholar]
- 88.Xu T, Luo Y, Kong F, Lv B, Zhao S, Chen J, Liu W, Cheng L, Zhou Z, Zhou Z, Huang Y, Li L, Zhao X, Qian D, Fan J and Yin G (2019). “GIT1 is critical for formation of the CD31hiEmcnhi vessel subtype in coupling osteogenesis with angiogenesis via modulating preosteoclasts secretion of PDGF-BB.” Bone 122: 218–230. [DOI] [PubMed] [Google Scholar]
- 89.Yang R, Walder-Christensen KK, Kim N, Wu D, Lorenzo DN, Badea A, Jiang Y-H, Yin HH, Wetsel WC and Bennett V (2019). “ANK2 autism mutation targeting giant ankyrin-B promotes axon branching and ectopic connectivity.” Proceedings of the National Academy of Sciences 116(30): 15262–15271. [DOI] [PMC free article] [PubMed] [Google Scholar]
- 90.Zhang H, Webb DJ, Asmussen H and Horwitz AF (2003). “Synapse formation is regulated by the signaling adaptor GIT1.” The Journal of cell biology 161(1): 131–142. [DOI] [PMC free article] [PubMed] [Google Scholar]
- 91.Zhang H, Webb DJ, Asmussen H and Horwitz AF (2003). “Synapse formation is regulated by the signaling adaptor GIT1.” J Cell Biol 161(1): 131–142. [DOI] [PMC free article] [PubMed] [Google Scholar]
- 92.Zhang H, Webb DJ, Asmussen H, Niu S and Horwitz AF (2005). “A GIT1/PIX/Rac/PAK signaling module regulates spine morphogenesis and synapse formation through MLC.” J Neurosci 25(13): 3379–3388. [DOI] [PMC free article] [PubMed] [Google Scholar]
- 93.Zhao SJ, Kong FQ, Cai W, Xu T, Zhou ZM, Wang ZB, Xu AD, Yang YQ, Chen J, Tang PY, Wang Q, Cheng L, Luo YJ, Zhou Z, Li LW, Huang YF, Zhao X, Yin GY, Xue MX and Fan J (2018). “GIT1 contributes to autophagy in osteoclast through disruption of the binding of Beclin1 and Bcl2 under starvation condition.” Cell Death and Disease 9(12). [DOI] [PMC free article] [PubMed] [Google Scholar]
- 94.Zhou W, Li X and Premont RT (2016). “Expanding functions of GIT Arf GTPase-activating proteins, PIX Rho guanine nucleotide exchange factors and GIT-PIX complexes.” J Cell Sci 129(10): 1963–1974. [DOI] [PMC free article] [PubMed] [Google Scholar]
Associated Data
This section collects any data citations, data availability statements, or supplementary materials included in this article.
Supplementary Materials
Supplementary Table 1. Abbreviations for the segmented brain regions.