Abstract
This work rests on our recent report on the successful use of tissue nanotransfection (TNT) delivery of Ascl1, Brn2, and Myt1l (TNTABM) to directly convert skin fibroblasts into electrophysiologically active induced neuronal cells (iN) in vivo. Here we report that in addition to successful neurogenic conversion of cells, TNTABM caused neurotrophic enrichment of the skin stroma. Thus, we asked whether such neurotrophic milieu of the skin can be leveraged to rescue pre-existing nerve fibers under chronic diabetic conditions. Topical cutaneous TNTABM caused elevation of endogenous NGF and other co-regulated neurotrophic factors such as Nt3. TNTABM spared loss of cutaneous PGP9.5+ mature nerve fibers in db/db diabetic mice. This is the first study demonstrating that under conditions of in vivo reprogramming, changes in the tissue microenvironment can be leveraged for therapeutic purposes such as the rescue of pre-existing nerve fibers from its predictable path of loss under conditions of diabetes.
Keywords: Diabetic peripheral neuropathy, Nanochannel electroporation, Tissue nanotransfection
The distal forms of diabetic peripheral neuropathy (DPN) are a characteristically symmetric, “stocking-glove” pattern of length-dependent polyneuropathies that develop upon persistent hyperglycemia.1 Prior approaches to support nerve fibers in DPN relied on pharmacologic therapies for correcting intracellular signaling pathways, biochemistry, and organelle functions of the neurons.2,3 However, such interventions have failed to proceed past phase II or III clinical trials mainly for lack of efficacy and/or adverse side-effects.3 Nerve growth factor (NGF) is abundantly produced by keratinocytes and is depleted at the onset of DPN.4 Withdrawal of NGF in vitro leads to distal axonal degeneration.5 Neurotrophic factor supplement, namely exogenous NGF injection, has been tested clinically as a prophylactic measure in DPN.6 Therapeutic administration of exogenous NGF alone has not proceeded through clinical trials because of barriers such as injection site pain, questionable efficacy, and potential need for other trophic factors to be co-administered.4,7 Recently, we have reported a novel non-viral tissue nanotransfection technology (TNT) for in vivo reprogramming of the skin. TNT delivery of Ascl1, Brn2, and Myt1l (ABM) achieved direct conversion of skin fibroblasts to mature electrophysiologically active induced neuronal (iN) cells.8 In direct reprogramming therapeutics, the focus has been on the reprogrammed cells. In the present work, we turn our focus to the neurotrophic environment generated in response to in vivo reprogramming and ask whether such neurotrophic milieu of the skin can be leveraged to rescue pre-existing nerve fibers that are vulnerable to degeneration under chronic diabetic conditions.
Materials and methods
Mice
All animal studies were performed in accordance with protocols approved by the Institutional Laboratory Animal Care and Use Committee of Indiana University. Mice were maintained under standard conditions at 22 + 2 °C with 12-h light/dark cycles and access to food and water ad libitum.
C57Bl/6 mice were purchased from Jackson laboratories. Lepr db/db mice homozygous (BKS.Cg-m+/+Leprdb/J, or db/db; stock no 000642) for spontaneous mutation of the leptin receptor (Leprdb) (aged 8–10 weeks) were purchased from Jackson Laboratory, Bar Harbor, ME.
Cell culture
Primary Mouse Embryonic fibroblasts (MEFs) were purchased from Millipore Sigma (PMEF-HL-C). MEFs were grown in DMEM supplemented with 10% fetal bovine serum, 100 μg/ml streptomycin, 100 U/ml penicillin, 0.25 μg/ml amphotericin and 1x MEM Non-Essential Amino Acids (all from ThermoFisher Scientific). Cells were maintained at 37 °C in 95% air and 5% CO2 in a humidified atmosphere.
Nanochannel electroporation for in vitro reprogramming
For nanochannel electroporation (NEP) -, cells were directly grown on the apical surface of a Transwell membrane (Corning cat#3460) at a density of ~0.15–0.18 × 10⁶ cells/well in regular maintenance medium (DMEM as mentioned above). The cells were allowed to adhere and spread overnight before nanochannel electroporation (NEP) transfection.9 Following cell loading, the media in the apical chamber was replaced by PBS and the Transwell inserts were then mounted on a custom made gold electrode in direct contact with the plasmid solution. A counter-electrode was then immersed in the PBS of the apical chamber, and a square wave pulse (275 V, 35 ms duration pulse, 1–10 pulses) was applied across the electrodes using a Biorad Gene Pulser Xcell power supply. The PBS was replaced by fresh media immediately after, and the cells were then incubated overnight at 37 °C. Ascl1, Brn2, Myt1l (ABM) plasmids were mixed at a 2:1:1 molar ratio as described previously.9
Induced neuron protocol
Post-NEP, MEF’s were cultured on Poly-D-lysine hydrobromide (Millipore Sigma, US) coated glass coverslips or plates in regular maintenance media for 24 h. After 24 h, media was replaced with neuronal induction medium. Neuronal induction media was prepared by supplementing DMEM base media with 1x N2 supplement, 100 μg/ml streptomycin, 100 U/ml penicillin,0.25 μg/ml amphotericin, 1x MEM Non-Essential Amino Acids, and 10 ng/ml human bFGF as described previously.8,9 MEF cells transfected with ABM cDNA expression plasmids were differentiated for one, two or four weeks.
Tissue nanotransfection for in vivo reprogramming
For in vivo reprogramming, C57Bl/6 mice (8–10 weeks old) or db/db mice (27-week-old) were used for tissue nano-transfection (TNT) to deliver ABM (TNTABM). The TNT device was used as described previously.8 In brief, the dorsal area of skin to be used for transfection was depilated 24 h before TNT. The skin was then exfoliated to eliminate the dead/keratin cell layers to expose nucleated cells in epidermis. ABM plasmid cocktail (2:1:1 molar ratio) was loaded in the reservoir at a concentration of 0.05–0.1 μg μl−1. A gold-coated electrode (cathode) was immersed in the plasmid solution, and a 25G needle counter-electrode (anode) was inserted into the dermis juxtaposed to the TNT platform surface. Pulsed electrical stimulation (10 pulses, 250 V in amplitude, duration of 10 ms per pulse) was then applied across the electrodes to nanoporate the exposed cell membranes and drive the plasmid cargo into the cells through the nanochannels. Unless otherwise specified, control specimens involved TNT treatments with mock plasmid solution.8 After 24 h of TNTABM, mouse skin samples (12 mm punch biopsy) were collected in OCT. Histology of skin and mRNA expression in situ was performed on 10 μm-thick sections.
DNA plasmid preparation
Mock (empty vector), Ascl1, Brn2, and Myt1l plasmids were prepared using a plasmid DNA purification kit (Zymo-PURE II Plasmid Midiprep Kit,cat. no. D4201). DNA concentrations were obtained from Nanodrop 2000c Spectrophotemeter (Thermoscientific). Ascl1, Brn2, and Myt1l plasmids (backbone, pCAGGs) were constructed with GFP (Ascl1), RFP (Brn2), or CFP (Myt1l) by Applied Biological Materials Inc., Richmond, BC, Canada) as previously described.8 pCAGEN (empty) was a gift from Connie Cepko (Addgene plasmid#11160).
RNA isolation and real-time quantitative PCR for mRNA
Total RNA was extracted by using the Total RNA Extraction and Purification Isolation Kit according to the manufacturer’s protocol (Norgen Biotek, Thorold, ON, Canada). For gene expression studies, total cDNA synthesis was achieved by using the SuperScript™ VILO™ cDNA Synthesis Kit (ThermoFisher Scientific). The abundance of mRNA for Ascl1, Brn2, Myt1l, Ngf, Bdnf, Nt3, Nt4/5 was quantified by real-time PCR by using SYBR Green-I as described previously.8 Gapdh served as housekeeping control. The following primer sets were used:
m_Gapdh F: 5′-ATGACCACAGTCCATGCCATCACT-3′.
m_Gapdh R: 5′- TGTTGAAGTCGCAGGAGACAACCT-3′.
m_Ascl1 F: 5′-CGA CGA GGG ATC CTA CGA C-3′.
m_Ascl1 R: 5′-CTT CCT CTG CCC TCG AAC-3′.
m_Brn2_F: 5′-GGT GGA GTT CAA GTC CAT CTA C-3′.
m_Brn2_R: 5′-TGG CGT CCA CGT AGT AGT AG-3′.
m_Myt1L_F: 5′-ATA CAA GAG CTG TTC AGC TGTC-3′.
m_Myt1L_R: 5′- GTC GTG CAT ATT TGC CAC TG-3′.
m_Ngf F: 5′-ACCAATAGCTGCCCGAGTGACA-3′.
m_Ngf R: 5′-GAGAACTCCCCCATGTGGAAGACT-3′.
m_Bdnf F: 5′-CGTGGGGAGCTGAGCGTGTG-3′.
m_Bdnf R: 5′-GCCCCTGCAGCCTTCCTTGG-3′.
m_Nt3 F: 5′-GCCCAAAGCAGAGGCACCCA-3′.
m_Nt3 R: 5′-GCTACCACCGGGTTGCCCAC-3′.
m_Nt4/5 F: 5′-AGTCTGCAGTCAACGCCCGC-3′.
m_Nt4/5 R: 5′-TGCGACGCAGTGAGTGGCTG-3′.
Immunocytochemistry (ICC)
ICC was performed on mouse embryonic fibroblasts (MEF) nano-transfected with neuronal conversion factors ABM or mock plasmids as described previously.10,11 In brief, cells were fixed with 4% formaldehyde for 15 min at room temperature, permeabilized with 0.1% Triton X-100 for 15 min followed by blocking in 10% normal goat serum for 1 h at room temperature. After blocking, primary antibody treatment was performed followed by three washing steps of PBS. Secondary antibody was applied to visualize expression pattern of the MAP2 (Abcam, ab5392; 1:1000), beta III tubulin (TuJ1) (Abcam, ab52623; 1:200, GeneTex GTX85469; 1:500) and Neurofilament 200 (Millipore Sigma N4142; 1: 200) proteins. The signal was visualized by subsequent incubation with appropriate fluorescence-tagged secondary antibodies (Alexa 488-tagged α-rabbit, 1:200; Alexa 568-tagged α-chicken, 1:200). Fluorescent images were acquired using the FluoView FV1000 spectral confocal microscope and laser scanning confocal microscope (LSM 880, Zeiss).
Immunohistochemistry and microscopy
Tissue immunostaining was carried out on 10 μm thick paraffin or cryosections of 12 mm punch biopsy samples as described previously.8,12–14 Immunostainings of beta III tubulin (TuJ1) (Abcam, ab52623; 1:100; GeneTex, Inc. GTX85469, 1:500), S100A4 (Abcam, ab41532; 1:200), Nerve Growth Factor-β (NGF) (Millipore Sigma, AB1526; 1:200), and Protein Gene Product 9.5 (PGP9.5) (Millipore Sigma, AB1761; 1:200), were performed on paraffin and cryosections of skin samples using specific antibodies as indicated. In brief, OCT or paraffin embedded tissue was cryosectioned at 10 μm thick, fixed with cold acetone, blocked with 10% normal goat serum and incubated with specific antibodies. The signal was visualized by subsequent incubation with appropriate fluorescence-tagged secondary antibodies (Alexa 488-tagged α-rabbit, 1:200; Alexa 488-tagged α-chicken, 1:200; Alexa 568-tagged α-rabbit, 1:200) and counter-stained with DAPI. Images were collected using the Axio Scan.Z1 slide scanner (Zeiss Microscopy) or laser scanning confocal microscope (Zeiss). Image analysis software Zen (Zeiss) was used to quantitate fluorescence intensity. Additionally, a manual cell count of fluorescent positive cells in a field of view (FOV) using the cell count module in Zen (Zeiss). For each image, three to six such FOVs were counted and data represented as percent positive. Colocalization was performed using Zen black software.
Enzyme-linked immunosorbent assay (ELISA)
For cell culture experiments, NGF production was measured in culture media and normalized to total protein concentration measured from cell lysate.10 For skin tissue samples, protein was isolated from twenty 100 μM thick sections. Tissue sections were collected in HBSS, washed with HBSS 3x times to remove OCT and resuspended in homogenization buffer [50 mM Tris–Hcl pH 7.5–8.0, 150 mM NaCl, 1% Triton X-100, 0.5% Sodium deoxycholate, 10 μl of protease inhibitor cocktail (Sigma, St. Louis, MO) and 10 μl of PMSF (100 mM)]. The tissue was homogenized on ice three times for 30 s each with 5- to 10-s breaks with Pellet Pestle Motor (Kimble Chase, NJ), followed by sonication on ice three times for 10s each with 10-s breaks. The homogenate was centrifuged at 21,000×g for 5 min at 4 °C. The supernatants were collected and stored at −80 °C until ELISA was performed. Bicinchoninic acid protein assay (Pierce, Rockford, IL) was performed according to the manufacturer’s instructions to standardize NGF values per milligram of protein. NGF protein levels were determined using NGF Rapid ELISA kit (Biosensis Pty Ltd).
RNA in situ hybridization (Fluorescent multiplex RNAscope)
Skin sections (10 μm) were cut using a cryostat (Leica Microsystems) and mounted on Superfrost Plus Gold Glass Slides (Fisher Scientific, #22–035–813). Slides were subsequently stored at −80 °C. Paired double-Z oligonucleotide probes were designed against target RNA using custom software. Probes against Ascl1 mRNA (313291-C2), Brn2 (460561-C3) and Myt1l (483401), as well as all other reagents for in-situ hybridization and DAPI labeling, were purchased from Advanced Cell Diagnostics (ACD, Newark, CA). The tissue pretreatment, hybridization, amplification, and detection were performed manually using RNAscope Multiplex Fluorescent Reagent v2 Kit according to manufacturer’s instructions. During RNAscope hybridization, positive probe (catalog #321811), negative probe (catalog #321831), and ABM probes were processed simultaneously. Fluorescent images were acquired using a FV3000 Olympus microscope.
Results
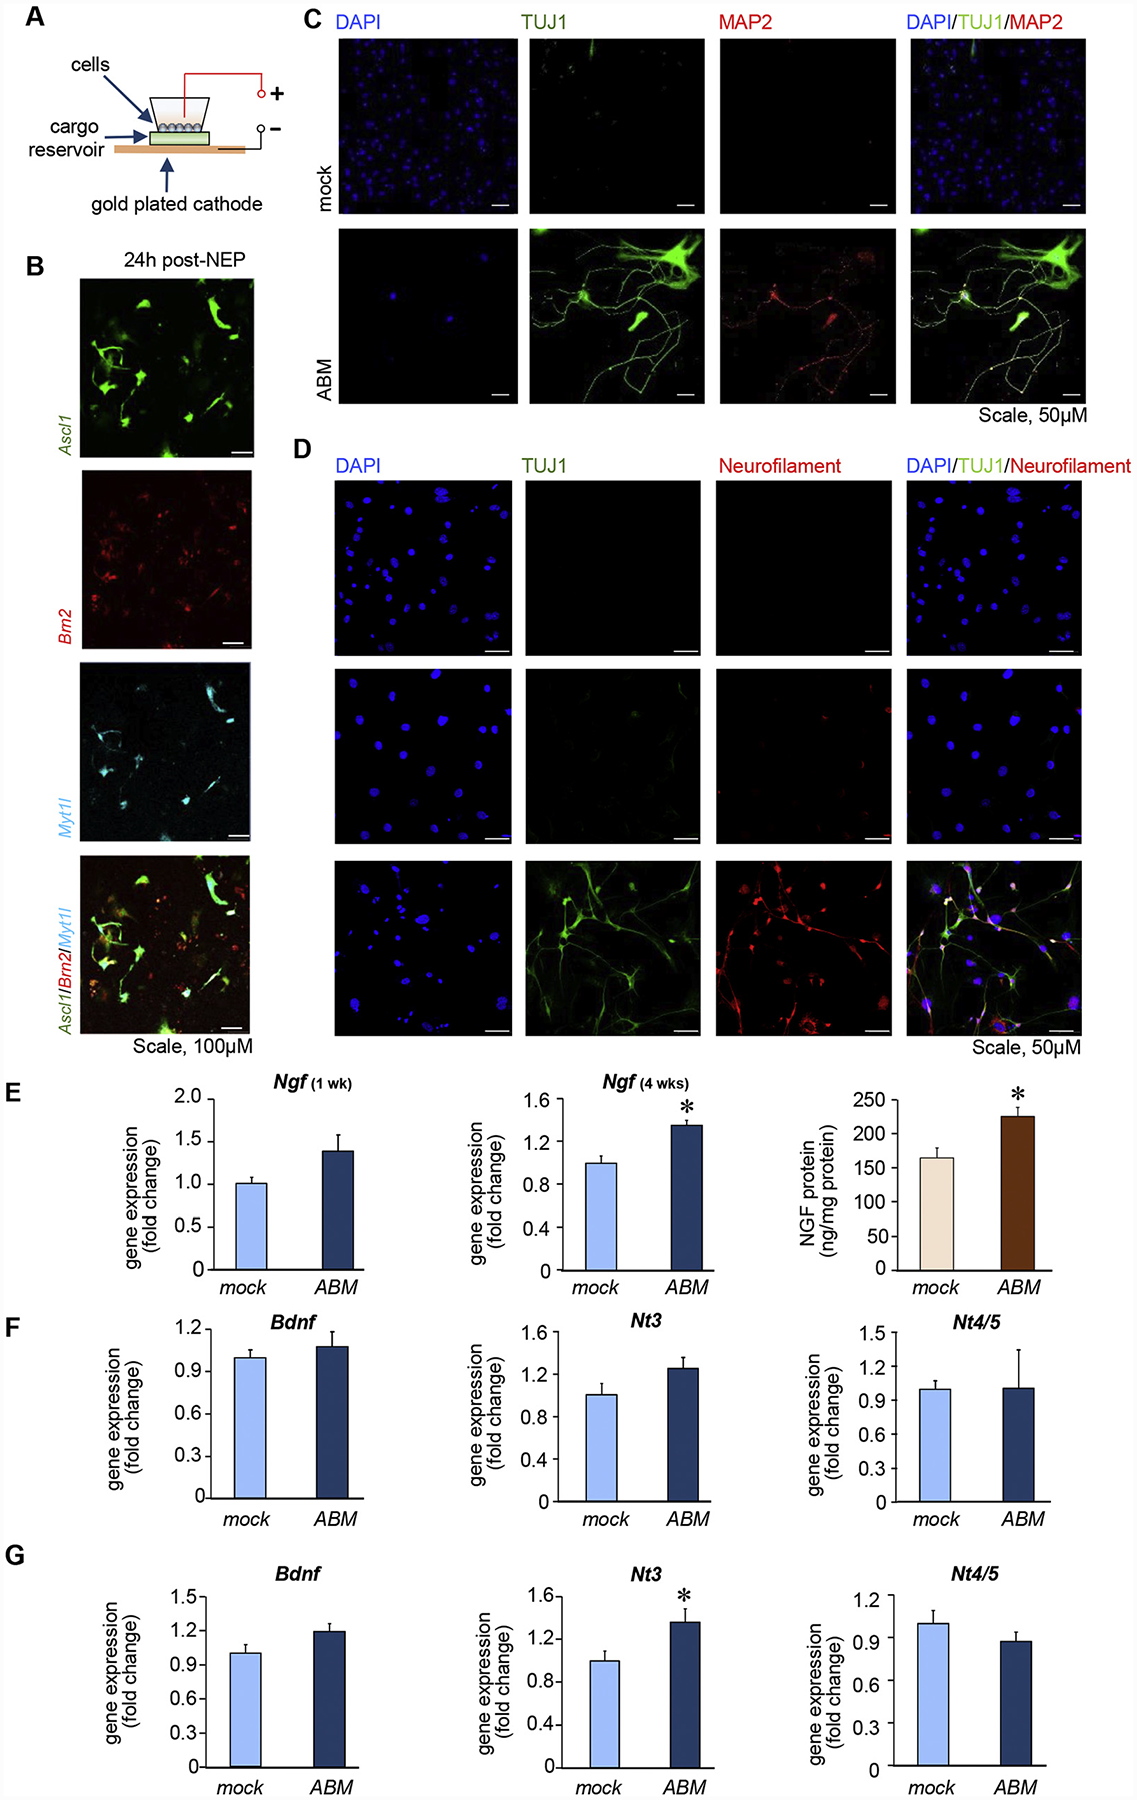
Delivery of ABM via nanochannel electroporation (NEPABM) (Figure 1, A–B) led to conversion of MEF to iN cells 2 weeks (Figure 1, C) and 4 weeks (Figure 1, D) after transfection. Induced neuronal (iN) cells, as indicated by neurofilament 200+ staining, showed elevated Ngf at 4 weeks, (Figure 1, E). NGF production was induced in MEF culture media at 4 weeks post-NEPABM. Quantitative analysis of brain-derived neurotrophic factor (Bdnf), neurotrophin-3 (Nt3), and neurotrophin-4/5 (Nt4/5) showed significant increase in the expression of Nt3 at 4 weeks post-NEPABM (Figure 1, F–G).
Figure 1. NEPABM transfection induced neurotrophic factors in MEF cells.

(A) Schematic diagram of NEP. (B) Delivery of Ascl1, Brn2 and Myt1l in MEF cells by NEP. Phenotypic characterization of induced neuron-like cells 2 weeks post-NEP (C) or 4 weeks post-NEP (D). Molecular markers are indicated on the top of each panel. Scale, 50 μM. (E) Ngf expression at weeks 1 and 4 post-NEP. NGF ELISA from differentiated MEF media at 4 weeks post-NEP (n = 10). RT-qPCR analysis of neurotrophin mRNA at (F) 1 week (n = 4) and (G) 4 weeks (n = 6) post-NEP. Data expressed as mean ± SEM, *P < 0.05.
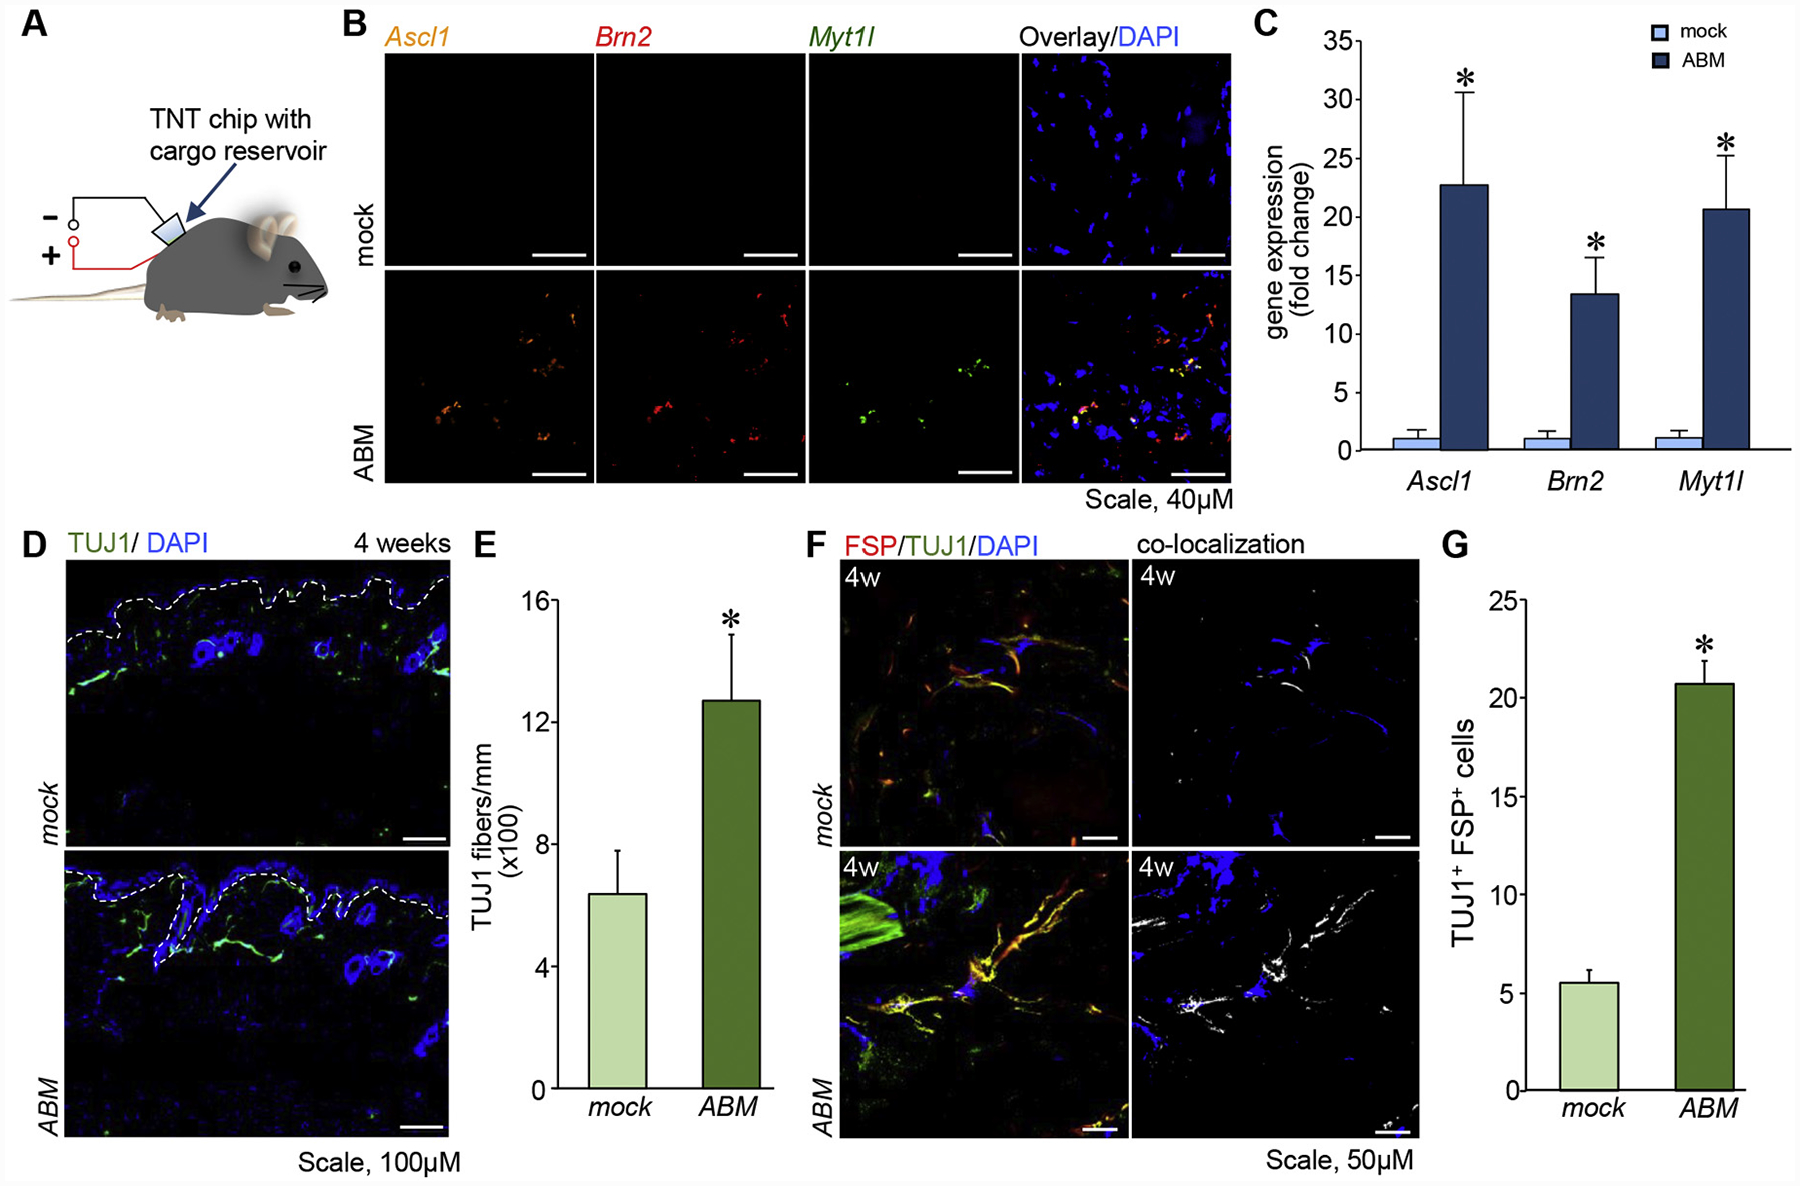
Successful topical delivery of ABM via TNTABM to the dorsal murine skin (Figure 2, A) was validated in situ (Figure 2, B) and expression of Ascl1, Brn2, and Myt1l (Figure 2, C). The iN cells, visualized in early phase as TuJ1+, were significantly abundant in the dermis at 4 weeks post-TNTABM (Figure 2, D–E). TuJ1+ iN cells co-expressed fibroblast-specific protein (FSP) marking that these iN cells were of fibroblasts origin. (Figure 2, F–G).
Figure 2. TNTABM into the dorsal skin of C57Bl/6 mice resulted in stromal reprogramming.

(A) Schematic diagram of TNT. (B) Confocal microscopic images showing three-plex in situ hybridization of Ascl1, Brn2, Myt1l, counterstained with DAPI. (C) RT–qPCR analysis of ABM gene expression in skin 24 h post-TNT. (n = 4), (D) Immunostaining showed TuJ1 fibers in skin. White dashed lines indicate epidermal and dermal junction. (E) Quantification of TuJ1+ fiber length per mm epidermis length. (n = 6) (F) Confocal microscopic images of skin showing co-localization (white) of FSP and TuJ1. (G) Quantification of TuJ1 and FSP positive cells per field of view. Data expressed as mean ± SEM (n = 3–4), *P < 0.05.
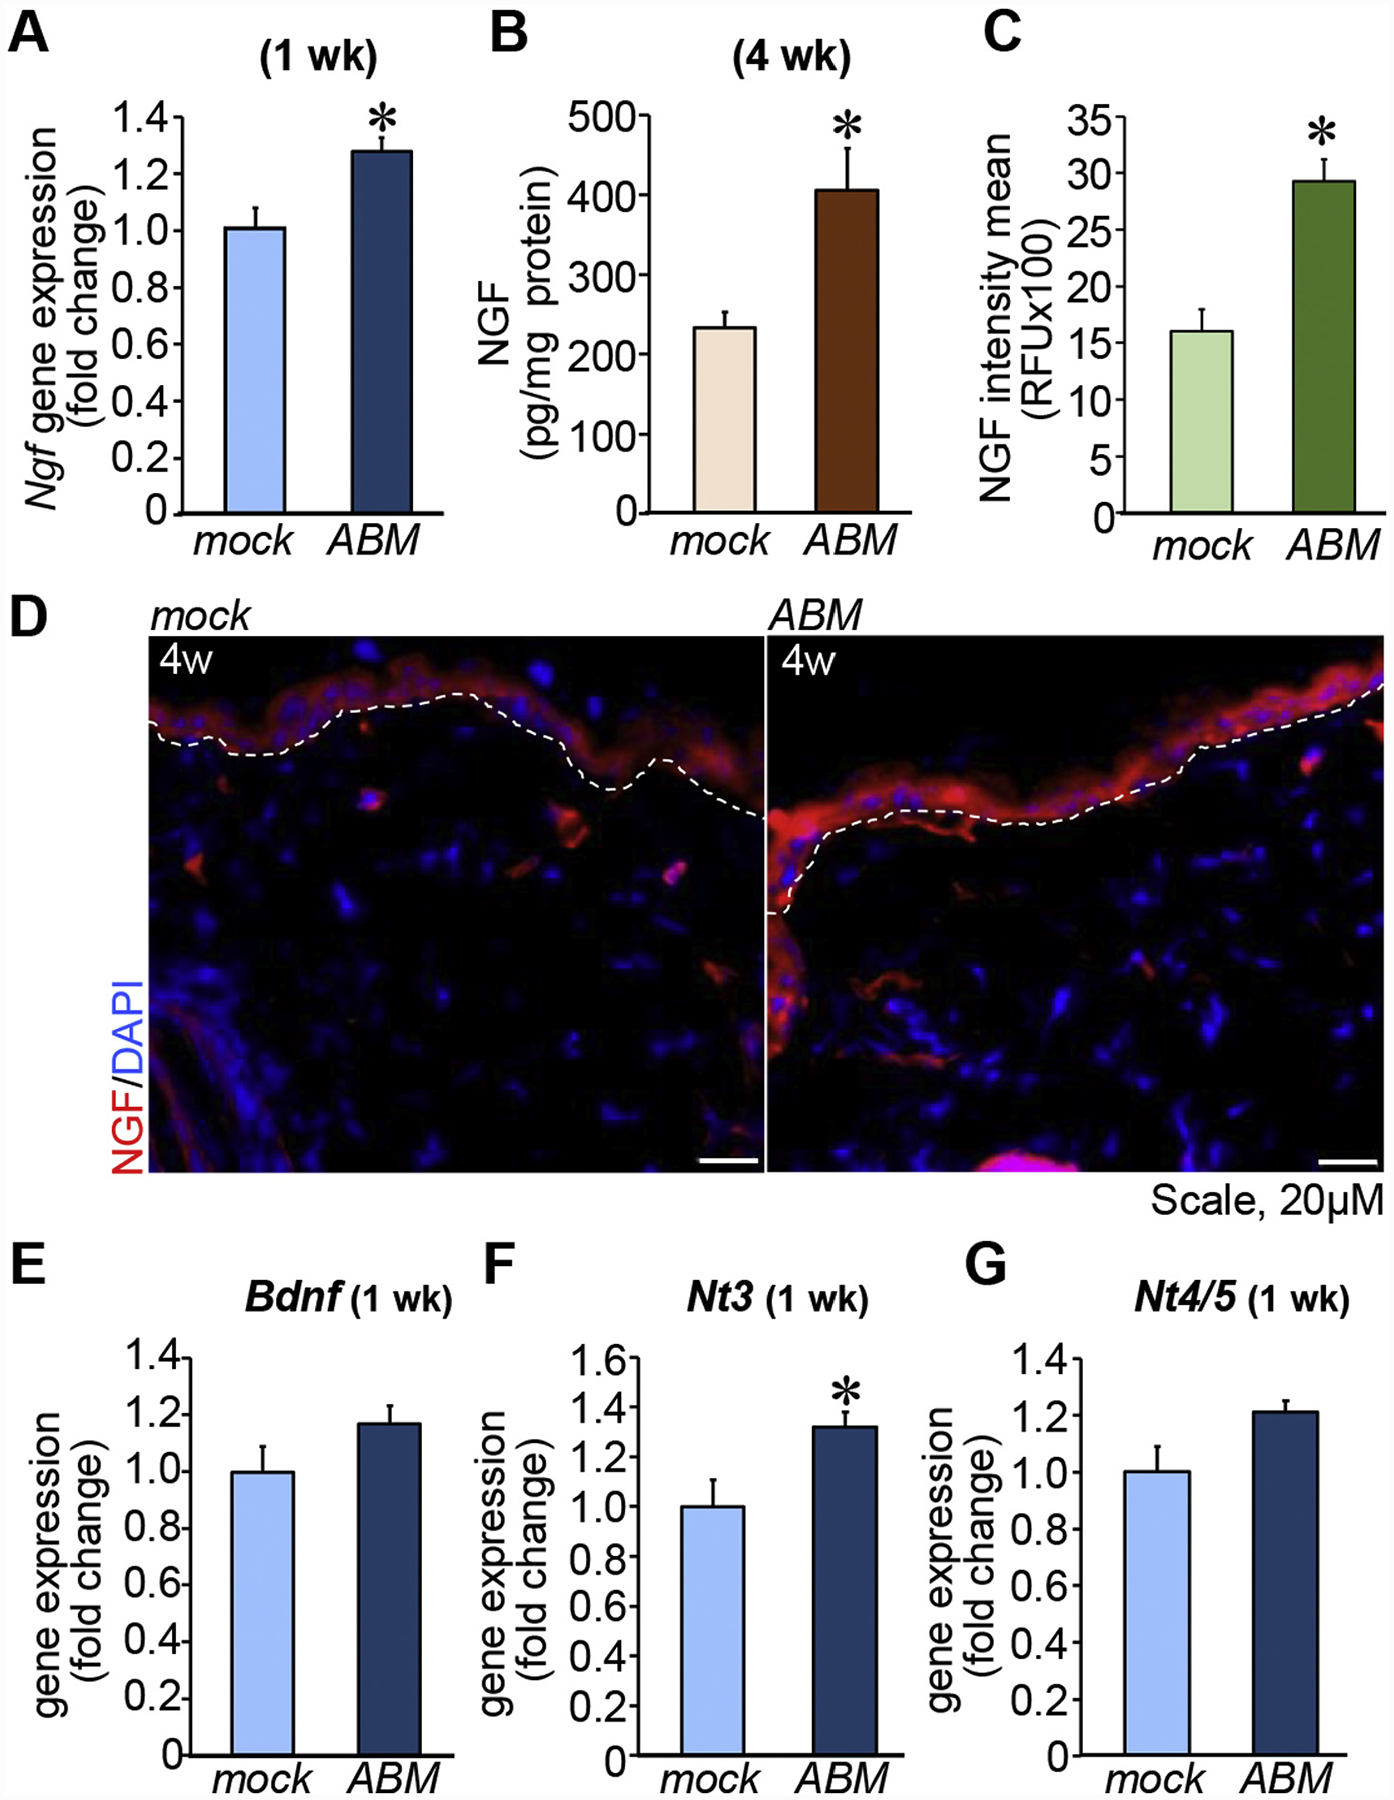
TNTABM enhanced Ngf expression in murine skin 1-week post-TNTABM followed by enhanced NGF production at 4 weeks post-TNTABM (Figure 3, A–B). Elevated NGF expression was localized in the epidermis (Figure 3, C–D). Quantitative analysis of neurotrophic factor genes such as Bdnf, Nt3, and Nt4/5 showed significant Nt3 expression at 1-week post-TNTABM (Figure 3, E).
Figure 3. TNTABM increased neurotrophic factor in skin of C57Bl/6 mice.

(A) RT-qPCR analysis of Ngf (n = 6) (B) NGF expression quantified by ELISA (n = 8), *P < 0.01. (C-D) Quantification and confocal microscopic images showing NGF in epidermis (n = 4). White dashed lines indicate epidermal and dermal junction. (E) Bdnf, Nt3 or Nt4/Nt5 expression in skin. Data expressed as mean ± SEM (n = 6), *P < 0.05.
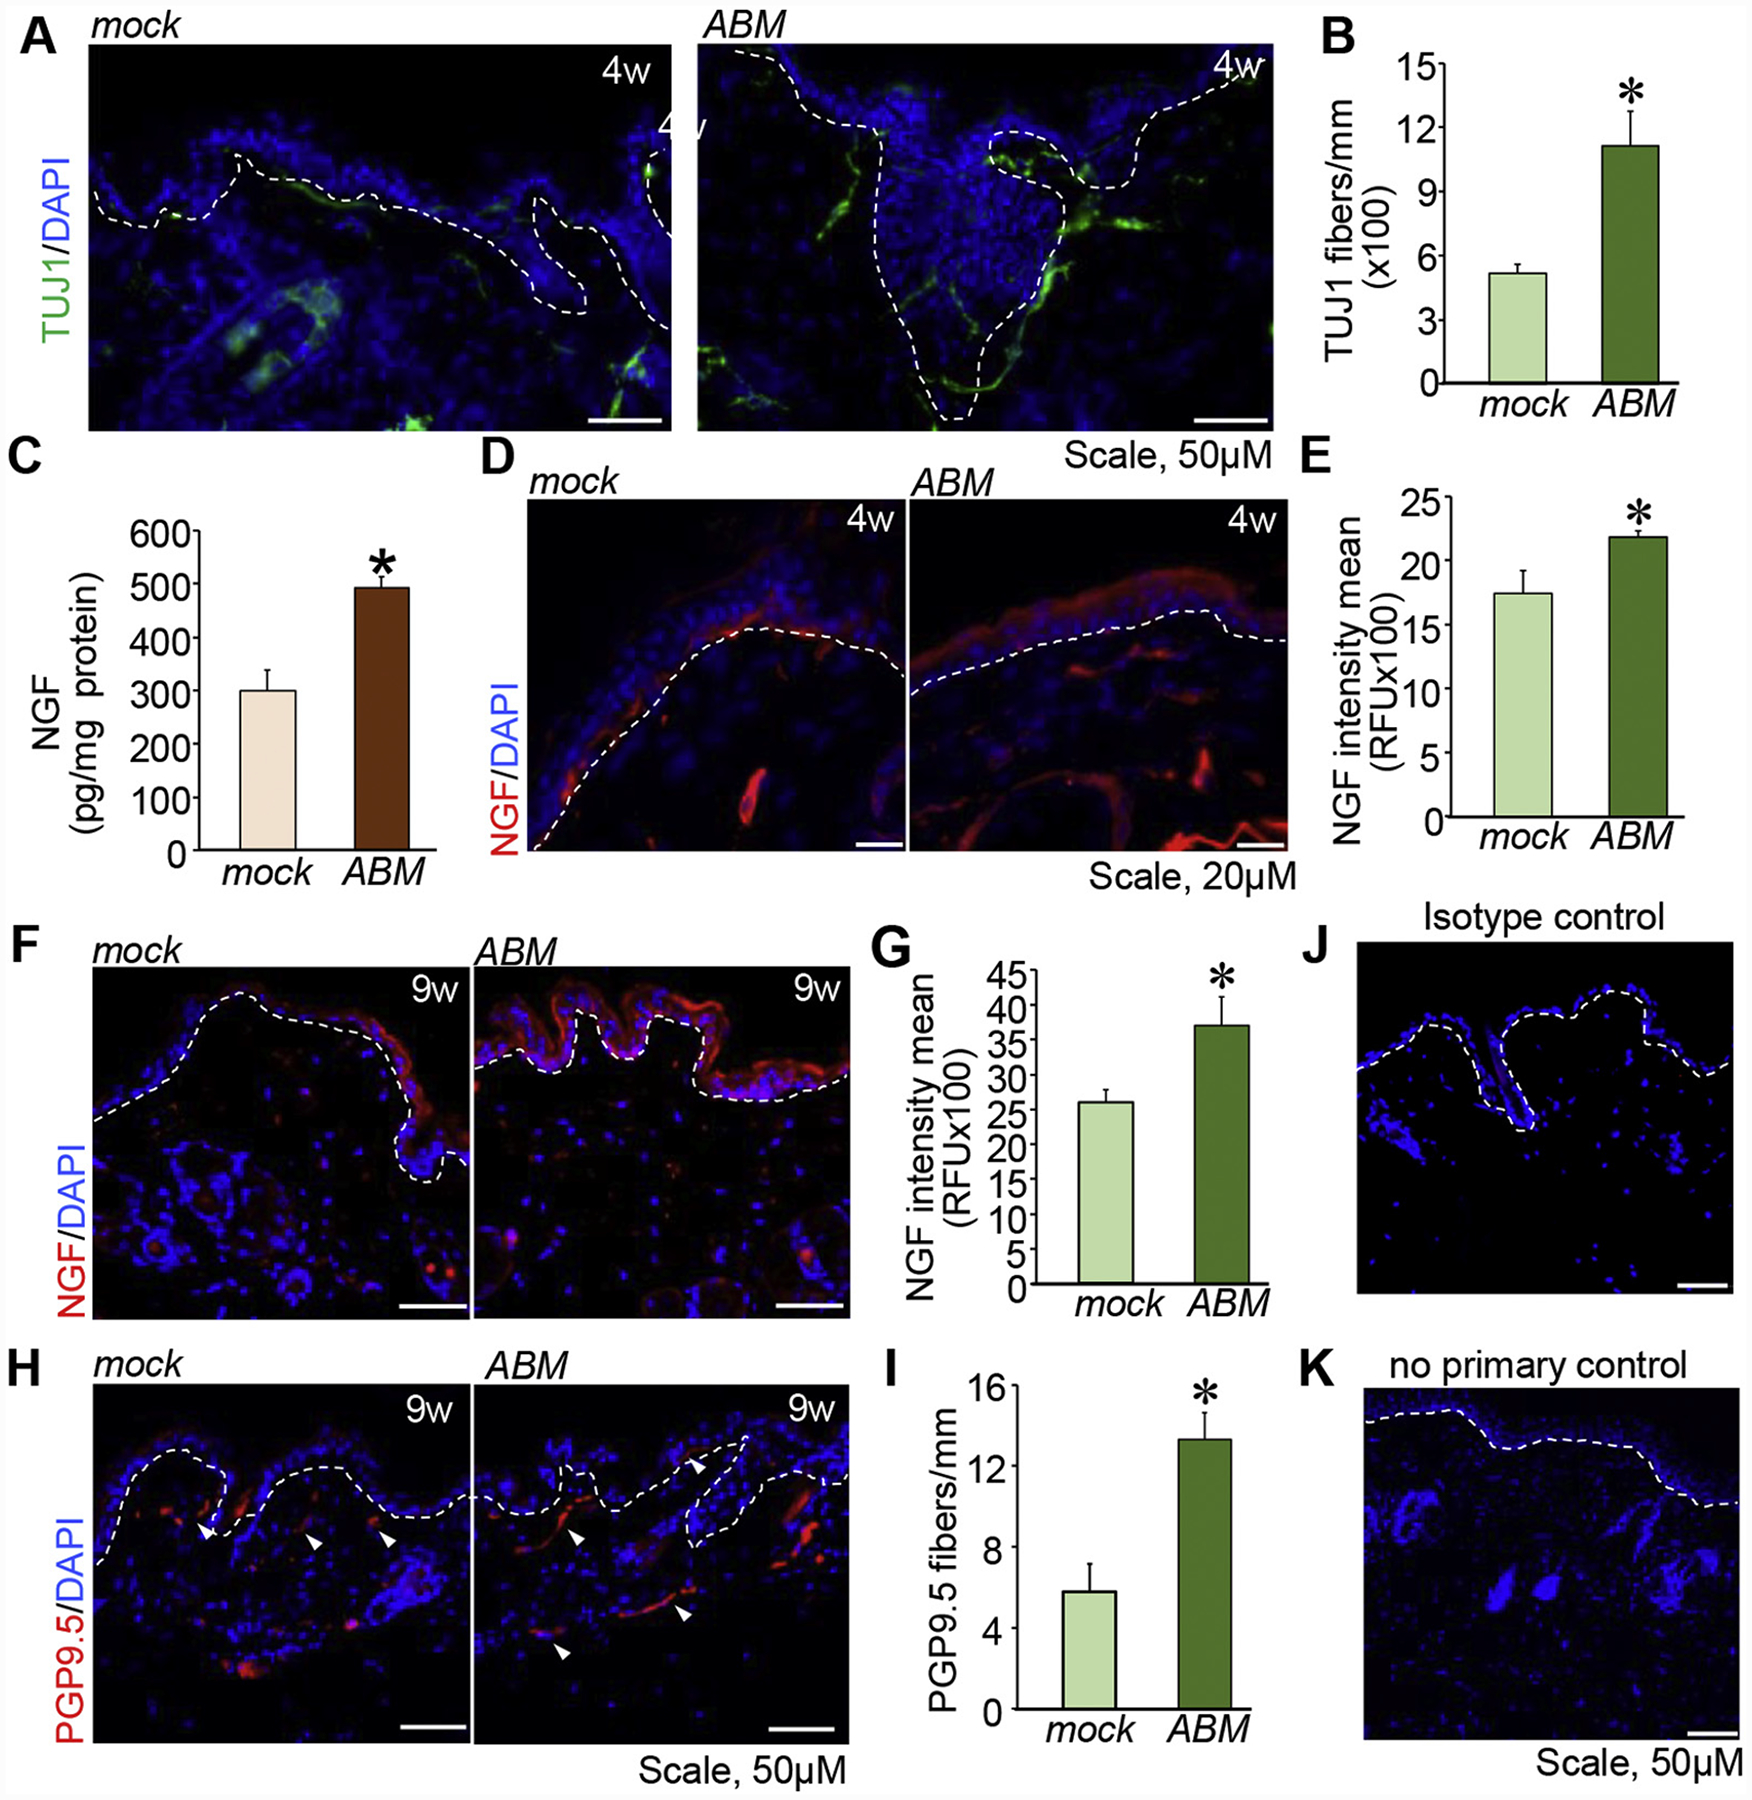
Topical TNTABM on dorsal skin of db/db mice showed increased TuJ1+ cells in the dermis at 4 weeks (Figure 4, A–B). Abundance of NGF in the transfected tissue was significantly increased at 4 weeks post-TNTABM (Figure 4, C–D). Elevated production of NGF by the epidermis was sustained for up to 9 weeks post-TNTABM in mice. These db/db mice were 36 weeks old at that time when the onset of neuropathy is well documented (Figure 4, F–G). Mature neurons as measured by PGP9.5+ staining was significantly higher in number compared to TNTmock (Figure 4, H–I).
Figure 4. TNTABM increased NGF production and PGP9.5+ nerve fibers in skin of db/db mice.

(A) Immunostaining of TuJ1+ fibers in skin. (B) Quantitation of TuJ1+ fiber length per mm epidermis. (n = 6) (C) Tissue NGF was quantified by ELISA. (n = 9,10), *P < 0.01. Immunostaining of NGF in epidermis 4 weeks (D) or 9 weeks (F) post-TNTABM. Quantification of the IHC images (E, 4 weeks & G, 9 weeks). (n = 5–6), *P < 0.05. (H) Immunostaining indicated increased number of PGP9.5+ fibers (white arrowheads) in skin. (I) Quantification of the number of PGP9.5+ fibers per mm epidermis length. Data are mean ± SE (n = 4), *P < 0.01. (J) Isotype control and (K) no primary antibody yielded no signal. White dashed lines indicate epidermal and dermal junction.
Discussion
In vivo reprogramming often relies on implantation of limited number of cells reprogrammed in vitro.15,16 Such approach is often in conflict with the host immune system.17,18 Topical TNT mediated in vivo reprogramming offers the advantage that cells are converted within the live body under immune surveillance.8 Should successful cell conversion be achieved in vivo, it may be safely assumed that such reprogramming happened only after successful negotiation with the local immune system. Thus, such process of in vivo cell reprogramming is more likely to generate sustainable results with translational significance.
Reprogramming of cells in vivo is likely to release factors that also affect non-reprogrammed cells within the same microenvironment by paracrine mechanisms. The product of in vivo reprogramming are successfully converted cells and a modified tissue microenvironment that is supportive of the survival and functionality of the converted cells. Our previous work has shown that iN generated by TNTABM in the adult skin persist long-term and acquire electrophysiological activity.8 This successful advancement from conversion to maturation of the neurons provided us the impetus to test the hypothesis that in response to TNTABM the skin microenvironment acquires neurotrophic properties. In this work, TuJ1+ neural cells, produced in response to TNTABM, co-localized with FSP+ cells indicating fibroblast origin of iN as established previously.8 An interesting finding of this work is that the skin stroma enriches in NGF and Nt3 expression. Discrepant timeline of the induction of NGF and Nt3 under in vitro condition may be explained by differences in experimental conditions such as complexity of stroma and blood borne factors. Delayed induction of NGF and NT3 expression was observed in aged diabetic mice indicative of barriers to successful neurogenic reprogramming under conditions of diabetes.
Clinical assessment of DPN include sensory tests, nerve conduction velocity tests, or nerve fiber enumeration in skin biopsies by protein gene product 9.5 (PGP9.5) immunostaining.1 Enumeration of PGP9.5+ peptidergic and non-peptidergic intraepidermal nerve fibers (IENF) is increasingly recognized as the “gold standard” for quantitative assessment for small nerve loss in DPN.19,20 These early structural changes have been established in db/db mice.21 In this work, topical cutaneous TNTABM in db/db mice induced elevated NGF production for up to 9 weeks. Such elevated cutaneous NGF was associated with higher abundance of PGP9.5+ mature nerve fiber. It is well known that in db/db, cutaneous PGP9.5+ mature nerve fibers markedly diminished at this age.20 Thus, in response to topical cutaneous TNTABM, elevation of endogenous NGF and other co-regulated neurotrophic factors are effective in sparing loss of cutaneous PGP9.5+ mature nerve fibers in diabetes. Taken together, this is the first study demonstrating that under conditions of in vivo reprogramming, changes in the tissue microenvironment can be leveraged for therapeutic purposes such as the rescue of pre-existing nerve fibers from its predictable path of loss under conditions of diabetes.
Acknowledgements
This work was supported by the US National Institutes of Health, grants NS085272-03 and in part by NS042617, DK114718, GM108014 and NR015676.
References
- 1.C. C, Vinik A, Nevoret ML. Diabetic neuropathies In: A. B, Feingold KR, Boyce A, et al. , editors. Endotext. South Dartmouth (MA): MDText. com, Inc.; 2018. [Google Scholar]
- 2.Cashman CR, Höke A. Mechanisms of distal axonal degeneration in peripheral neuropathies. Neurosci Lett 2015;596:33–50. [DOI] [PMC free article] [PubMed] [Google Scholar]
- 3.Dewanjee S, Das S, Das AK, Bhattacharjee N, Dihingia A, Dua TK, et al. Molecular mechanism of diabetic neuropathy and its pharmacotherapeutic targets. Eur J Pharmacol 2018;833:472–523. [DOI] [PubMed] [Google Scholar]
- 4.Anand P Neurotrophic factors and their receptors in human sensory neuropathies. Prog Brain Res 2004;146:477–92. [DOI] [PubMed] [Google Scholar]
- 5.Raff MC, Whitmore AV, Finn JT. Axonal self-destruction and neurodegeneration. Science (New York, NY) 2002;296:868–71. [DOI] [PubMed] [Google Scholar]
- 6.Zhao M, Li X-Y, Xu C-Y, Zou L-P. Efficacy and safety of nerve growth factor for the treatment of neurological diseases: a meta-analysis of 64 randomized controlled trials involving 6,297 patients. Neural Regen Res 2015;10:819–28. [DOI] [PMC free article] [PubMed] [Google Scholar]
- 7.Li R, Ma J, Wu Y, Nangle M, Zou S, Li Y, et al. Dual delivery of NGF and bFGF coacervater ameliorates diabetic peripheral neuropathy via inhibiting Schwann cells apoptosis. Int J Biol Sci 2017;13:640–51. [DOI] [PMC free article] [PubMed] [Google Scholar]
- 8.Gallego-Perez D, Pal D, Ghatak S, Malkoc V, Higuita-Castro N, Gnyawali S, et al. Topical tissue nano-transfection mediates non-viral stroma reprogramming and rescue. Nat Nanotechnol 2017;12:974–9. [DOI] [PMC free article] [PubMed] [Google Scholar]
- 9.Gallego-Perez D, Otero JJ, Czeisler C, Ma J, Ortiz C, Gygli P, et al. Deterministic transfection drives efficient nonviral reprogramming and uncovers reprogramming barriers. Nanomedicine 2016;12:399–409. [DOI] [PMC free article] [PubMed] [Google Scholar]
- 10.Khanna S, Biswas S, Shang Y, Collard E, Azad A, Kauh C, et al. Macrophage dysfunction impairs resolution of inflammation in the wounds of diabetic mice. PLoS One 2010;5 e9539. [DOI] [PMC free article] [PubMed] [Google Scholar]
- 11.Khanna S, Roy S, Park HA, Sen CK. Regulation of c-Src activity in glutamate-induced neurodegeneration. J Biol Chem 2007;282:23482–90. [DOI] [PubMed] [Google Scholar]
- 12.Ahmed NS, Ghatak S, El Masry MS, Gnyawali SC, Roy S, Amer M, et al. Epidermal E-cadherin dependent beta-catenin pathway is phytochemical inducible and accelerates Anagen hair cycling. Mol Ther 2017;25:2502–12. [DOI] [PMC free article] [PubMed] [Google Scholar]
- 13.Ghatak S, Chan YC, Khanna S, Banerjee J, Weist J, Roy S, et al. Barrier function of the repaired skin is disrupted following arrest of dicer in keratinocytes. Mol Ther 2015;23:1201–10. [DOI] [PMC free article] [PubMed] [Google Scholar]
- 14.Li J, Ghatak S, El Masry MS, Das A, Liu Y, Roy S, et al. Topical lyophilized targeted lipid nanoparticles in the restoration of skin barrier function following burn wound. Mol Ther 2018;26:2178–88. [DOI] [PMC free article] [PubMed] [Google Scholar]
- 15.Palomo ABA, Lucas M, Dilley RJ, McLenachan S, Chen FK, Requena J, et al. The power and the promise of cell reprogramming: personalized autologous body organ and cell transplantation. J Clin Med 2014;3:373–87. [DOI] [PMC free article] [PubMed] [Google Scholar]
- 16.Kikuchi T, Morizane A, Doi D, Magotani H, Onoe H, Hayashi T, et al. Human iPS cell-derived dopaminergic neurons function in a primate Parkinson’s disease model. Nature 2017;548:592–6. [DOI] [PubMed] [Google Scholar]
- 17.Tullis GE, Spears K, Kirk MD. Immunological barriers to stem cell therapy in the central nervous system. Stem Cells Int 2014;2014:507905. [DOI] [PMC free article] [PubMed] [Google Scholar]
- 18.Zakrzewski JL, van den Brink MRM, Hubbell JA. Overcoming immunological barriers in regenerative medicine. Nat Biotechnol 2014;32:786–94. [DOI] [PMC free article] [PubMed] [Google Scholar]
- 19.Lauria G, Hsieh ST, Johansson O, Kennedy WR, Leger JM, Mellgren SI, et al. European Federation of Neurological Societies/peripheral nerve society guideline on the use of skin biopsy in the diagnosis of small fiber neuropathy. Report of a joint task force of the European Federation of Neurological Societies and the peripheral nerve society. Eur J Neurol 2010;17:903–12 e44–9. [DOI] [PubMed] [Google Scholar]
- 20.Beiswenger KK, Calcutt NA, Mizisin AP. Epidermal nerve fiber quantification in the assessment of diabetic neuropathy. Acta Histochem 2008;110:351–62. [DOI] [PMC free article] [PubMed] [Google Scholar]
- 21.Biessels GJ, Bril V, Calcutt NA, Cameron NE, Cotter MA, Dobrowsky R, et al. Phenotyping animal models of diabetic neuropathy: a consensus statement of the diabetic neuropathy study group of the EASD (Neurodiab). J Peripher Nerv Syst 2014;19:77–87. [DOI] [PMC free article] [PubMed] [Google Scholar]


