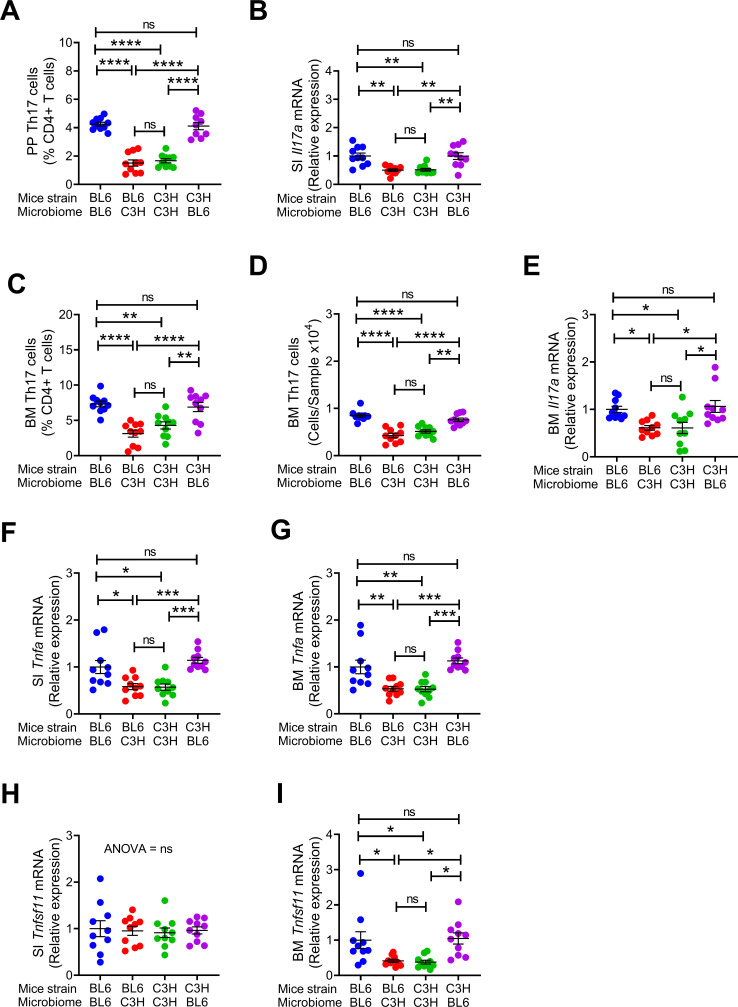
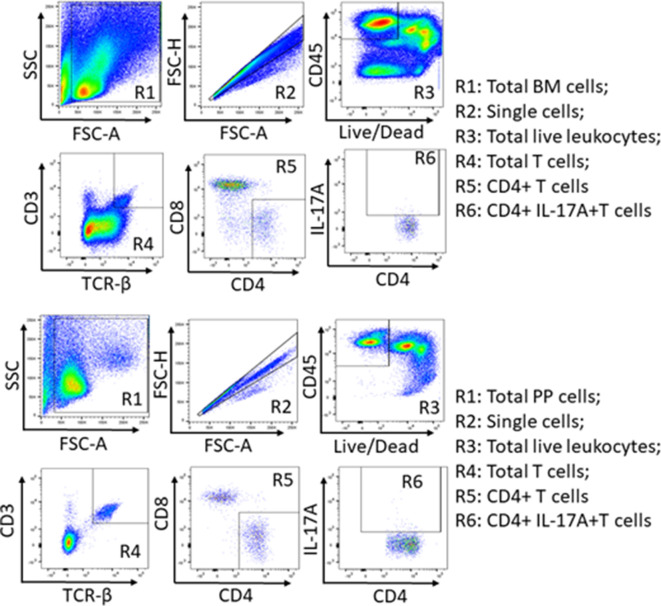
Figure 2. Effects of maternal fecal microbime on the frequency of BM and PP Th17 cells and transcript levels of inflammatory cytokines in the offspring.
(A) Relative frequency of Th17 cells (IL-17+ CD4+ T cells) in PP. (B) SI Il17a mRNA levels. (C,D) Relative and absolute frequency of BM Th17 cells. (E) BM Il17a mRNA levels. (F) SI Tnfa mRNA levels. (G) BM Tnfa mRNA levels. (H) SI Tnfsf11 mRNA levels. (I) BM Tnfsf11 mRNA levels. n = 10 mice per group. Data were expressed as mean ± SEM. All data were normally distributed according to the Shapiro-Wilk normality test. Data were analyzed by 2-way ANOVA and post hoc tests applying the Bonferroni correction for multiple comparisons. *p<0.05, **p<0.01, ***p<0.001, ****p<0.0001 compared to indicated groups.


