Abstract
The complete mitogenome of Himalayan black bear (Ursus thibetanus laniger) from Indian Himalayan region was assembled following the modified approach of mitochondrial baiting and mapping using the next-generation sequencing reads. The complete mitogenome was of 16,556 bp long, consisted of 37 genes that contained 13 protein-coding genes, 22 tRNAs, 2 rRNAs and 1 control region. The complete base composition was 31.33% A, 15.24% G, 25.45%C, and 27.98%T and gene arrangement was similar to the other sub-species of Asiatic black bear. The relative synonymous codon usage analysis revealed the maximum abundance of Isoleucine, Tyrosine, Leucine and Threonine. The assembled mitogenome of U. t. laniger exhibited 99% similarity with the mitogenomes of Himalayan black bear available from Nepal and Tibetan Plateau-Himalaya region. The findings of the present study has proven low depth sequencing data, adequate and highly efficient in rapid recovering the mitochondrial genome by overcoming the conventional strategies of obtaining long-range PCR and subsequently drawing phylogenetic inferences.
Subject terms: Evolutionary biology, Genomics, Sequencing, Conservation biology, Evolutionary ecology, Molecular ecology
Introduction
The Asiatic black bear (Ursus thibetanus) with wide range distribution, consists of seven well recognized subspecies, i.e. Japanese black bear (U. t. japonicus) in Japan, Ussuri black bear (U. t. ussuricus) in far-east Russia, northeast China, and Korea, Formosan black bear (U. t. formosanus) in Taiwan, Indochinese/Sichuan black bear (U. t. mupinensis) in Southwest China, Baluchistan black bear (U. t. gedrosianus) in South Pakistan and Iran, Tibetan black bear (U. t. thibetanus) in the eastern Himalayas and southeast Asia, and Himalayan black bear (U. t. laniger) in the western Himalayas1. Among the seven sub-species of Asiatic black bear, the Himalayan black bear (henceforth, HBB) is distributed in between 1200 and 3300 m asl all along the forested habitats of the Himalayas and hills of northeastern states of India covering an area of about 270,000 km2 with an estimated population of 5400 to 6700 divides2,3. A small population of HBB is patchily distributed across Pakistan, northwest India, and likely northeast India and Nepal4. In India, HBB has experienced several challenges including habitat loss, population decline due to hunting/poaching for pelts, paws and gall bladders and retaliatory killing in the response to Human–Bear Conflicts3,5,6. Considering the increased threats and species vulnerability in wild, HBB is listed as Vulnerable in the Red list of IUCN1 and categorized under the Schedule-I of Indian Wildlife (Protection) Act 1972. Complete mitochondrial genomes of six sub-species of Asiatic black bear except the U. t. gedrosianus have been sequenced using long range PCR strategy7–10. However, no study has provided the detailed genome organization and comparative assessment for gene arrangements and structural consistency in the t-RNA model, important in variety of cellular processes controlling species life history traits.
Further, Next Generation Sequencing (NGS), which rapidly captures the broad spectrum of mutations and has dramatically revolutionized DNA sequencing11, and has been popularized to address questions in the field of molecular ecology12, phylogeographic13, population genetics14 and phylogenetic studies15. Most studies in bears have made use of the conventional strategy of combining long-range PCR with subsequent primer walking for sequencing the complete mitogenomes7–10,16. However, conventional sequencing is tedious and challenging in particular for optimizing long range PCRs. In contrast, revolution in NGS technology has made considerable decrease in cost and increase in throughput (millions of short sequencing reads) and accuracy17,18. Several studies have demonstrated the application of NGS in drawing the phylogenetic inferences, genome organization and comparative assessment among the sympatric species by mapping and assembly the complete mitogenomes from low depth sequencing reads19–21.
Therefore, to overcome the unwieldy process of conventional sanger sequencing, we assembled the complete mitogenome directly from low depth NGS reads following a modified approach of mitochondrial baiting and mapping reported earlier by Hahn et al.22. We demonstrated organization of complete mitogenome of HBB for the first time and presented its structure consistency of tRNA model with the other sub-species of Asiatic black bear. We also testified the assembled mitogenome of U. t. laniger in re-construction of bear phylogeny among the other black bear subspecies.
Results and discussion
Genome organization
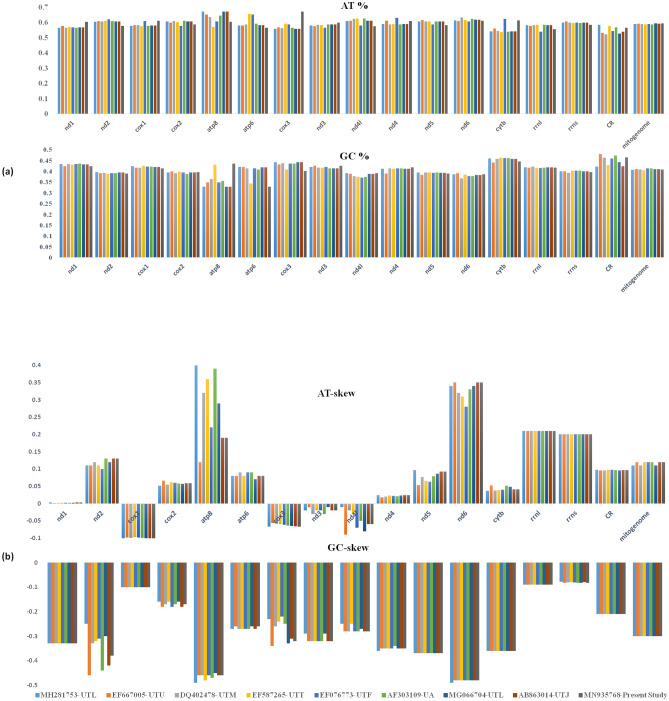
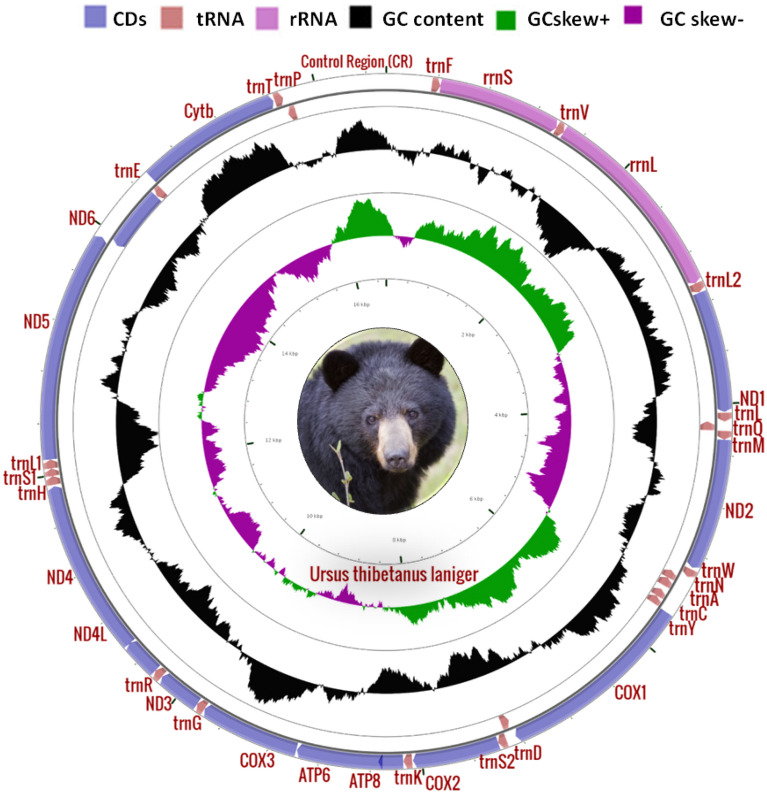
A total of 3.73 GB data of ~ 1.6 × coverage was obtained from Illumina HiSeq 2500 platform which yielded 12,418,314 reads. With reference-based assembly, we obtained the longest contig of 16, 556 bp length that represented the complete mitochondrial genome of U. t. laniger and submitted to GenBank (accession no. MN935768). The observed total AT and GC contenst were 59.3% and 40.7% (Fig. 1a), and mitogenome showed positive AT skewness (+ 0.057), indicating that adenine bases occurred more frequently than the thymine, whereas GC-skew was negative, − 0.25. The assembled mitogenome encoded 37 genes, of which, 13 were PCGs, 22 tRNAs, 2rRNAs and one control region. The arrangement and distribution of genes were similar to the other mammalian species23. The overall nucleotide composition was: 31.33% -A, 25.45% -C, 15.24% -G, 27.98%- T. In exception to ND6 and eight tRNA genes (trnQ, trnA, trnN, trnC, trnY, trnS2, trnE and trnP), most genes were encoded on the heavy strand (Fig. 2). The five pairs of overlapping regions in mitogenome were observed among trnV/rrnL, trnI/trnQ, atp8/atp6, nd4l/nd4, and trnT/trnP. The overlapping regions ranged from − 1 to − 34 bp. The smallest overlapping region was located in between trnV/trnL and trnT/trnP (1 bp) whereas the longest overlapping was in between ATP8/ATP6 (40 bp). Besides, 20 intergenic spacers were observed between the mitochondrial regions ranging from 1 to 33 bp length; the longest space was found between trnN/trnC (Table 1).
Figure 1.
Representation of AT, GC content and skewness of Himalayan black bear with other sub-species of Asiatic black bears. (a) AT and GC content (b) and skewness.
Figure 2.
The mitochondrial genome of Ursus thibetanus laniger. Direction of gene signal is indicated by arrows. Protein-coding genes are shown in silver color arrows, rRNA genes in purple color arrows, tRNA genes in light pink color arrows and non-coding region in white color. The GC content is plotted using a black color; GC-skew is plotted using green and dark pink color. The figure was drawn using CGView online server (https://stothard.afns.ualberta.ca/cgview_server/) with default parameters.
Table 1.
List of annotated mitochondrial genes in Himalayan black bear, Ursus thibetanus laniger.
| S. No | Gene | Start | End | Size | Strand | Score | Start Codon | Intergenic Nucleotides |
|---|---|---|---|---|---|---|---|---|
| 1 | trnF(ttc) | 356 | 423 | 68 | + | 1.05E−12 | 0 | |
| 2 | rrnS | 424 | 1389 | 966 | + | 1.84E−61 | 0 | |
| 3 | trnV(gta) | 1390 | 1455 | 66 | + | 8.75E−11 | − 1 | |
| 4 | rrnL | 1455 | 3036 | 1582 | + | 3.08E−38 | 1 | |
| 5 | trnL2(tta) | 3038 | 3112 | 75 | + | 1.47E−07 | 2 | |
| 6 | nd1 | 3115 | 4065 | 951 | + | 2.24E+08 | ATG | 5 |
| 7 | trnI(atc) | 4071 | 4139 | 69 | + | 1.10E−12 | − 3 | |
| 8 | trnQ(caa) | 4137 | 4209 | 73 | − | 1.30E−08 | 1 | |
| 9 | trnM(atg) | 4211 | 4279 | 69 | + | 4.13E−08 | 0 | |
| 10 | nd2 | 4280 | 5308 | 1029 | + | 1.74E+08 | ATA | 13 |
| 11 | trnW(tga) | 5322 | 5388 | 67 | + | 1.47E−12 | 8 | |
| 12 | trnA(gca) | 5397 | 5465 | 69 | − | 1.40E−07 | 0 | |
| 13 | trnN(aac) | 5466 | 5538 | 67 | − | 9.13E−10 | 33 | |
| 14 | trnC(tgc) | 5572 | 5638 | 73 | − | 1.88E−11 | 0 | |
| 15 | trnY(tac) | 5639 | 5705 | 67 | − | 1.66E−09 | 1 | |
| 16 | cox1 | 5707 | 7245 | 1539 | + | 2.91E+08 | ATG | 3 |
| 17 | trnS2(tca) | 7249 | 7317 | 67 | − | 1.36E−07 | 6 | |
| 18 | trnD(gac) | 7324 | 7390 | 69 | + | 2.25E−08 | 0 | |
| 19 | cox2 | 7391 | 8071 | 681 | + | 1.31E+08 | ATG | 6 |
| 20 | trnK(aaa) | 8078 | 8145 | 68 | + | 1.13E−09 | 1 | |
| 21 | atp8 | 8148 | 8342 | 195 | + | 1226437 | ATG | − 34 |
| 22 | atp6 | 8309 | 8983 | 675 | + | 82486767 | ATG | 5 |
| 23 | cox3 | 8989 | 9771 | 783 | + | 2.02E+08 | ATG | 1 |
| 24 | trnG(gga) | 9773 | 9841 | 69 | + | 5.61E−11 | 0 | |
| 25 | nd3 | 9842 | 10186 | 345 | + | 20858803 | ATG | 1 |
| 26 | trnR(cga) | 10189 | 10257 | 69 | + | 5.22E−09 | 0 | |
| 27 | nd4l | 10258 | 10551 | 294 | + | 12258664 | ATG | − 4 |
| 28 | nd4 | 10548 | 11915 | 1368 | + | 2.68E+08 | ATG | 10 |
| 29 | trnH(cac) | 11926 | 11994 | 69 | + | 6.07E−09 | 0 | |
| 30 | trnS1(agc) | 11995 | 12053 | 59 | + | 1.28E−06 | 0 | |
| 31 | trnL1(cta) | 12054 | 12123 | 70 | + | 3.38E−14 | 0 | |
| 32 | nd5 | 12124 | 13929 | 1806 | + | 3.16E+08 | ATG | 4 |
| 33 | nd6 | 13934 | 14452 | 519 | − | 27691523 | TCC | 3 |
| 34 | trnE(gaa) | 14456 | 14524 | 69 | − | 2.66E−09 | 4 | |
| 35 | cytb | 14529 | 15659 | 1131 | + | 2.43E+08 | ATG | 9 |
| 36 | trnT(aca) | 15669 | 15738 | 70 | + | 1.93E−09 | − 1 | |
| 37 | trnP(cca) | 15738 | 15803 | 66 | − | 5.68E−13 | 0 |
PCGs and rRNAs
All 13 PCGs had ATG start codon except nd2 and nd6 which encoded by ATA and TCC, respectively. The total length of PCGs was 11,316 bp which shared 68.3% of complete mitogenome (Table 2). The average base composition in PCGs were 30.1%- A, 28.6%- T, 14.2%- G and 27.2%- C. The abundance of AT (%) was higher than GC (%).Comparative analysis of U. t. laniger with the other subspecies of Asiatic black bear and Ursus americanus exhibited relatively high adenine and cytosine contents than thymine and guanine. All the PCGs showed positive AT skew except for the genes cox1, cox3, nd3 and nd4l whereas GC skew showed negative skewness for all the genes (Fig. 1b). The PCGs region consisted of twelve heavy strands and one light strand as commonly found in other vertebrate species24–26. The PCGs region consisted of seven NADH dehydrogenases, three cytochrome c oxidases, two ATPases and one cytochrome b genes.
Table 2.
Nucleotide composition and skewness in the Himalayan black bear, Ursus thibetanus laniger mitochondrial genome.
| U.t. laniger | Size (bp) | A% | T% | AT-skew | G% | C% | GC-skew |
|---|---|---|---|---|---|---|---|
| Whole mitogenome | 16556 | 31.33 | 27.98 | 0.057 | 15.24 | 25.45 | − 0.25 |
| PCGs | 11316 | 30.1 | 28.6 | 0.025 | 14.2 | 27.2 | − 0.314 |
| tRNAs | 1508 | 32.9 | 31.2 | 0.026 | 19.4 | 16.4 | 0.083 |
| rRNAs | 2548 | 35.9 | 23.5 | 0.208 | 18.5 | 22.0 | − 0.086 |
| Control region | 1109 | 27.3 | 31.4 | − 0.069 | 17.7 | 23.6 | − 0.142 |
The mtDNA ribosomal region is known to be highly conserved and widely used for phylogenies of higher and middle category level, such as phyla, family and genera24,26. The length of 12S rRNA and 16S rRNA genes was 966 bp and 12,582 bp, respectively. The 12S rRNA gene was positioned between the tRNA-Phe and tRNA-Val and 16S rRNA gene was positioned between tRNA-Val and tRNA-Leu2. Similar to PCGs, the AT skewness was positive (0.208) and the GC skewness was negative − 0.086) (Table 2) and the total AT content of rRNA was 59.4% which was in correspondence with other sub-species of Asiatic black bear (Table 2).
Transfer RNAs and control region
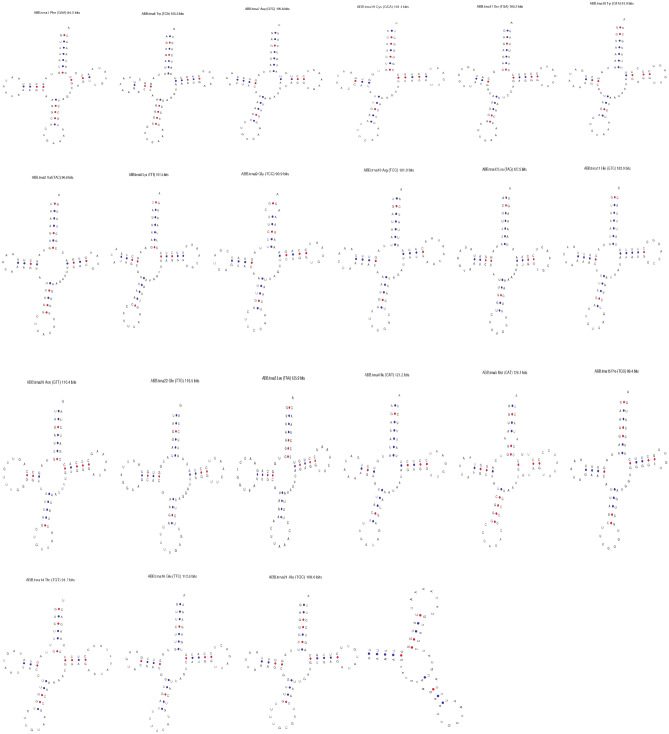
The length of the tRNA was 1508 bp, overall AT and GC content was 64.1% and 35.9% respectively. The average AT and GC skewness values for tRNAs were 0.026 and 0.083, respectively (Table 3). The results exhibited 21 tRNAs can fold into cloverleaf structure except for tRNAser which lacks the dihydrouridine arm (Fig. 3). The tRNA genes length varied from 59 to 75 bp and out of 22 tRNAs, fourteen were located on heavy strand and eight were on the light strand (Table 1).
Table 3.
Comparative assessment of nucleotide composition indices among different subspecies of Asiatic black bear and other species in the Ursidae family.
| S. No | GenBank ID | Whole Mitogenome | Protein coding Genes (PCGs) | Ribosomal RNA (rRNA) | Species/subspecies (Country) | Reference/sequencing methods (Sanger/NGS) | |||
|---|---|---|---|---|---|---|---|---|---|
| Size (bp) | AT (%) | Size (bp) | AT (%) | Size (bp) | AT (%) | ||||
| 1 | MH281753 | 16771 | 59.1 | 11402 | 59.0 | 2546 | 59 | Ursus thibetanus laniger (Nepal) | Kadariya et al.10/Sanger sequencing |
| 2 | EF667005 | 16701 | 59.1 | 11416 | 59.0 | 2549 | 59 | Ursus thibetanus ussuricus (South Korea) | Hwang et al.9/Sanger sequencing |
| 3 | DQ402478 | 16868 | 59.2 | 11410 | 59.0 | 2545 | 60 | Ursus thibetanus mupinensis (China) | Hou et al.8/Sanger sequencing |
| 4 | EF196661 | 16795 | 59.0 | 11405 | 59.0 | 2541 | 60 | Ursus thibetanus (China) | Li et al.8/Sanger sequencing |
| 5 | EF587265 | 17034 | 58.8 | 11211 | 59.0 | 2548 | 60 | Ursus thibetanus thibetanus (Taiwan) | Chou et al. (unpublished data)/Sanger sequencing |
| 6 | EF076773 | 17044 | 58.7 | 11418 | 59.0 | 2549 | 59 | Ursus thibetanus formosanus (Taiwan) | Hsieh et al. 2016 (unpublished data)/Sanger sequencing |
| 7 | MG066704 | 16795 | 59.1 | 11405 | 59.0 | 2648 | 60 | Ursus thibetanus (Tibetan Plateau) | Lan et al.33/Sanger sequencing |
| 8 | FM177759 | 16893 | 58.9 | 11403 | 58.0 | 2548 | 60 | Ursus thibetanus (Germany) | Krause et al., 2008 (unpublished data)/Sanger sequencing |
| 9 | AB863014 | 16748 | 59.4 | 11405 | 59.0 | 2540 | 60 | Ursus thibetanus japonicus (China) | Wu et al.34/Sanger sequencing |
| 10 | JX196366 | 16434 | 59.3 | 11400 | 59.0 | 2546 | 60 | Ursus americanus (USA) | Miller et al. 2012/Genome sequencing |
| 11 | AF303109 | 16841 | 59.4 | 11409 | 59.0 | 2545 | 60 | Ursus americanus (Canada) | Delisle and Strobeck16/Sanger sequencing |
| 12 | AF303110 | 17020 | 58.7 | 11409 | 59.0 | 2541 | 60 | Ursus arctos (Canada) | Delisle and Strobeck16/Sanger sequencing |
| 13 | GU573490 | 16808 | 58.9 | 11406 | 59.0 | 2542 | 59 | Ursus maritimus (USA) | Lindqvist et al. 2010/Sanger sequencing |
| 14 | EF196664 | 16783 | 59.0 | 11410 | 59.0 | 2546 | 60 | Helarctos malayanus (China) | Li et al.8/sanger sequencing |
| 15 | NC 009970 | 16817 | 58.3 | 11406 | 58.0 | 2545 | 59 | Melursus ursinus (China) | Li et al.8/Sanger sequencing |
| 16 | EF196665 | 16766 | 58.6 | 11410 | 58.0 | 2553 | 60 | Tremarctos ornatus (China) | Li et al.8/Sanger sequencing |
| 17 | EF212882 | 16805 | 61.2 | 10957 | 62.0 | 2547 | 61 | Ailuropoda melanoleuca (China) | Peng et al./sanger sequencing |
| 18 | MN935768 | 16556 | 59.3 | 11316 | 59.0 | 2548 | 59 | Ursus thibetanus laniger (India; Present Study) | Present Study/Low depth genome approach |
Figure 3.
Putative secondary structures of 22 transfer RNA genes of Ursus thibetanus linager where the red dots indicated Watson–crick pairing and the blue dots indicated other non-Watson–Crick interactions.
The control region was located between trnP and trnF and the length was 1109 bp in size and contributed to 6.7% of the whole mitogenome with containing a microsatellite repeat, (AT)4 and seven 10 bp tandem repeats (Table S1). The A + T composition was 58.7%, higher than that of G + C content. The AT and GC skewness values were negative, − 0.069 and − 0.142, respectively (Table 2).
RSCU and reconstruction of bear phylogeny
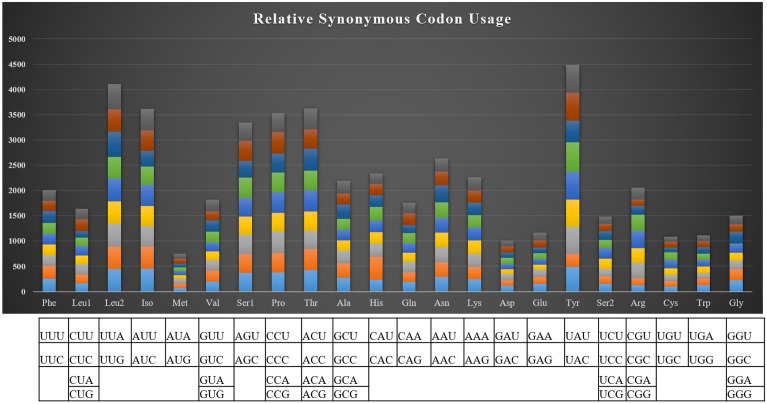
The relative synonymous codon usage showed the highest utilization of codons of UAC, UUG, AUC and ACC among all the PCGs (Fig. 4). The RSCU analysis revealed the most occurred amino acids in protein-coding genes of U. t. laniger mitochondrial genome were Ile, Tyr, Leu, and Thr with 449, 482, 439 and 419 codon frequencies, respectively (Table S2, Fig. 5), whereas Met, Cys and Asp were less abundant. We did not find any difference in the RSCU of the U. t. laniger when compared with the other subspecies of Asiatic black bear. The phylogenetic analysis showed that the two mitogenomes i.e. MG066704.2 and MH281753.1 shared 99% similarity with the assembled mitogenome of U.t. laniger. These two mitogenomes were sequenced from Nepal10 and Tibetan Plateau-Himalaya region27 which are the known distribution ranges of the U.t. laniger, exhibiting an obvious trend of clustering in phylogeny with strong bootstrap support (Fig. 6). All mitogenomes of different sub-species of Asiatic black bear i.e. U. t. japonicus, U. t. formosanus, U. t. ussuricus, U. t. thibetanus and U. t. mupinensis, formed sister branches to the U.t.laniger. In an earlier study conducted on the sequencing of complete mitogenome of Japanese black bear, U. t. laniger was not included in the phylogeny due to non-availability of the sequences28.
Figure 4.
Codon usage of the mitochondrial protein coding genes of Asiatic black bear and other nine sub-species in Ursidae family (MH281753-Ursus thibetanus laniger, EF667005- Ursus thibetanus ussuricus, DQ402478-Ursus thibetanus mupinensis, EF587265- Ursus thibetanus thibetanus, EF076773-Ursus thibetanus formosanus, AF303109-Ursus americanus, MG066704-Ursus thibetanus, AB863014-Ursus thibetanus japonicus; MN935768-Ursus thibetanus laniger (India; Present Study).
Figure 5.
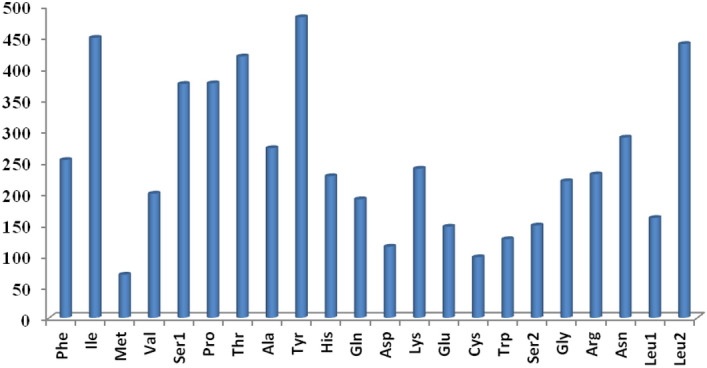
Relative synonymous codon usage (RSCU) of the mitochondrial protein-coding genes of U. thibetanus laniger mitochondrial genome. Codon count numbers are provided on x-axis and amino acids on y-axis.
Figure 6.
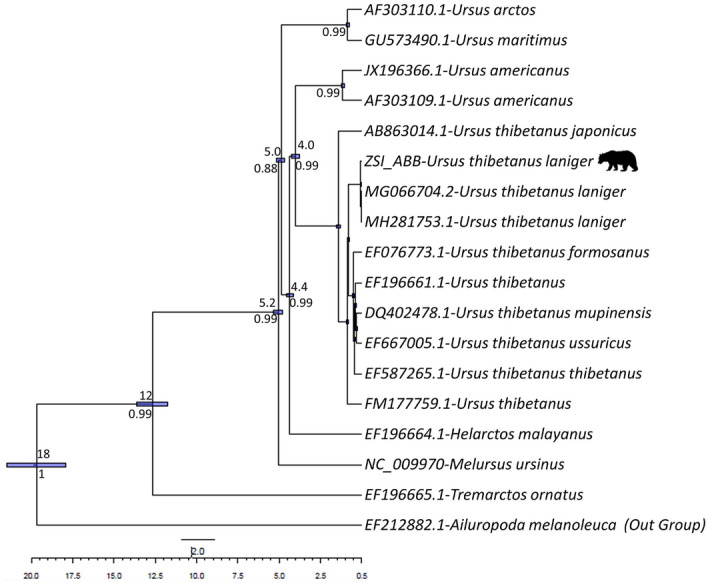
Phylogenetic relationship among Asiatic black bear and related species inferred from their whole mitochondrial genome using Bayesian inference. Posterior probability values are shown on each node. Ailuropoda melanoleuca (EF212882) was used as out-group.
Further, tRNAs secondary structure of U .t. laniger were compared with the other taxon of Ursids whose complete mitogenomes were available. The comparison showed more than 90% structure similarity with MH281753.1 (99%), MG066704.2 (99%), EF076773.1 (95%), EF19666.1 (93%) with z-score value of more than 10.0 and lesser similarity with EF196665.1 (39%) and EF212882.1 (46%) (Table S3) having low structure stability which was also evident from the phylogenetic analysis. We found no functional change in wobble position of anticodon (UAA) except in Ailuropoda melanoleuca (AAG). The pairwise genetic distances matrix, calculated based on Kimura 2-parameter model indicated that assembled mitogenome of U. t. laniger showed highest genetic differentiation with U. t. mupinensis (0.019) and lowest with the subspecies of Asiatic black bear sequenced from Nepal and Tibetan Plateau-Himalaya region (0.001), expectedly the HBB, U. t. laniger within the species of U. thibetanus (Table S4).
Conclusion
Mitogenome analysis is imperative to make inferences on species phylogenies and resolving species divergence at different taxonomic levels29,30. In the present study, size of the complete mitogenome of HBB (U.t. laniger) was found to be 16,556 bp in length and showed similar gene order as found in other sub-species of Asiatic Black bears. Further, the tRNA secondary structure comparative analysis revealed no functional change in wobble position of anticodon except in Ailuropoda melanoleuca. Similar to the tRNA secondary structure, PCGs and RSCU structural comparative analysis, we did not find any change among the different subspecies of Asiatic black bear.No structural differences in tRNA, PCGs and RSCU among different subspecies of the Asiatic Black bear indicated evolutionary conserved nature of the mitochondrial genes. Bayesian tree showed distinct clusters, species wise paraphyletic clades formed, where all the six subspecies of Asiatic black bears formed sister branches and the phylogenetic relationships were congruent with the tRNA structure similarity with the other available ursids species. The findings of the present study demonstrate the detailed workflow in rapid recovery and assembly the complete mitogenome of HBB (U.t. laniger) from the low depth sequencing data. A close similarity (99%) of HBB from Indian Himalayan region with U.t. laniger from Nepal and Tibetan Plateau-Himalaya region suggested its distribution in large area and open the scope for transboundary research among range countries for population level information. The study also generates opportunities to overcome the conventional strategies of obtaining long-range PCR and subsequently drawing phylogenetic inferences. The complete mitogenome reported in the present study is expected to allow for further genomics studies of the ursidae species and would be useful for conservation genetics.
Methods
Sample collection, DNA extraction and library preparation
We collected a small tissue portion, approx. 500 mg from a HBB carcass during the field surveys in the district of Uttarkashi of the State Uttarakhand, India. Total genomic DNA was isolated using Qiagen DNeasy Blood and Tissue Kit (Qiagen, Germany) according to the manufacturer’s instructions. The NGS was outsourced to the Xcelris Labs Pvt. Ltd. Ahmedabad, India. Approximately, 200 ng genomic DNA was sheared using Covaris S2 sonicator (Covaris, Woburn, Massachusetts, USA) to generate fragment of read length 2 × 150 bp PE. The TruSeq DNA Library Preparation kit (https://support.illumina.com/downloads/truseq) was used for the construction of the paired-end library (8 lanes) with standard protocols. The resultant library was sequenced using Illumina HiSeq 2500 (2 × 150 base paired-end reads) (Illumina, USA) platform which yielded ~ 12 million reads.
Quality check and reference-based assembly
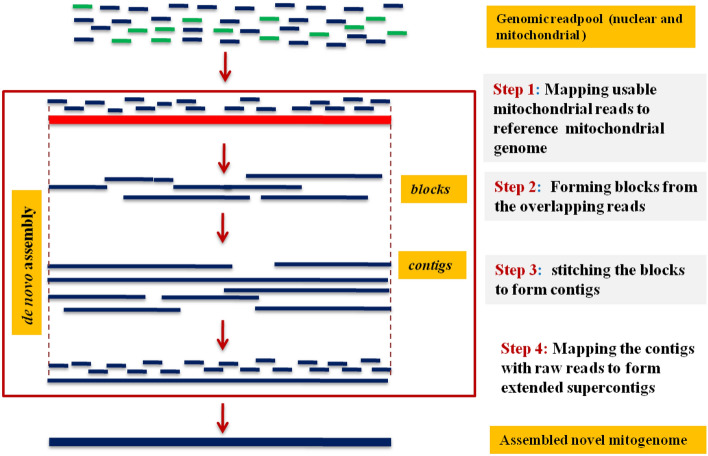
Quality screening of raw reads was done using FastQC (https://www.bioinformatics.babraham.ac.uk/projects/fastqc/) and reads with low quality (Q < 20) and shorters (< 50 bp) were filtered out using NGS QC toolkit (https://www.nipgr.res.in/ngsqctoolkit.html). Usable reads were mapped against reference genome (MH281753) using bwa-aln (0.7.17) and then the fishing reads were grouped into extended reads (blocks) and the resultant contig was re-mapped with the filtered reads in order to increase the correctness of assembly using CLC genomics workbench version 12.0.3 (https://www.qiagenbioinformatics.com/products/clc-genomics-workbench/) with default parameters One of the longest contigs that represented the assembled complete mitochondrial genome of HBB, was thus generated (Fig. 7).
Figure 7.
Pipeline adopted for the reference based de-novo assembly of the novel mitogenome from the genomic readpool.
Genome characterization and comparative analysis
The circular representation of the generated mitogenome was viewed using CGView Server (https://stothard.afns.ualberta.ca/cgview_server/)31. The 22 tRNA genes were verified using tRNAscan-SE software32 using the mammalian mitochondrial genetic code under the default mode. The gene arrangement and their order were verified using MITOS online server (https://mitos.bioinf.uni-leipzig.de). The overlapping regions and intergenic spacers were counted manually using Microsoft Excel (2007). The start and stop codon of Protein Coding Genes (PCGs) were checked through Open Reading Frame Finder (https://www.ncbi.nlm.nih.gov/orffinder/) web tool. The base skewness was calculated using AT skew = [A − T]/[A + T], GC skew = [G − C]/[G + C]33 and Short Sequence repeats (SSRs) were screened using MISA-web software34 and tandem repeats were identified using Tandem Repeat Finder (https://tandem.bu.edu/trf/trf.html) web tool35. AT-GC content and its skewness of mitogenome U. t. laniger sequences were compared with other sub-species of black bear. The comparative analysis of Relative Synonymous Codon Usage (RSCU) and codon distribution of U. t. laniger sequences and other sub-species of black bear were calculated using MEGA X36. Comparative analysis in the consistency of the secondary structure of tRNA of U. thibetanus with other available complete mitogenome of Ursidae family was done using web-beagle (https://beagle.bio.uniroma2.it/) aligner37.
Genetic distance and phylogenetic re-construction
We also downloaded 17 mitogenomes, i.e. one each from the six subspecies of Asiatic black bear -U.t.ussuricus, U.t. mupinensis, U.t. thibetanus, U.t. formosanus, U.t.laniger, U.t.japonicus, two mitogenomes of American black bear (Ursus americanus), one each from brown bear (Ursus arctos), polar bear (Ursus maritimus), sun bear (Helarctos malayanus), Sloth bear (Melursus ursinus), Spectable bear (Tremarctos ornatus), Giant panda (Ailuropoda melanoleuca), and three mitogenomes of unassigned subspecies of Asiatic black bear (Table 3). The pair-wise genetic distances were estimated using MEGA X36 among the different subspecies of Asiatic black bear and the other taxon of Ursids. Bayesian-based phylogeny among the mentioned taxon of Ursids was reconstructed using BEAUti v 1.6.1 and BEAST v.1.10.438 considering Ailuropoda melanoleuca as an out-group. We applied the best fit model HKY selected by Model test 3.639 with BIC criteria. For the molecular clock rate, we used a normal prior divergence as used by Wayne et al.40 by placing a standard deviation on the rate equals to 10% of the mean to account for variation and uncertainty in the rate. Dating analyses were performed for 20 million generations while sampling every 1000th tree, and the first 10% of trees sampled were treated as burn-in, and visualized in Figtree v 1.4.441.
Supplementary information
Acknowledgements
Authors acknowledge forest officials—Uttarakhand Forest Department for providing necessary permission and logistic support to undertake field surveys. The study was funded under the financial support received from National Mission on Himalayan Studies (NMHS; Grant No. NMHS/2017-18/LG09/02), Ministry of Environment of Forest and Climate Change (MoEF&CC), Govt. of India. The third author is supported by the Science and Engineering Research Board, DST by national post doctoral scheme (Grant No. PDF_2017_002910_2018-19) New Delhi.
Author contributions
AB, MT, SKS, BDJ, VKS, BT and LKS participated in data generation, quality check and primary data analysis. LKS and MT conceptualized the idea and AB, MT, SKS and LKS wrote the primary draft of the manuscript. LKS and MT coordinated the project funded under the National Mission Himalayan Studies (NMHS) of the Ministry of Environment, Forest and Climate Change (MoEF & CC). SKS received N-PDF from Science Engineering and Research Board, Department of Science and Technology and worked in the mentorship of MT. BT contributed in the administration, providing materials, planning and execution of the research and KC supervised the overall activities and provided all the logistic support and BT supported project activities in gaining timebound administrative approval.
Competing interests
The authors declare no competing interests.
Footnotes
Publisher's note
Springer Nature remains neutral with regard to jurisdictional claims in published maps and institutional affiliations.
These authors contributed equally: Amrita Bit and Mukesh Thakur.
Supplementary information
is available for this paper at 10.1038/s41598-020-76872-y.
References
- 1.Garshelis, D. & Steinmetz, R. Ursus thibetanus. The IUCN Red List of Threatened Species 2016. https://dx.doi.org/Downloaded on 17 January 2020 (2016).
- 2.Parter SH. The Book of Indian Animal. India: Bombay Natural History Society and Oxford University Press; 1980. [Google Scholar]
- 3.Sathyakumar S, Choudhury A. Distribution and status of asiatic black bear in India. J. Bomb. Nat. Hist. Soci. 2007;104:316–323. [Google Scholar]
- 4.Pocock RI. The Fauna of British India, Including Ceylon and Burma, Mammalia. London: Taylor and Francis; 1941. [Google Scholar]
- 5.Sathyakumar S, Kaul R, Ashraf NVK, Mookerjee A, Menon V. National Bear Conservation and Welfare Action Plan. Wildlife Institute of India and Wildlife Trust of India: Ministry of Environment and Forest; 2012. [Google Scholar]
- 6.Charoo, S.A., Sharma, L.K. & Sathyakumar, S. Asiatic Black Bear—Human Conflicts around Dachigam National Park, Kashmir. Technical Report. Wildlife Institute of India, Dehradun. 29 (2009).
- 7.Hou WR, et al. A complete mitochondrial genome sequence of Asian black bear Sichuan subspecies (Ursus thibetanus mupinensis) Int. J. Biol. Sci. 2007;3:85–90. doi: 10.7150/ijbs.3.85. [DOI] [PMC free article] [PubMed] [Google Scholar]
- 8.Yu L, et al. Analysis of complete mitochondrial genome sequences increases phylogenetic resolution of bears (Ursidae), a mammalian family that experienced rapid speciation. BMC Evol. Biol. 2007;7:198. doi: 10.1186/1471-2148-7-198. [DOI] [PMC free article] [PubMed] [Google Scholar]
- 9.Hwang DS, et al. A comprehensive analysis of three Asiatic black bear mitochondrial genomes (subspecies ussuricus, formosanus and mupinensis), with emphasis on the complete mtDNA sequence of Ursus thibetanus ussuricus (Ursidae) Mitochondrial. DNA. 2008;19:418–429. [PubMed] [Google Scholar]
- 10.Kadariya R, et al. High genetic diversity and distinct ancient lineage of Asiatic black bears revealed by non-invasive surveys in the Annapurna Conservation Area Nepal. PLoS ONE. 2018;13:0207622. doi: 10.1371/journal.pone.0207662. [DOI] [PMC free article] [PubMed] [Google Scholar]
- 11.Shendure J, Ji H. Next-generation DNA sequencing. Nat. Biotechnol. 2008;26:1135–1145. doi: 10.1038/nbt1486. [DOI] [PubMed] [Google Scholar]
- 12.Ekblom R, Galindo J. Applications of next generation sequencing in molecular ecology of non-model organisms. Heredity (Edinb) 2011;107:1–15. doi: 10.1038/hdy.2010.152. [DOI] [PMC free article] [PubMed] [Google Scholar]
- 13.Edwards SV, Shultz AJ, Campbell-Staton SC. Next-generation sequencing and the expanding domain of phylogeography. Folia Zool. 2015;64:187–206. doi: 10.25225/fozo.v64.i3.a2.2015. [DOI] [Google Scholar]
- 14.Natesh M, et al. Conservation priorities for endangered Indian tigers through a genomic lens. Sci. Rep. 2017;7:9614. doi: 10.1038/s41598-017-09748-3. [DOI] [PMC free article] [PubMed] [Google Scholar]
- 15.Song N, Cai W, Li H. Deep-level phylogeny of Cicadomorpha inferred from mitochondrial genomes sequenced by NGS. Sci. Rep. 2017;7:10429. doi: 10.1038/s41598-017-11132-0. [DOI] [PMC free article] [PubMed] [Google Scholar]
- 16.Delisle I, Strobeck C. Conserved primers for rapid sequencing of the complete mitochondrial genome from carnivores, applied to three species of bears. Mol. Biol. Evol. 2002;19:357–361. doi: 10.1093/oxfordjournals.molbev.a004090. [DOI] [PubMed] [Google Scholar]
- 17.Van Dijk E, Auger H, Jaszczyszyn Y, Thermes CT. years of next-generation sequencing technology. Trends Genet. 2014;30(9):418–426. doi: 10.1016/j.tig.2014.07.001. [DOI] [PubMed] [Google Scholar]
- 18.Heather J, Chain B. The sequence of sequencers: the history of sequencing DNA. Genomics. 2016;107(1):1–8. doi: 10.1016/j.ygeno.2015.11.003. [DOI] [PMC free article] [PubMed] [Google Scholar]
- 19.Wang S, Wang B, Wang F, Wu Z. Complete mitochondrial genome of Gallus domesticus (Galliformes: Phasianidae) Mitochondrial. DNA A DNA Mapp. Seq. Anal. 2016;27(2):978–979. doi: 10.3109/19401736.2014.926514. [DOI] [PubMed] [Google Scholar]
- 20.Zhou M, Yu J, Li J, Ouyang B, Yang J. The complete mitochondrial genome of Budorcas taxicolor tibetana (Artiodactyla: Bovidae) and comparison with other Caprinae species: Insight into the phylogeny of the genus Budorcas Int. J. Biol. Macromol. 2019;121:223–232. doi: 10.1016/j.ijbiomac.2018.10.020. [DOI] [PubMed] [Google Scholar]
- 21.Kamalakkannan R, Bhavana K, Prabhu VR, et al. The complete mitochondrial genome of Indian gaur, Bos gaurus and its phylogenetic implications. Sci. Rep. 2020;10:11936. doi: 10.1038/s41598-020-68724-6. [DOI] [PMC free article] [PubMed] [Google Scholar]
- 22.Hahn C, Bachmann L, Chevreux B. Reconstructing mitochondrial genomes directly from genomic next-generation sequencing reads – a baiting and iterative mapping approach. Nucleic Acids Res. 2013;41:129. doi: 10.1093/nar/gkt371. [DOI] [PMC free article] [PubMed] [Google Scholar]
- 23.Boore JL. Animal mitochondrial genomes. Nucleic Acids Res. 1999;27:1767–1780. doi: 10.1093/nar/27.8.1767. [DOI] [PMC free article] [PubMed] [Google Scholar]
- 24.Feng H, Feng C, Wang L, Huang Y. Complete mitochondrial genome of the golden takin (Budorcas taxicolor bedfordi) Mitochondrial. DNA. 2016;1:186–188. doi: 10.1080/23802359.2016.1149792. [DOI] [PMC free article] [PubMed] [Google Scholar]
- 25.Kumar A, et al. Sequencing and characterization of the complete mitochondrial genome of Mishmi takin (Budorcas taxi color taxicolor) and comparison with the other Caprinae species. Int. J. Biol. Macromol. 2019;137:87–94. doi: 10.1016/j.ijbiomac.2019.06.201. [DOI] [PubMed] [Google Scholar]
- 26.Sarvani RK, et al. Characterization of the complete mitogenome of Indian Mouse Deer, Moschiola indica (Artiodactyla: Tragulidae) and its evolutionary significance. Sci. Rep. 2018;8:2697. doi: 10.1038/s41598-018-20946-5. [DOI] [PMC free article] [PubMed] [Google Scholar]
- 27.Lan T, et al. Evolutionary history of enigmatic bears in the Tibetan Plateau-Himalaya region and the identity of the yeti. Proc. R. Soc. B. 2017;284:20171804. doi: 10.1098/rspb.2017.1804. [DOI] [PMC free article] [PubMed] [Google Scholar]
- 28.Jiagi W, et al. Phylogeographic and demographic analysis of the Asian Black Bear (Ursus thibetanus) based on Mitochondrial DNA. PLoS ONE. 2015;10:e0136398. doi: 10.1371/journal.pone.0136398. [DOI] [PMC free article] [PubMed] [Google Scholar]
- 29.Timmermans MJ, et al. Why barcode? High-throughput multiplex sequencing of mitochondrial genomes for molecular systematics. Nucleic Acids Res. 2010;38:e197. doi: 10.1093/nar/gkq807. [DOI] [PMC free article] [PubMed] [Google Scholar]
- 30.Cabrera-Brandt MA, Gaitan-Espitia JD. Phylogenetic analysis of the complete mitogenome sequence of the raspberry weevil Aegorhinus superciliosus (Coleoptera: Curculionidae), supports monophyly of the tribe Aterpini. Gene. 2015;571:205–211. doi: 10.1016/j.gene.2015.06.059. [DOI] [PubMed] [Google Scholar]
- 31.Grant JR, Stothard P. The CGView Server: a comparative genomics tool for circular 423 genomes. Nucleic Acids Res. 2008;36:181–184. doi: 10.1093/nar/gkn179. [DOI] [PMC free article] [PubMed] [Google Scholar]
- 32.Lowe TM, Eddy SR. tRNAscan-SE: a program for improved detection of transfer RNA genes in genomic sequence. Nucleic Acids Res. 1997;25:955–964. doi: 10.1093/nar/25.5.955. [DOI] [PMC free article] [PubMed] [Google Scholar]
- 33.Perna NT, Kocher TD. Patterns of nucleotide composition at fourfold degenerate sites of animal mitochondrial genomes. J. Mol. Evol. 1995;41:353–358. doi: 10.1007/BF01215182. [DOI] [PubMed] [Google Scholar]
- 34.Beier S, Thiel T, Munch T, Scholz U, Mascher M. MISA-web: a web server for microsatellite prediction. Bioinformatics. 2017;33:2583–2585. doi: 10.1093/bioinformatics/btx198. [DOI] [PMC free article] [PubMed] [Google Scholar]
- 35.Benson G. Tandem repeats finder: a program to analyze DNA sequences. Nucleic Acids Res. 1999;36:573–580. doi: 10.1093/nar/27.2.573. [DOI] [PMC free article] [PubMed] [Google Scholar]
- 36.Kumar S, Stecher G, Li M, Knyaz C, Tamura K. Mega X: molecular evolutionary genetics analysis across computing platform. Mol. Biol. Evol. 2018;35:1547–1549. doi: 10.1093/molbev/msy096. [DOI] [PMC free article] [PubMed] [Google Scholar]
- 37.Mattei E, Pietrosanto M, Ferree F, Citterich MH. Web-Beagle: a web server for the alignment of RNA secondary structures. Nuc Acids Res. 2015;43:493–497. doi: 10.1093/nar/gkv489. [DOI] [PMC free article] [PubMed] [Google Scholar]
- 38.Suchard MA, et al. Bayesian phylogenetic and phylodynamic data integration using BEAST 1.10. Virus Evol. 2018;4:1–5. doi: 10.1093/ve/vey016. [DOI] [PMC free article] [PubMed] [Google Scholar]
- 39.Nylander, J.A.A. MrModelTest Version 2. Programme Distributed by the Author. Evolutionary Biology Centre, Uppsala University (2004).
- 40.Wayne RK, Van VB, O'Brien SJ. Molecular distance and divergence time in carnivores and primates. Mol. Biol. Evol. 1991;8:297–319. doi: 10.1093/oxfordjournals.molbev.a040651. [DOI] [PubMed] [Google Scholar]
- 41.Rambaut, A. FigTree, Version1.4.4. Available at: https://tree.bio.ed.ac.uk/software/figtree/. (2018).
Associated Data
This section collects any data citations, data availability statements, or supplementary materials included in this article.


