Abstract
To determine whether genetic predisposition to endometriosis varies depending on ethnicity and in association with expression quantitative trait loci (eQTL) in a Taiwanese population. We conducted a genome-wide association study (GWAS) and replicated it in 259 individuals with laparoscopy-confirmed stage III or IV endometriosis (cases) and 171 women without endometriosis (controls). Their genomic DNA was extracted from blood and evaluated by the GWAS of Taiwan Biobank Array. Novel genetic variants that predispose individuals to endometriosis were identified using GWAS and replication, including rs10739199 (P = 6.75 × 10⁻⁵) and rs2025392 (P = 8.01 × 10⁻⁵) at chromosome 9, rs1998998 (P = 6.5 × 10⁻⁶) at chromosome 14, and rs6576560 (P = 9.7 × 10⁻⁶) at chromosome 15. After imputation, strong signals were exhibited by rs10822312 (P = 1.80 × 10⁻⁷) at chromosome 10, rs58991632 (P = 1.92 × 10⁻⁶) and rs2273422 (P = 2.42 × 10⁻⁶) at chromosome 20, and rs12566078 (P = 2.5 × 10⁻⁶) at chromosome 1. We used the Genotype-Tissue Expression (GTEx) database to observe eQTL. Among these SNPs, the cis-eQTL rs13126673 of inturned planar cell polarity protein (INTU) showed significant association with INTU expression (P = 5.1 × 10⁻³³). Moreover, the eQTL analysis was performed on endometriotic tissues from women with endometriosis. The expression of INTU in 78 endometriotic tissue of women with endometriosis is associated with rs13126673 genotype (P = 0.034). To our knowledge, this is the first GWAS to link endometriosis and eQTL in a Taiwanese population.
Subject terms: Genetic association study, Reproductive disorders
Introduction
Endometriosis affects 6–10% of women of reproductive age and is a common gynecological disorder, with 20–50% of women with endometriosis experiencing infertility1. The disease is characterized by the presence of endometrial tissue outside the uterus and is highly associated with pelvic pain. The pathogenesis of endometriosis is hypothesized to result from fragment of the endometrium moving back, implanting on peritoneal surfaces and continuing to grow2. However, this implantation hypothesis is not well accepted. Family history of endometriosis has been reported to increase relative risk about five-fold3,4. From twin studies, the total heritability of endometriosis is 0.47–0.51 with a common SNP-based heritability of 0.261,5,6.
Until now, several genome-wide association studies (GWAS) have found many independent single-nucleotide polymorphisms (SNPs) associated with endometriosis. The first GWAS was conducted by Uno et al. and found SNP rs10965236 located in CDKN2BAS on the chromosome 9p21 to be associated with endometriosis in a Japanese population7. The second study identified SNP rs12700667 on chromosome 7p15.2 to be associated with endometriosis in a European cohort8. Meta-analysis also identified important loci associated with endometriosis and highlighted the genes involved in hormone metabolism, which is the largest endometriosis GWAS published to date (over 17,000 cases and 191,000 controls)9,10. It is important to identify the genetic factors of endometriosis in different ethnicities. Recently, a pooling-based genome-wide scan was conducted and demonstrated ten ovarian endometrioma-associated loci11.
Herein, the GWAS are performed in the Taiwanese population to find novel variants of endometriosis. After imputation, strong signals were exhibited. Moreover, the expression quantitative trait loci (eQTL) explain the variation in expression levels of mRNA; thus, in this study, we used the Genotype-Tissue Expression (GTEx) database and detected the cis-eQTL in our endometriotic tissues. Thus, we aimed to clarify novel susceptibility loci of endometriosis and the eQTL within a Taiwanese population.
Results
Assessment of population stratification
The demographic results are shown in Table 1. We performed a case–control GWAS to identify loci associated with increased risk of endometriosis in the Taiwanese population using an Affymetrix Axiom TWB array containing 653,291 SNP probes. We initially enrolled 126 endometriosis and 96 non-endometriosis controls from a Taiwanese population residing in Taiwan. After kinship analysis and strict quality control filtering, we analyzed 620,465 SNPs representing 95% of the array SNPs for the samples from the GWAS group. Multidimensional scaling analysis and results of permutation tests for identity-by-state revealed no differences between the endometriosis and control groups, providing no evidence for strong population stratification (Fig. 1A,B). Quantile–quantile (Q–Q) plots were used to examine P value distributions, and the lambda value (λ) was 1.01 on the basis of the P value from the Cochrane–Armitage trend test, indicating no population substructure (Fig. 1C). In total, we found 33 top SNPs associated with endometriosis (P < 1 × 10⁻⁴) (Supplementary Table 1).
Table 1.
Baseline demographic summary of women with endometriosis and control (n = 430).
| Characteristics | Discovery study | Replication study | ||||
|---|---|---|---|---|---|---|
| Case n = 126 (%) | Control n = 96 (%) | P value | Case n = 133 (%) | Control n = 75 (%) | P value | |
| Age, yearsa | 35.49 (6.42) | 37.78 (6.96) | 0.0118 | 36.76 (7.15) | 41.39 (6.57) | < 0.0001 |
| BMIa, kg/m2 | 21.06 (2.79) | 23.13 (4.50) | < 0.0001 | 21.8 (3.5) | 23.97 (4.77) | 0.0008 |
| Age of menarchea | 12.66 (1.32) | 12.58 (1.28) | 0.8739 | 13.01 (1.32) | 12.63 (1.8) | 0.048 |
| Duration of menstrual cyclea | 28.06 (2.41) | 28.43 (4.52) | 0.5325 | 28.62 (3.29) | 27.14 (4.25) | 0.0227 |
| Dysmenorrhea, n (%)b | 103 (81.75) | 57 (59.38) | 0.0002 | 99 (74.44) | 58 (77.33) | 0.6409 |
Mean (SD) for continuous variables.
n (%) for discontinuous variables.
BMI body mass index, SD standard deviation.
aMann–Whitney test.
bχ2 test.
Figure 1.
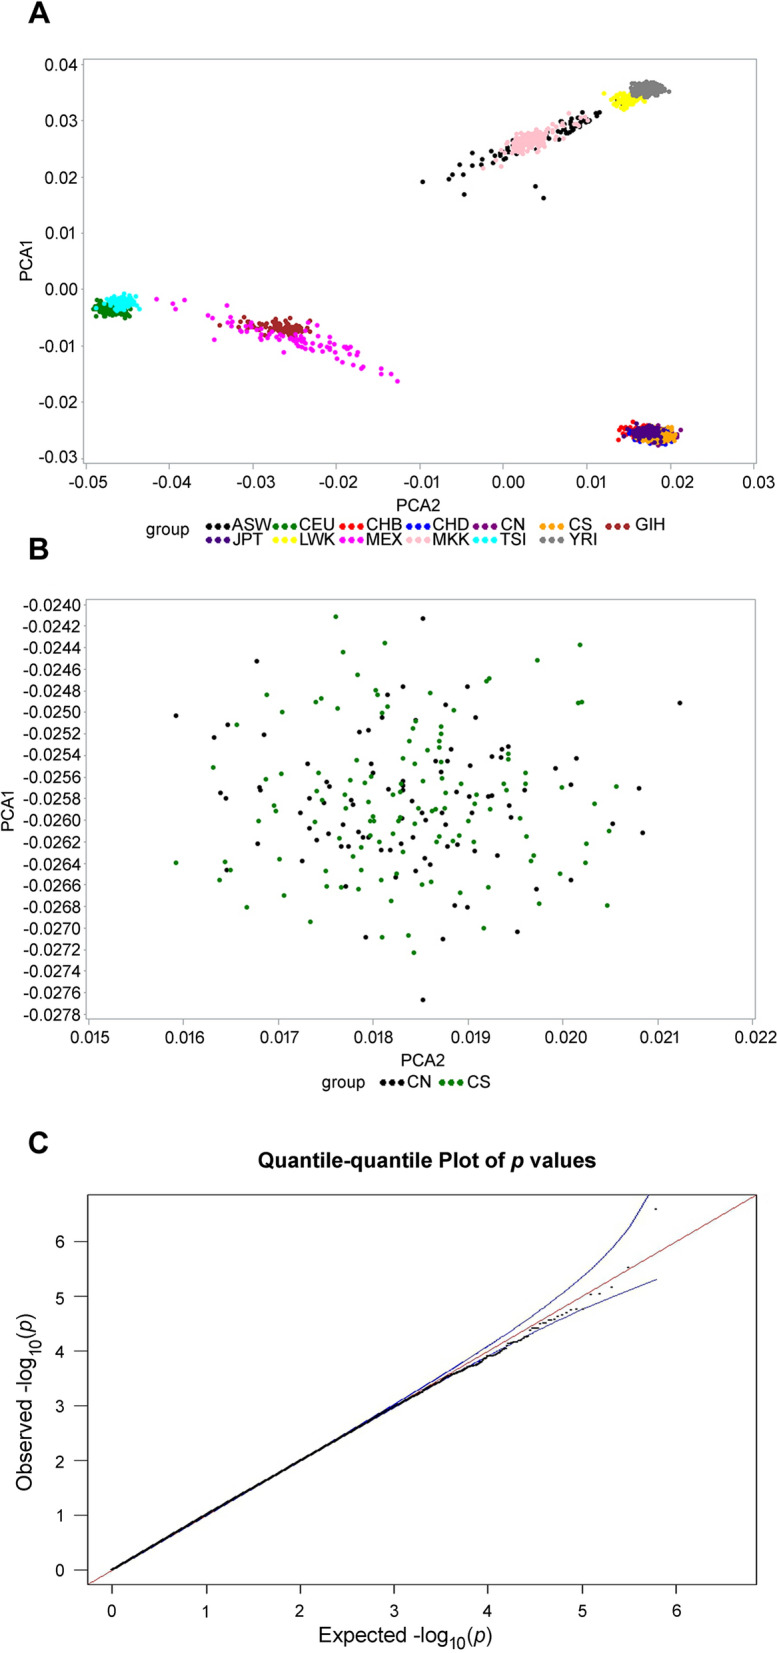
Multidimensional scaling analysis. (A) The results of multidimensional scaling analysis of the GWAS samples with HapMap populations, represented with principal component analysis (PCA) plot. (B) The results of multidimensional scaling analysis of the GWAS sample only. (C) Quantile (Q)–Quantile (Q) plot of the P value in Cochran–Armitage trend test. The lambda (λ) value is 1.01. CA case, CN control, GWAS genome-wide association study.
GWAS and cross-platform validation
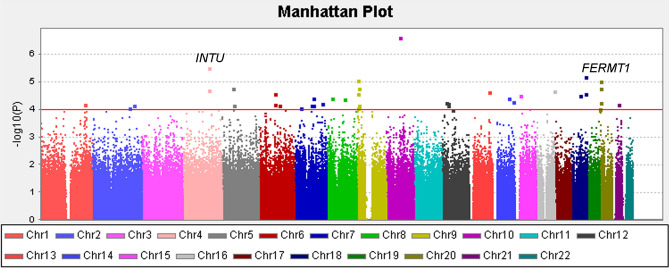
The GWAS analysis was conducted with 126 endometriosis cases and 96 controls. The Manhattan plot showed the result of genome-wide association analysis (−log10 P) in chromosomal order for 620,465 SNPs test (Fig. 2). A minimum of 99% calling of Affymetric in both endometriosis cases and controls was selected for cross-platform validation using a Sequenom MassARRAY (Supplementary Table 1).
Figure 2.
Manhattan plot of endometriosis. Results of genome-wide association analysis (− log10 P) presented in chromosomal order for 620,465 SNPs tested for association in 126 endometriosis and 96 non-endometriosis control. The x axis shows each of the SNPs used in the discovery phase. The y axis shows the − log10 P value of the trend test. Signals in inturned planar cell polarity protein (INTU) and fermitin family member 1 (FERMT1) loci are also presented. SNP single nucleotide polymorphism.
Replication of top variants for endometriosis
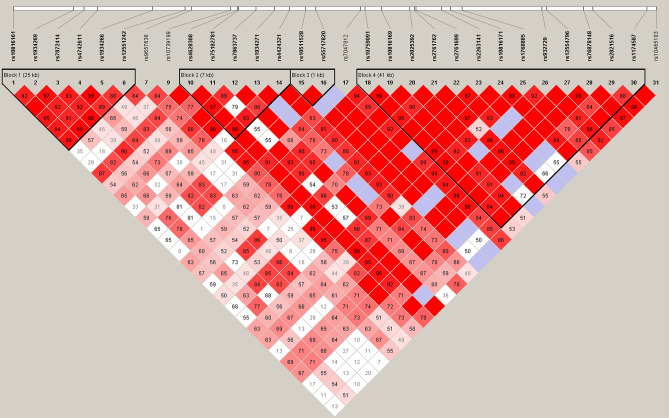
The 33 SNPs (Supplementary Table 1) were tested in the replication stage and an independent cohort of 133 patients with endometriosis and 75 controls using a Sequenom MassARRAY and Q-PCR (Supplementary Table 2). After multiple test analyses using Bonferroni correction, the association was found to be not significant. In a combined analysis of the GWAS and replication cohorts, P values for 4 of the identified SNPs were lower than 10−4, which were not genome-wide significant (P < 5.0 × 10⁻⁸) (Table 2). We found that the SNPs rs10739199 (P = 6.75 × 10⁻⁵) and rs2025392 (P = 8.01 × 10⁻⁵) located at chromosome 9 in PTPRD (protein tyrosine phosphatase, receptor type D). Two SNPs (rs10739199 and rs2025392) were found in linkage disequilibrium (LD; D’ = 0.961 and r2 = 0.208, Fig. 3). After GWAS conditional analyses of these two SNPs, the P values were increased and indicated that they were only both associated. The P values for other 2 SNPs were lower than 10–5. These two SNPs were located at chromosome 14 (rs1998998, P = 6.5 × 10⁻⁶) and at chromosome 15 (rs6576560, P = 9.7 × 10⁻⁶). These were all replicated in the independent population and calculated in joint analysis (Table 2). The P value of joint analysis is shown in Table 3 and Supplementary Table 3. However, the P value did not reach the standard genome-wide threshold (P value lower than 5 × 10⁻⁸).
Table 2.
SNPs with P values < 1 × 10⁻⁴ in joint analysis.
| Chr | SNP | Position | Gene | Allele format | Risk allele | Stage | Control/case | RAF controls | RAF cases | Trend P | OR | 95% CI | |
|---|---|---|---|---|---|---|---|---|---|---|---|---|---|
| 9 | rs10739199 | 9,707,144 | PTPRD | GA | A | GWAS | 96/126 | 0.6094 | 0.8016 | 1.70E−05 | 2.59 | 1.695 | 3.958 |
| GA | Replication | 75/133 | 0.6486 | 0.7154 | 1.73E−01 | 1.361 | 0.8841 | 2.097 | |||||
| GA | Combined | 171/259 | 0.6265 | 0.7578 | 6.75E−05 | 1.866 | 1.384 | 2.515 | |||||
| 9 | rs2025392 | 9,733,309 | PTPRD | TC | C | GWAS | 96/126 | 0.8542 | 0.964 | 7.30E−05 | 4.572 | 2.103 | 9.941 |
| TC | Replication | 75/133 | 0.9189 | 0.947 | 2.45E−01 | 1.576 | 0.7088 | 3.503 | |||||
| TC | Combined | 171/259 | 0.8824 | 0.9553 | 8.01E−05 | 2.846 | 1.671 | 4.848 | |||||
| 14 | rs1998998 | 97,680,819 | – | AG | A | GWAS | 96/126 | 0.1146 | 0.268 | 5.31E−05 | 2.829 | 1.674 | 4.782 |
| AG | Replication | 75/133 | 0.1486 | 0.2386 | 2.38E−02 | 1.795 | 1.052 | 3.062 | |||||
| AG | Combined | 171/259 | 0.1294 | 0.2529 | 6.50E−06 | 2.277 | 1.567 | 3.31 | |||||
| 15 | rs6576560 | 26,577,347 | – | TC | C | GWAS | 96/126 | 0.4896 | 0.6905 | 3.09E−05 | 2.326 | 1.576 | 3.432 |
| TC | Replication | 75/133 | 0.527 | 0.6364 | 3.78E−02 | 1.571 | 1.044 | 2.363 | |||||
| TC | Combined | 171/259 | 0.5059 | 0.6628 | 9.70E−06 | 1.92 | 1.451 | 2.541 | |||||
RAF risk allele frequency, Trend P P vale of Trend test, OR odds ratio, CI confidence interval.
Figure 3.
Linkage disequilibrium (LD) plot for the 31 PTPRD SNPs analyzed. The values in boxes are pair-wise SNP correlations (D′); bright red boxes without numbers indicate complete LD (D′ = 1). The texts above the horizontal numbers are the SNP names, and the blocks indicate haplotype blocks.
Table 3.
SNPs with p values < 1 × 10⁻³ in Joint analysis.
| Chr | SNP | Position | Gene | Allele 1 | Allele 2 | Risk allele | RAF controls | RAF cases | Joint Trend P | OR | 95% CI | HWE test P | |
|---|---|---|---|---|---|---|---|---|---|---|---|---|---|
| 4 | rs13126673 | 128,586,241 | INTU | T | C | C | 0.4793 | 0.6142 | 1.10E−04 | 1.729 | 1.309 | 2.284 | 0.0209 |
| 5 | rs2056401 | 52,363,759 | ITGA2 | G | A | A | 0.7735 | 0.8643 | 4.76E−04 | 1.865 | 1.304 | 2.668 | 0.5196 |
| 7 | rs7789771 | 90,650,256 | CDK14 | G | A | G | 0.04734 | 0.1152 | 7.21E−04 | 2.621 | 1.481 | 4.638 | 0.0423 |
| 7 | rs1358101 | 90,660,684 | CDK14 | A | C | A | 0.04706 | 0.1148 | 7.03E−04 | 2.626 | 1.484 | 4.646 | 0.0418 |
| 9 | rs10739199 | 9,707,144 | PTPRD | G | A | A | 0.6265 | 0.7578 | 6.75E−05 | 1.866 | 1.384 | 2.515 | 0.7429 |
| 9 | rs2025392 | 9,733,309 | PTPRD | T | C | C | 0.8824 | 0.9553 | 8.01E−05 | 2.846 | 1.671 | 4.848 | 0.7065 |
| 9 | rs2761699 | 9,734,220 | PTPRD | C | T | T | 0.8853 | 0.9512 | 4.05E−04 | 2.524 | 1.497 | 4.255 | 1 |
| 10 | rs10822312 | 66,314,543 | – | T | G | G | 0.6568 | 0.7724 | 4.36E−04 | 1.773 | 1.307 | 2.405 | 0.0407 |
| 14 | rs10136321 | 75,785,259 | – | A | T | A | 0.4294 | 0.5449 | 9.59E−04 | 1.591 | 1.207 | 2.098 | 0.8758 |
| 14 | rs1998998 | 97,680,819 | – | A | G | A | 0.1294 | 0.2529 | 6.50E−06 | 2.277 | 1.567 | 3.31 | 1 |
| 15 | rs6576560 | 26,577,347 | – | T | C | C | 0.5059 | 0.6628 | 9.70E−06 | 1.92 | 1.451 | 2.541 | 0.6472 |
| 18 | rs1870631 | 41,362,595 | – | A | G | G | 0.4735 | 0.5872 | 8.31E−04 | 1.582 | 1.2 | 2.084 | 0.8776 |
RAF risk allele frequency, Trend P P vale of Trend test, OR odds ratio, CI confidence interval, HWE test P Hardy–Weinberg equilibrium test P value of controls.
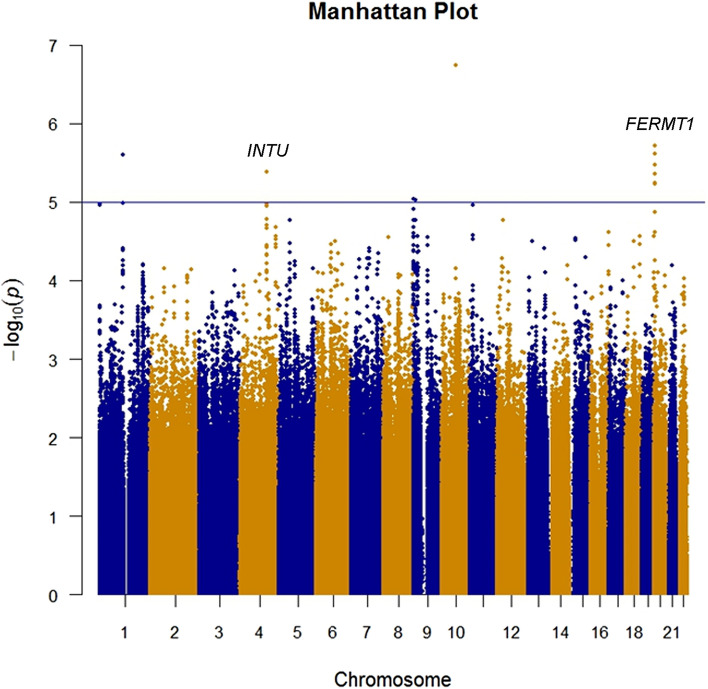
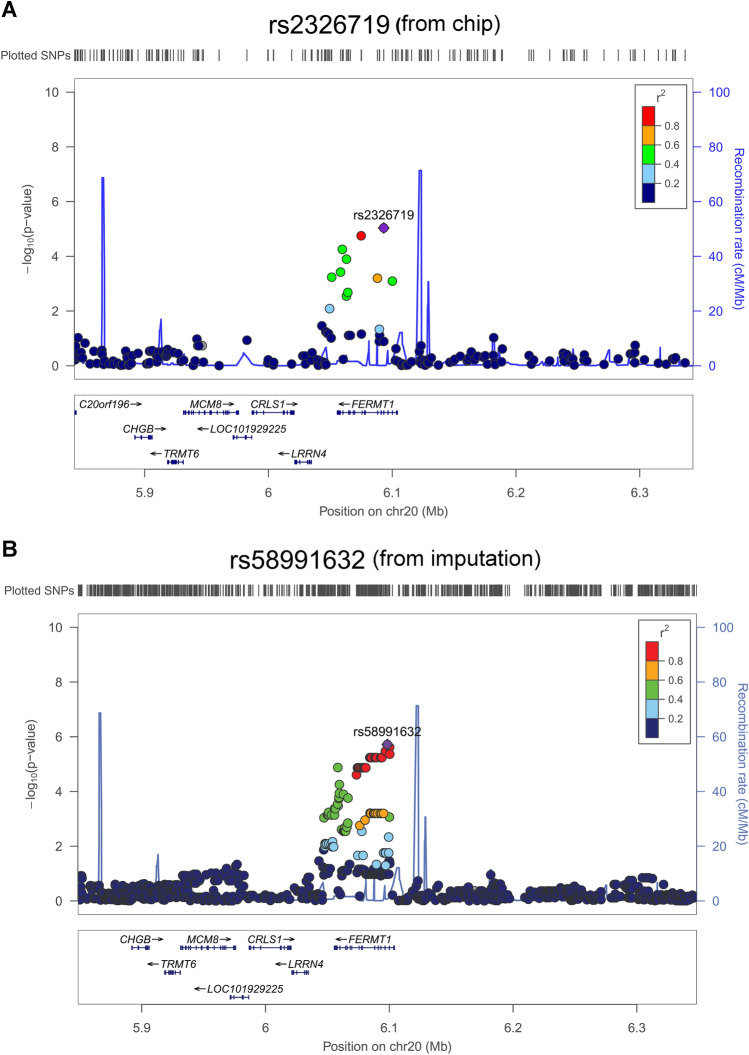
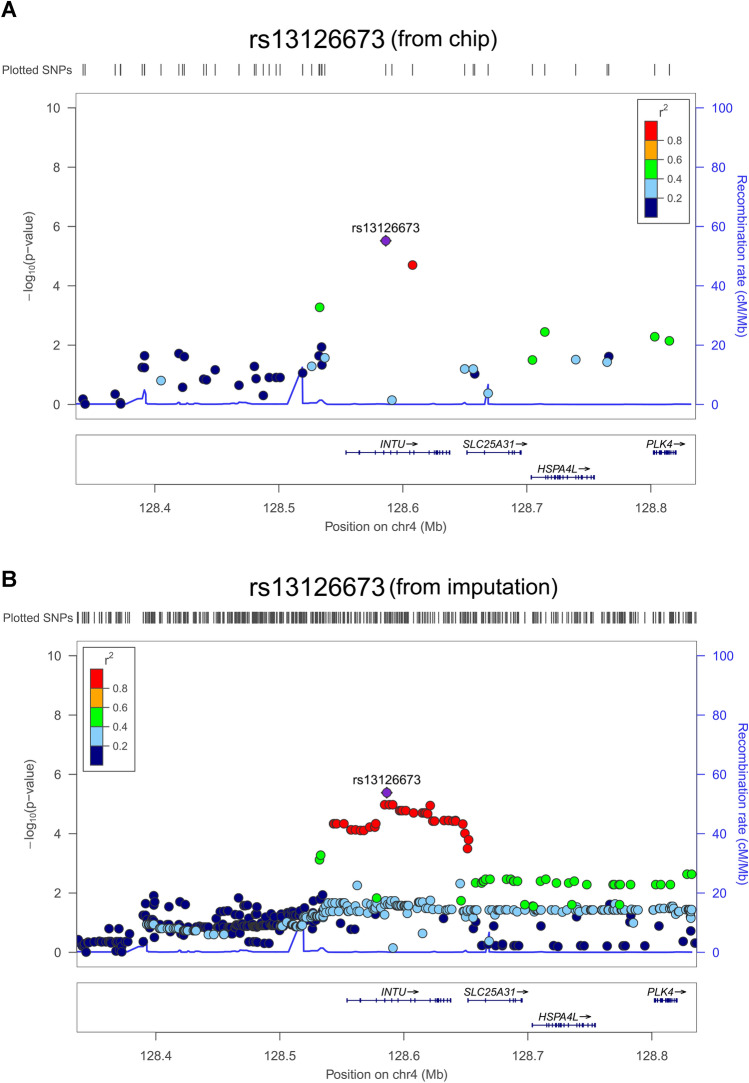
Of note, to enhance the coverage of SNPs, we imputed all loci using discovery GWAS datasets. After imputation, the top four SNPs included rs10822312 (P = 1.08 × 10⁻⁷) at chromosome 10, rs58991632 (P = 1.92 × 10⁻⁶) and rs2273422 (P = 2.42 × 10⁻⁶) at chromosome 20, and rs12566078 (P = 2.50 × 10⁻⁶) at chromosome 1 were showed in Fig. 4 and Table 4. The whole region of fermitin family member 1 (FERMT1) and INTU were identified using discovery GWAS dataset and imputation results. The reginal association plots were showed in Fig. 5 for FERMT1 and Fig. 6 for INTU.
Figure 4.
Imputation of GWAS. Results of genome-wide association analysis (− log10 P) presented in chromosomal order for 4,566,885 SNPs imputed for association between 126 endometriosis and 96 non-endometriosis control. The x axis shows each of the SNPs used in the discovery phase. The y axis shows the − log10 P value of the trend test. Signals in inturned planar cell polarity protein (INTU) and fermitin family member 1 (FERMT1) loci are presented. SNP single nucleotide polymorphism.
Table 4.
Summary of imputation studies of top 21 SNPs in trend tests.
| Chr | SNP | Position | Gene | Allele 1 | Allele 2 | Risk Allele | RAF controls | RAF cases | Imputation Trend P |
OR | 95% CI | |
|---|---|---|---|---|---|---|---|---|---|---|---|---|
| 1 | rs12566078 | 113,847,571 | – | A | G | G | 0.8333 | 0.9643 | 2.50E−06 | 5.4 | 2.51 | 11.62 |
| 4 | rs13126673 | 128,586,241 | INTU | T | C | C | 0.4531 | 0.6667 | 4.15E−06 | 2.414 | 1.64 | 3.552 |
| 9 | rs10733369 | 2,122,486 | SMARCA2 | T | C | C | 0.4427 | 0.6548 | 9.08E−06 | 2.387 | 1.624 | 3.51 |
| 9 | rs10733553 | 9,709,405 | – | A | G | G | 0.6105 | 0.808 | 9.38E−06 | 2.685 | 1.748 | 4.123 |
| 10 | rs10822312 | 66,314,543 | – | T | G | G | 0.6042 | 0.8333 | 1.80E−07 | 3.276 | 2.11 | 5.085 |
| 20 | rs58961824 | 6,084,195 | FERMT1 | T | A | A | 0.4635 | 0.6746 | 5.78E−06 | 2.399 | 1.629 | 3.534 |
| 20 | rs60811855 | 6,084,782 | FERMT1 | C | T | T | 0.4635 | 0.6746 | 5.78E−06 | 2.399 | 1.629 | 3.534 |
| 20 | rs58790452 | 6,084,920 | FERMT1 | G | A | A | 0.4635 | 0.6746 | 5.78E−06 | 2.399 | 1.629 | 3.534 |
| 20 | rs61527455 | 6,085,639 | FERMT1 | A | G | G | 0.4635 | 0.6746 | 5.78E−06 | 2.399 | 1.629 | 3.534 |
| 20 | rs59849941 | 6,085,718 | FERMT1 | G | A | A | 0.4635 | 0.6746 | 5.78E−06 | 2.399 | 1.629 | 3.534 |
| 20 | rs4407314 | 6,088,005 | FERMT1 | A | G | G | 0.4635 | 0.6746 | 5.78E−06 | 2.399 | 1.629 | 3.534 |
| 20 | rs16991857 | 6,088,993 | FERMT1 | G | A | A | 0.4635 | 0.6746 | 5.78E−06 | 2.399 | 1.629 | 3.534 |
| 20 | rs11908294 | 6,089,741 | FERMT1 | T | C | C | 0.4635 | 0.6746 | 5.78E−06 | 2.399 | 1.629 | 3.534 |
| 20 | rs2326719 | 6,093,090 | FERMT1 | A | G | G | 0.4635 | 0.6746 | 5.78E−06 | 2.399 | 1.629 | 3.534 |
| 20 | rs4300912 | 6,093,624 | FERMT1 | T | C | C | 0.4632 | 0.676 | 5.85E−06 | 2.418 | 1.639 | 3.569 |
| 20 | rs4419295 | 6,094,060 | FERMT1 | G | A | A | 0.4635 | 0.6746 | 5.78E−06 | 2.399 | 1.629 | 3.534 |
| 20 | rs75911461 | 6,096,872 | FERMT1 | T | A | A | 0.4579 | 0.6746 | 3.37E−06 | 2.454 | 1.664 | 3.62 |
| 20 | rs117103253 | 6,097,080 | FERMT1 | T | A | A | 0.4579 | 0.6746 | 3.37E−06 | 2.454 | 1.664 | 3.62 |
| 20 | rs58991632 | 6,098,405 | FERMT1 | A | G | G | 0.4521 | 0.6746 | 1.92E−06 | 2.512 | 1.701 | 3.71 |
| 20 | rs2273422 | 6,100,241 | FERMT1 | G | A | A | 0.4521 | 0.6734 | 2.42E−06 | 2.498 | 1.69 | 3.694 |
| 20 | rs2273421 | 6,100,367 | FERMT1 | C | T | T | 0.4521 | 0.668 | 4.32E−06 | 2.438 | 1.648 | 3.608 |
RAF risk allele frequency, Trend P P vale of Trend test, OR odds ratio, CI confidence interval.
Figure 5.
Association plots for the FERMT1 locus. (A) Reginal association plot for the FERMT1 locus on chromosome 20 with gene annotation imposed. Each SNP was plotted to represent its chromosomal location (x-axis) and − log10 P value (y-axis) for the trend test from the GWAS data. (B) After imputation, the SNPs were plotted, and the colors denote the strength of linkage disequilibrium of SNPs to FERMT1.
Figure 6.
Association plots for the INTU locus. (A) Regional association plot for the INTU locus on chromosome 4 with gene annotation imposed. Each SNP was plotted to represent its chromosomal location (x-axis) and − log10 P value (y-axis) for the trend test from the GWAS data. (B) After imputation, the SNPs were plotted, and the colors denote the strength of linkage disequilibrium of SNPs to INTU.
Genetic regulation of RNA transcription in endometrial tissue with defined genotypes-expression quantitative trait loci (eQTL) analysis
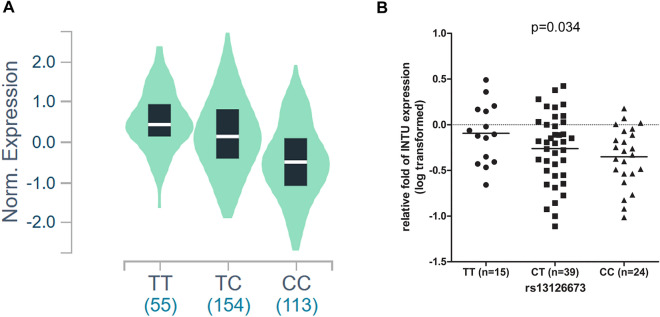
From discovery and replication studies of top 33 SNPs in trend tests, all the P values did not reach genome-wide significance. Expression quantitative trait loci (eQTL) explained the variation in expression levels of mRNA. To reveal the eQTL of the top 33 SNPs, we changed the significance threshold to 10–3 in joint analysis and found 12 SNPs (Table 3). Among them, only rs13126673 is the putative cis-eQTL. The cis-eQTL analysis was performed to investigate potential association between the variants and expression levels of transcripts. The SNP rs13126673 was located at chromosome 4 in INTU. From Genotype-Tissue Expression (GTEx) project database v8, which contained the data of 322 testes samples from normal subjects, and it revealed that individuals with a CC genotype at rs13126673 have lower INTU expression compared with TT carriers, with a P value of 5.1 × 10⁻³³ (Fig. 7A). To further explore the eQTL in endometriotic tissues, 78 tissue samples from endometriosis patients with recorded SNP genotypes, were used for total RNA extraction and INTU expression was detected using RT-q-PCR. Of note, the C allele of SNP rs13126673 is the risk allele in our GWAS sample (OR = 1.729, 95% CI: 1.309–2.284). Moreover, we detected the expression of INTU of ovarian endometriosis tissue by RT-qPCR in women with endometriosis. Women were categorized as homozygous for the risk allele [n = 24 (CC)], heterozygous for each of the variants [n = 39 (CT)], or homozygous for the alternative allele [n = 15 (TT)]. An eQTL analysis was performed to detect the effects of differing genotypes at SNP rs13126673 on the expression of the INTU transcripts; there was significant association between these genotypes and the expression of INTU transcripts observed (P = 0.034) (Fig. 7B).
Figure 7.
eQTL analysis of the normalized expression level of INTU transcripts. (A) SNP rs13126673 was significantly associated with INTU expression in the testis (P = 5.1 × 10⁻³³). Expression data were extracted from GTEx v8, which contained 322 normal subjects. Of note, the individuals with CC genotype had a lower INTU expression level. (B) The original GWAS SNP (rs13126673) genotypes [n = 15 (TT), n = 39 (CT), n = 24 (CC)] were determined by Sequenom MassARRAY, and total RNA was extracted from the tissue. The log10 transformed expression level of mRNA for inturned planar cell polarity protein (INTU) was measured using reverse transcription quantitative polymerase chain reaction and normalized to that of GAPDH. The horizontal line represents mean and individual sample is represented by dots. After analysis of linear regression, the P value was 0.034.
Effects of rs13126673 on its RNA secondary structure
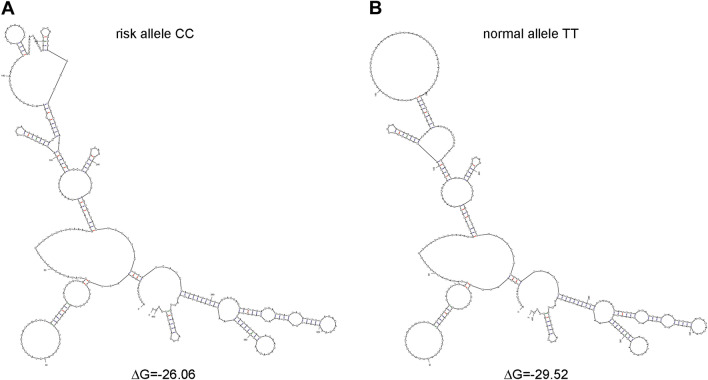
Because rs13126673 is an intronic eQTL, we investigated whether the variation of the SNP influence the RNA secondary structure. Based on the internet-linked computer modeling program mfold12, we uncovered that the different predicted RNA secondary structure based on the SNP genotype (Fig. 8A,B). The risk CC genotype had a structure with a ΔG of − 26.06 higher than normal allele TT genotype ΔG of − 29.52, suggesting that TT genotype was more stable.
Figure 8.
Alteration of computationally predicted RNA secondary structure of the region surrounding rs13126673. The RNA secondary structures in the region at rs13126673 were showed for the (A) risk allele CC and (B) normal allele TT which were predicted by mfold.
Replication of endometriosis-associated single-nucleotide polymorphism from previous genome-wide association studies
Previous studies found that several SNP were associated with endometriosis, including rs2235529 (P = 8.65 × 10⁻⁹), rs7521902 (P = 3 × 10–11), rs801112 (P = 5 × 10⁻⁶), rs16826658 (P = 2 × 10⁻⁶), rs13394619 (P = 6 × 10⁻⁹), rs1519761 (P = 4.7 × 10⁻⁸), rs6757804 (P = 4.05 × 10⁻⁸) , rs4141819 (P = 4.1 × 10⁻⁸), rs7739264 (P = 2.1 × 10⁻¹⁰) , rs7798431 (P = 1.1 × 10⁻⁷) , rs12700667 (P = 1 × 10⁻⁹), rs10965235 (P = 6 × 10–12) , rs1537377 (P = 2 × 10⁻⁹), and rs10859871 (P = 5 × 10–13)7–9,13,14. Thus, we analyzed these SNP by Sequenom MassARRAY and showed the results in Table 5. Among 14 SNPs, only rs13394619 was associated with endometriosis (P = 0.01968, OR = 1.416) (Table 5). After multiple test analyses using Bonferroni correction, the association was found to be not significant.
Table 5.
Replication of endometriosis-associated single-nucleotide polymorphism from previous genome-wide association studies (Endometriosis, n = 241, controls, n = 156).
| Chr | Position | SNP | Gene | Allele 1 | Allele 2 | Risk allele | RAF controls | RAF cases | P value | Risk allele OR | 95% CI | HWE test P |
|---|---|---|---|---|---|---|---|---|---|---|---|---|
| 1 | 22,123,994 | rs2235529 | WNT4 | C | T | C | 0.4375 | 0.4573 | 0.6598 | 1.071 | 0.8026–1.429 | 0.4156 |
| 1 | 22,164,231 | rs7521902 | WNT4 | C | A | C | 0.4243 | 0.4411 | 0.6587 | 1.078 | 0.8076–1.44 | 0.1521 |
| 1 | 228,860,875 | rs801112 | ROU-ISCAIP2 | C | T | C | 0.2072 | 0.2175 | 0.7224 | 1.074 | 0.7566–1.526 | 0.2363 |
| 1 | 22,159,378 | rs16826658 | WNT4-ZBTB40 | T | G | T | 0.4243 | 0.4553 | 0.4631 | 1.125 | 0.8435–1.502 | 0.5398 |
| 2 | 11,587,381 | rs13394619 | GREB1 | G | A | G | 0.4408 | 0.5224 | 0.01968* | 1.416 | 1.062–1.887 | 0.6933 |
| 2 | 150,776,690 | rs1519761 | RND3-RBM43 | G | A | G | 0.3388 | 0.3760 | 0.3182 | 1.17 | 0.8641–1.585 | 0.06805 |
| 2 | 150,779,318 | rs6757804 | RND3-RBM43 | C | T | C | 0.3849 | 0.4146 | 0.5019 | 1.116 | 0.8319–1.496 | 0.8374 |
| 2 | 67,637,543 | rs4141819 | ETAA1 | C | T | C | 0.0724 | 0.0894 | 0.4297 | 1.259 | 0.7387–2.146 | 1 |
| 6 | 19,785,357 | rs7739264 | ID4 | C | T | T | 0.7533 | 0.7785 | 0.4851 | 1.141 | 0.8124–1.603 | 0.788 |
| 7 | 25,821,192 | rs7798431 | NFE2L3/HOXA10 | A | G | G | 0.5493 | 0.5976 | 0.2076 | 1.213 | 0.9072–1.621 | 1 |
| 7 | 25,862,019 | rs12700667 | NFE2L3/HOXA10 | A | G | A | 0.1447 | 0.1829 | 0.1731 | 1.323 | 0.8931–1.96 | 1 |
| 9 | 22,115,106 | rs10965235 | CDKN2B-AS1 | A | C | C | 0.8355 | 0.8394 | 0.9212 | 1.029 | 0.6987–1.516 | 0.2936 |
| 9 | 22,169,701 | rs1537377 | CDKN2B-AS1 | C | T | C | 0.2566 | 0.2581 | 0.9337 | 1.019 | 0.7347–1.414 | 0.6173 |
| 12 | 95,318,100 | rs10859871 | VEZT | C | A | C | 0.2368 | 0.2459 | 0.7986 | 1.057 | 0.7559–1.477 | 0.1026 |
RAF risk allele frequency, Trend P P vale of Trend test, OR odds ratio, CI confidence interval, HWE test P Hardy–Weinberg equilibrium test P value of controls.
*indicates P < 0.05.
Discussion
Several novel genetic variants of endometriosis were identified in this study, which, to our knowledge, represents the first report of a GWAS for endometriosis conducted in a Taiwanese population (Figs. 1 and 2). In our two-independent cohort, four novel loci for endometriosis were identified and replicated. Moreover, rs10739199 and rs2025392 were found in linkage disequilibrium (Fig. 3). After GWAS conditional analyses of these two SNPs, the P values were increased, and this indicated that they were only both associated. Imputation resulted in more strong signals (Figs. 4, 5, 6). rs13126673 was found that it the cis-eQTL of testes from the GTEx database and in endometriotic tissues (Fig. 7). The rs13126673 may affect the secondary RNA structure (Fig. 8). These results suggest a heritable component in endometriosis and provide new findings into the genetic risk factors of the disease.
We found that the SNPs rs10739199 (P = 6.75 × 10⁻⁵) and rs2025392 (P = 8.01 × 10⁻⁵) located at chromosome 9 in PTPRD (protein tyrosine phosphatase, receptor type D) were associated with endometriosis. The other two SNPs were located at chromosome 14 (rs1998998, P = 6.5 × 10⁻⁶) and at chromosome 15 (rs6576560, P = 9.7 × 10⁻⁶). PTPRD is a member of the receptor protein tyrosine phosphatase (PTP) family. Mutations in PTPRD stimulate cell migration and growth in melanoma cell lines, enhance cell proliferation, and abrogate the dephosphorylation of Signal transducer and activator of transcription 3 (STAT3) in human astrocytes15,16. Several studies have shown that elevated STAT3 expression occurs in both endometriosis and endometrial cancer, suggesting STAT3 is a potential risk factor for both diseases17–20. In the present study, we found two endometriosis-associated SNPs, including rs10739199, and rs2025392 of chromosome 9 within the PTPRD gene. These novel genetic loci may provide new insights into the molecular basis of endometriosis. Moreover, deletions and mutations in PTPRD have been implicated in several tumor types, including endometrioid carcinomas in the Catalogue of Somatic Mutations in Cancer (COSMIC) database, and endometrial cancers15. Recently, a cross-disease GWAS meta-analysis revealed the rs2475335 SNP located within PTPRD to be associated with both endometriosis and endometrial cancer21. Further study of endometriosis and endometrial cancer models will be important to investigate the underlying biology of diseases-associated variants that increase the risk of both diseases22.
The major limitation of this study is the current sample size and it is too low to have real power to detect an association at a genome-wide level. However, endometriosis was reported to be common in patients with other benign gynecological diseases, especially uterine leiomyoma23. In the current study, all enrolled women had surgically confirmed diagnoses of endometriosis, and other benign gynecological diseases were used as the control group, hence the sample size was reduced. Recently, a GWAS of uterine myoma identified that eight novel genome-wide significant loci and four loci are also associated with endometriosis risk, suggesting overlapping genetic origins of uterine myoma and endometriosis24. In our study, we enrolled women with uterine myoma and other benign gynecological disorders as hospital-based controls rather than population-based controls, which does not inform the strength of endometriosis risk among other gynecological diseases. Because our controls were not healthy women, there may be some potential bias in our study. We also replicate the previous reported 14 SNPs and found that only rs13394619 was associated with endometriosis (P = 0.01968), this may due to different controls and populations. After multiple test analyses using Bonferroni correction, the association was found to be not significant. Further GWAS assessing potential susceptibility loci with genome-wide significance in different populations will verify genetic influences in the pathogenesis of endometriosis.
Moreover, we found that rs13126673 was at a novel locus on chromosome 4q28.1 with INTU and was associated with endometriosis. The rs13126673 SNP is an eQTL (expression quantitative trait loci) of INTU, which is a cilia and planar polarity effector with prominent ciliogenic roles in morphogenesis. rs13126673 is an intronic SNPs, which is not located in the predicted regulation regions of INTU transcription based on National Center for Biotechnology Information. Previous studies suggested that SNP may alter RNA/DNA structure and influence gene expression25,26. After prediction, the rs13126673 may change secondary RNA conformation (Fig. 8). The role of INTU in the pathogenesis of endometriosis will be worthwhile to study in the future.
In this study, we have provided the first genome-wide evidence in a Taiwanese population of four SNPs located in novel loci that were found to be associated with endometriosis. We have reported novel risk loci for the endometriosis-associated gene, PTPRD, that has been implicated in both endometriosis and endometrial cancer through cross-disease GWAS.
Methods
Study subjects
We recruited patients (n = 430) who underwent laparoscopic confirmation and histological analysis of endometriosis (compromising of 126 endometriosis cases from the GWAS and 96 cases from the discovery study) or who had no endometriosis (controls, comprising of 133 controls from the GWAS and 75 controls from the replication study) in the Center for Reproductive Medicine at Taipei Medical University Hospital. All diagnoses were confirmed by pathological analysis and divided into endometriosis and control groups. All women with endometriosis were diagnosed as stage III or IV endometriosis, the indication of control groups for laparoscopy includes myoma, fibrous adhesion, hydrosalpinx, ovarian cysts, teratoma, dermoid cysts, paratubal cysts, epithelial cysts, and simple cysts. A structured questionnaire was used by a trained researcher who interviewed subjects. Informed consent was obtained from each patient, and the study was approved by the Taipei Medical University joint Institutional Review Board (TMU-JIRB 201305035). All participants were Taiwanese women and all methods were carried out in accordance with relevant guidelines and regulations.
Genotyping and quality control
Genomic DNA was extracted from blood using a DNA whole-blood kit, as per the manufacturer’s instructions (Kurabo Industries, Osaka, Japan). The genotypes of each woman were performed by National Center for Genome Medicine (NCGM) at Academic Sinica using Axiom Genome-Wide TWB (Taiwan Biobank) Array Plate with a total of 653,291 SNPs. The Kinship analysis, quality control of genotypes for each SNP, total call rate, and Hardy–Weinberg Equilibrium (HWE) test were conducted by National Center for Genome Medicine. The HWE test was used to exclude SNPs departed significantly (P = 0.0001). After these tests, some SNPs were excluded from further analysis. All sample call rates were > 97%, and the mean individual sample call rate was 99.82 ± 0.37%. The linkage disequilibrium (LD) plot was generated by Haploview version 4.2 (Broad Institute, Cambridge, MA, USA).
GWAS validation and replication
The top 31 SNPs (P < 1 × 10⁻⁴) from the genome-wide association analysis of 126 endometriosis and 96 non-endometriosis controls were further validated using MALDI-TOP mass spectrometry (MassARRAY, Sequenom) (Supplementary Table 1). SNP genotypes with a success rate over 97% and with over 99% concordance between the two platforms were then genotyped. The rs16911067 and rs16934324 were genotyping by Q-PCR using Taqman SNP genotyping assay and Taqman genotyping master mix (Thermo Fisher Scientific, MA, USA). The previous reported 14 SNPs were replicated using MALDI-TOP mass spectrometry. The multiple comparison correction was analyzed by Bonferroni test using the Graphpad Prism software (California, CA, USA).
Imputation
To enhance coverage, the untyped SNPs were imputed by IMPUTE2 v2.3 using the 1000 Genome reference panel27,28. The National Center for Genome Medicine of Academia Sinica set up the haplotype inferences via the SHAPEIT method for optimizing the imputation rate29. We included a 500 kb buffer region on each side of the imputation region for elimination of edge effects and determined the uncertainty of imputed genotypes based on likelihood scoring in SNPTEST v2. Moreover, the frequentist association test of an additive model was used.
Expression quantitative trait loci (eQTL) analysis
The Genotype-Tissue Expression (GTEx) project database release the summary statistics of eQTL data of SNP rs13126673 for testis (n = 322)30. In our study, the eQTL was performed on the total of 78 tissue samples for endometriosis patients with recorded SNP genotypes. The expression of inturned planar cell polarity protein (INTU) was detected by reverse transcription quantitative polymerase chain reaction (RT-qPCR) and been described in detail elsewhere31. Glyceraldehyde-3-phosphate dehydrogenase (GAPDH) mRNA was amplified using q-PCR with the forward primer 5′-gagtccactggcgtcttcac-3′ and reverse primer 5′-gttcacacccatgacgaaca-3′. The INTU mRNA was amplified using q-PCR with the forward primer 5′-tcagcgactcgggttcat-3′ and reverse primer 5′-cagccattcaggctcaaga-3′.
Prediction of RNA secondary structure
The rs13126673 SNP upstream and downstream DNA sequences (approximately 400 bp each) were retrieved by the dbSNP of the National Center for Biotechnology Information. The mfold program was used to predict the RNA structures of retrieved risk allele or normal allele of rs13126673 using default value and calculated the value of ΔG which represented the thermodynamic stability12. The smaller ΔG represented the more stable structure12.
Statistical analysis
The statistical method used for GWAS analysis is well-established by the National Center for Genome Medicine32. Possible population stratification could affect the association analysis and detection of this was performed using EIGENSTRA2.0. The variance inflation factor for genomic controls was also estimated. GC correction and genome-wide association were performed to compare allele and genotype frequencies between cases and controls using the Cochran–Armitage trend test. The P value distribution was showed in a quantile–quantile (Q-Q) plot. Adjustment for principle components suggested that inflation was not due to population stratification. The GWAS conditional analysis was performed as previously described33. The analysis of eQTL was performed with linear regression, using IBM SPSS statistics version 22 (New York, USA).
Supplementary Information
Acknowledgements
We thank the National Center for Genome Medicine for the technical and statistics support. We thank Yi-An Chen and Yu-Chun Chen help to collect specimen at the hospital. This work was supported by the Ministry of Science and Technology (Grant number 104-2314-B-038-063-MY2, Grant number 106-2314-B-038-072, Grant number 107-2314-B-038-006), Academia Sinica (Grant number BM10501010036, Grant number BM10601010024, Grant number BM10701010027), National Health Research Institute (Grant number MG-105-SP-07, Grant number MG-106-SP-07, Grant number MG-107-SP-07) (CRT), and Ministry of Science and Technology (Grant number 107-2314-B-009-006) (YCC). This work was also supported by the Center for Intelligent Drug Systems and Smart Bio-devices (IDS2B) from The Featured Areas Research Center Program within the framework of the Higher Education Sprout Project by the Ministry of Education (MOE) in Taiwan.
Author contributions
Y.-C.C. designed the study, performed experiments, acquired, analyzed, and interpreted the data, performed the statistical analyses, and drafted the manuscript. M.-J.C., P.-H.C., C.-W.C., M.-H.Y., Y.-J.C., and E.-M.T. enrolled patients, S.-F.T. assisted statistical analysis, W.-S.K. performed experiments, and C.-R.T. guided the experimental design and enrolled patients.
Competing interests
The authors declare no competing interests.
Footnotes
Publisher's note
Springer Nature remains neutral with regard to jurisdictional claims in published maps and institutional affiliations.
Supplementary Information
The online version contains supplementary material available at 10.1038/s41598-020-79515-4.
References
- 1.Gao X, et al. Economic burden of endometriosis. Fertil. Steril. 2006;86:1561–1572. doi: 10.1016/j.fertnstert.2006.06.015. [DOI] [PubMed] [Google Scholar]
- 2.Sampson JA. Metastatic or embolic endometriosis, due to the menstrual dissemination of endometrial tissue into the venous circulation. Am. J. Pathol. 1927;3:93–110. [PMC free article] [PubMed] [Google Scholar]
- 3.Hansen KA, Eyster KM. Genetics and genomics of endometriosis. Clin. Obstet. Gynecol. 2010;53:403–412. doi: 10.1097/GRF.0b013e3181db7ca1. [DOI] [PMC free article] [PubMed] [Google Scholar]
- 4.Stefansson H, et al. Genetic factors contribute to the risk of developing endometriosis. Hum. Reprod. 2002;17:555–559. doi: 10.1093/humrep/17.3.555. [DOI] [PubMed] [Google Scholar]
- 5.Saha R, et al. Heritability of endometriosis. Fertil. Steril. 2015;104:947–952. doi: 10.1016/j.fertnstert.2015.06.035. [DOI] [PubMed] [Google Scholar]
- 6.Lee SH, et al. Estimation and partitioning of polygenic variation captured by common SNPs for Alzheimer's disease, multiple sclerosis and endometriosis. Hum. Mol. Genet. 2013;22:832–841. doi: 10.1093/hmg/dds491. [DOI] [PMC free article] [PubMed] [Google Scholar]
- 7.Uno S, et al. A genome-wide association study identifies genetic variants in the CDKN2BAS locus associated with endometriosis in Japanese. Nat. Genet. 2010;42:707–710. doi: 10.1038/ng.612. [DOI] [PubMed] [Google Scholar]
- 8.Painter JN, et al. Genome-wide association study identifies a locus at 7p15.2 associated with endometriosis. Nat. Genet. 2011;43:51–54. doi: 10.1038/ng.731. [DOI] [PMC free article] [PubMed] [Google Scholar]
- 9.Nyholt DR, et al. Genome-wide association meta-analysis identifies new endometriosis risk loci. Nat. Genet. 2012;44:1355–1359. doi: 10.1038/ng.2445. [DOI] [PMC free article] [PubMed] [Google Scholar]
- 10.Sapkota Y, et al. Meta-analysis identifies five novel loci associated with endometriosis highlighting key genes involved in hormone metabolism. Nat. Commun. 2017;8:15539. doi: 10.1038/ncomms15539. [DOI] [PMC free article] [PubMed] [Google Scholar]
- 11.Wang W, et al. Pooling-based genome-wide association study identifies risk loci in the pathogenesis of ovarian endometrioma in Chinese Han women. Reprod. Sci. 2017;24:400–406. doi: 10.1177/1933719116657191. [DOI] [PubMed] [Google Scholar]
- 12.Zuker M. Mfold web server for nucleic acid folding and hybridization prediction. Nucleic Acids Res. 2003;31:3406–3415. doi: 10.1093/nar/gkg595. [DOI] [PMC free article] [PubMed] [Google Scholar]
- 13.Albertsen HM, Chettier R, Farrington P, Ward K. Genome-wide association study link novel loci to endometriosis. PLoS ONE. 2013;8:e58257. doi: 10.1371/journal.pone.0058257. [DOI] [PMC free article] [PubMed] [Google Scholar]
- 14.Adachi S, et al. Meta-analysis of genome-wide association scans for genetic susceptibility to endometriosis in Japanese population. J. Hum. Genet. 2010;55:816–821. doi: 10.1038/jhg.2010.118. [DOI] [PubMed] [Google Scholar]
- 15.Walia V, et al. Mutational and functional analysis of the tumor-suppressor PTPRD in human melanoma. Hum. Mutat. 2014;35:1301–1310. doi: 10.1002/humu.22630. [DOI] [PMC free article] [PubMed] [Google Scholar]
- 16.Veeriah S, et al. The tyrosine phosphatase PTPRD is a tumor suppressor that is frequently inactivated and mutated in glioblastoma and other human cancers. Proc. Natl. Acad. Sci. U.S.A. 2009;106:9435–9440. doi: 10.1073/pnas.0900571106. [DOI] [PMC free article] [PubMed] [Google Scholar]
- 17.Kim BG, et al. Aberrant activation of signal transducer and activator of transcription-3 (STAT3) signaling in endometriosis. Hum. Reprod. 2015;30:1069–1078. doi: 10.1093/humrep/dev050. [DOI] [PMC free article] [PubMed] [Google Scholar]
- 18.Chen CL, et al. Stat3 activation in human endometrial and cervical cancers. Br. J. Cancer. 2007;96:591–599. doi: 10.1038/sj.bjc.6603597. [DOI] [PMC free article] [PubMed] [Google Scholar]
- 19.Prather GR, et al. Niclosamide as a potential nonsteroidal therapy for endometriosis that preserves reproductive function in an experimental mouse model. Biol. Reprod. 2016;95:76. doi: 10.1095/biolreprod.116.140236. [DOI] [PMC free article] [PubMed] [Google Scholar]
- 20.van der Zee M, et al. IL6/JAK1/STAT3 signaling blockade in endometrial cancer affects the ALDHhi/CD126+ stem-like component and reduces tumor burden. Cancer Res. 2015;75:3608–3622. doi: 10.1158/0008-5472.CAN-14-2498. [DOI] [PubMed] [Google Scholar]
- 21.Painter JN, et al. Genetic overlap between endometriosis and endometrial cancer: evidence from cross-disease genetic correlation and GWAS meta-analyses. Cancer Med. 2018;7:1978–1987. doi: 10.1002/cam4.1445. [DOI] [PMC free article] [PubMed] [Google Scholar]
- 22.Edwards SL, Beesley J, French JD, Dunning AM. Beyond GWASs: illuminating the dark road from association to function. Am. J. Hum. Genet. 2013;93:779–797. doi: 10.1016/j.ajhg.2013.10.012. [DOI] [PMC free article] [PubMed] [Google Scholar]
- 23.Tanmahasamut P, Noothong S, Sanga-Areekul N, Silprasit K, Dangrat C. Prevalence of endometriosis in women undergoing surgery for benign gynecologic diseases. J. Med. Assoc. Thai. 2014;97:147–152. [PubMed] [Google Scholar]
- 24.Gallagher CS, et al. Genome-wide association and epidemiological analyses reveal common genetic origins between uterine leiomyomata and endometriosis. Nat. Commun. 2019;10:4857. doi: 10.1038/s41467-019-12536-4. [DOI] [PMC free article] [PubMed] [Google Scholar]
- 25.Lu L, et al. Functional study of risk loci of stem cell-associated gene lin-28B and associations with disease survival outcomes in epithelial ovarian cancer. Carcinogenesis. 2012;33:2119–2125. doi: 10.1093/carcin/bgs243. [DOI] [PubMed] [Google Scholar]
- 26.Lu L, et al. An insulin-like growth factor-II intronic variant affects local DNA conformation and ovarian cancer survival. Carcinogenesis. 2013;34:2024–2030. doi: 10.1093/carcin/bgt168. [DOI] [PubMed] [Google Scholar]
- 27.Howie BN, Donnelly P, Marchini J. A flexible and accurate genotype imputation method for the next generation of genome-wide association studies. PLoS Genet. 2009;5:e1000529. doi: 10.1371/journal.pgen.1000529. [DOI] [PMC free article] [PubMed] [Google Scholar]
- 28.Marchini J, Howie B, Myers S, McVean G, Donnelly P. A new multipoint method for genome-wide association studies by imputation of genotypes. Nat. Genet. 2007;39:906–913. doi: 10.1038/ng2088. [DOI] [PubMed] [Google Scholar]
- 29.Howie B, Fuchsberger C, Stephens M, Marchini J, Abecasis GR. Fast and accurate genotype imputation in genome-wide association studies through pre-phasing. Nat. Genet. 2012;44:955–959. doi: 10.1038/ng.2354. [DOI] [PMC free article] [PubMed] [Google Scholar]
- 30.G. T. Consortium et al. Genetic effects on gene expression across human tissues. Nature. 2017;550:204–213. doi: 10.1038/nature24277. [DOI] [PMC free article] [PubMed] [Google Scholar]
- 31.Chou YC, et al. Exposure to mono-n-butyl phthalate in women with endometriosis and its association with the biological effects on human granulosa cells. Int. J. Mol. Sci. 2020 doi: 10.3390/ijms21051794. [DOI] [PMC free article] [PubMed] [Google Scholar]
- 32.Lee YC, et al. Two new susceptibility loci for Kawasaki disease identified through genome-wide association analysis. Nat. Genet. 2012;44:522–525. doi: 10.1038/ng.2227. [DOI] [PubMed] [Google Scholar]
- 33.Yang J, et al. Conditional and joint multiple-SNP analysis of GWAS summary statistics identifies additional variants influencing complex traits. Nat. Genet. 2012;44(369–375):S361–S363. doi: 10.1038/ng.2213. [DOI] [PMC free article] [PubMed] [Google Scholar]
Associated Data
This section collects any data citations, data availability statements, or supplementary materials included in this article.


