Abstract
Purpose
We correlated quantitative fundus autofluorescence (qAF) with other fundus features in patients exhibiting central serous chorioretinopathy (CSC).
Methods
Short wavelength fundus autofluorescence (SW-AF, 488 nm excitation) was measured by qAF. Using nonnormalized images qAF values were calculated within eight concentric segments (qAF8) located at an eccentricity of 7° to 9°. Horizontal spectral domain optical coherence tomography (SD-OCT) scans and near-infrared fundus autofluorescence images (NIR-AF) were studied.
Results
Thirty-six eyes of 20 patients (mean age 48.7± 8.5 years) diagnosed with CSC were studied. Thirteen patients had bilateral disease; four patients were female. In 22 eyes CSC was present in the macula; in one eye the lesion was in a peripapillary location, 10 involved both locations, and three were unaffected. Serous retinal detachment, retinal pigmented epithelial detachment (PED), outer retinal atrophy and subRPE hypertransmission were all features identifiable by SD-OCT. NIR-AF images were helpful in detecting foveal and parafoveal lesions. Sampling for retina-wide elevations in SW-AF intensity by measuring qAF8 did not indicate a generalizable relationship amongst CSC-diagnosed eyes. However, color-coded qAF images revealed alterations in SW-AF topography and intensity relative to healthy eyes at the same locations. Thus zones of higher than normal qAF intensity were found in association with SD-OCT detectable PED; loss of ellipsoid zone and interdigitation zone; and hyperreflectivity in outer retina. Pronounced decreases in qAF colocalized with serous retinal detachment and with outer retinal degeneration that included hypertransmission of SD-OCT signal into the choroid.
Conclusions
Localized elevations in qAF reflect increased bisretinoid in association with CSC lesions.
Translational Relevance
Foci of elevated qAF at some stages of CSC contribute to the natural history of the disease.
Keywords: central serous chorioretinopathy, fundus autofluorescence, near infrared fundus autofluorescence, photoreceptor, quantitative fundus autofluorescence, retinal pigment epithelium, short-wavelength fundus autofluorescence, spectral domain optical coherence tomography
Introduction
Central serous chorioretinopathy (CSC), an idiopathic condition, is characterized by serous detachment of the neurosensory retina in the macular area; in some cases, there is also a detachment of the retinal pigment epithelium (RPE).1,2 CSC predominantly occurs in healthy men between 20 and 50 years of age.3 CSC is believed to be caused by focal leakage of fluid at the level of the RPE monolayer4; otherwise, the mechanisms underlying CSC are poorly understood.5 CSC is considered to be the fourth most common nonsurgical cause of maculopathy after age-related macular degeneration, diabetic retinopathy, and branch retinal vein occlusion.4,6,7
The diagnosis of CSC increasingly relies on spectral domain optical coherence tomography (SD-OCT) and short-wavelength fundus autofluorescence (SW-AF). In SW-AF images the site of RPE leakage typically presents as a focal area of hypoautofluorescence. An initial reduction in SW-AF throughout the area of serous retinal detachment is also observed 4,8 perhaps because subretinal fluid blocks the transmission of fundus AF. 4,8–10 Without treatment CSC can often resolve with the acute phase of the serous retinal detachment subsiding within four weeks to four months,6 and after resolution of the serous detachment the hypo-AF area may revert to a normal pattern on SW-AF in most or all eyes at about four to six months.11 However, in a subset of acute CSC cases, persistent retinal detachment is associated with increased SW-AF over the area of detachment or with patches of speckled or mottled SW-AF signal and a progressive increase in the intensity of SW-AF.12,13
The SW-AF signal originates from bisretinoid by-products of the visual cycle that form in photoreceptor cells and are transferred secondarily to RPE. These fluorophores accumulate throughout life and have been shown to undergo increased synthesis in some retinal disorders.14 Our intention in the study reported here was to aid the interpretation of SW-AF in CSC cases by determining whether the elevated SW-AF of the CSC lesion originates from an actual increase in the levels of fluorophores. Thus we have used the principles of quantitative fundus autofluorescence (qAF) that enable comparisons between healthy and diseased eyes and among images acquired from a patient cohort. We also studied near-infrared autofluorescence (NIR-AF) imaging of RPE melanin to assess RPE integrity.
Methods
Patient Enrollment
In this prospective study, consecutive cases with a clinical diagnosis of CSC were recruited prospectively at the Edward S. Harkness Eye Institute, Columbia University (Table). CSC diagnosis was based on findings from both clinical examination and multimodal images. The findings included the presence of serous macular detachment, thick choroid with congested choroidal vasculature and pigment alterations as noted by color fundus photography, fundus autofluorescence and SD-OCT. Patients with clinical or angiographic evidence of neovascular maculopathy secondary to pathological myopia, angioid streaks or polypoidal choroidal vasculopathy masquerading were excluded from the study.
Table.
Clinical Characteristics, Quantitative Autofluorescence (qAF8) Values and OCT Findings
| Visual Acuity | Type Based On Predominant Location of SRF ± RPE Atrophic Changes | OCT Findings Overlying the qAF8 Ring | |||||||||
|---|---|---|---|---|---|---|---|---|---|---|---|
| Patient No. | Age (y), Gender, Eye | Duration of Present Episode of CSC (mos.) | Snellen's | LogMAR | Macular | Peripapillary | qAF8 Values | SRF | PED | IZ, EZ, ELM Changes | Hyper-Trans-Mission Into the Choroid |
| 1 | 47 M, OD | 6 | 20/30 | 0.2 | Y | — | 390 | N | N | Y | Y |
| 2 | 42 M, OD | 3 | 20/40 | 0.3 | Y | — | 236 | Y | N | N | N |
| 42 M, OS | 3 | 20/50 | 0.4 | Y | — | 308 | Y | N | Y | Y | |
| 3 | 48 M, OD | 6 | 20/20 | 0 | Y | — | 439 | Y | Y | Y | N |
| 48 M, OS | Asymptomatic | 20/20 | 0 | Y | — | 565 | N | Y | Y | Y | |
| 4 | 39 M, OS | 12 | 20/20 | 0 | Y | Y | 509 | Y | N | Y | N |
| 5 | 55 M, OD | 9 | 20/20 | 0 | Y | — | 301 | Y | N | Y | Y |
| 55 M, OS | Asymptomatic | 20/20 | 0 | Y | — | 268 | N | N | Y | N | |
| 6 | 60 F, OD | Asymptomatic | 20/20 | 0 | Y | Y | 492 | N | N | Y | Y |
| 60 F, OS | 12 | 20/40 | 0.3 | Y | — | 383 | Y | N | Y | Y | |
| 7 | 64 M, OD | 27 | 20/20 | 0 | Y | — | 416 | N | N | Y | N |
| 64 M, OS | 27 | 20/20 | 0 | Y | Y | 278 | Y | Y | Y | Y | |
| 8 | 36 M, OD | 84 | 20/20 | 0 | Y | — | 142 | N | Y | N | N |
| 36 M, OS | 84 | 20/20 | 0 | Y | Y | 205 | N | Y | Y | Y | |
| 9 | 58 F, OD | Asymptomatic | 20/20 | 0 | Y | — | 217 | N | N | Y | N |
| 58 F, OS | 27 | 20/20 | 0 | Y | Y | 202 | Y | N | Y | Y | |
| 10 | 47 M, OD | 5 days | 20/20 | 0 | — | Y | 524 | Y | N | Y | N |
| 11 | 36 M, OD | Asymptomatic | 20/20 | 0 | Y | — | 157 | N | Y | Y | N |
| 36 M, OS | 12 | 20/25 | 0.1 | Y | — | 201 | Y | N | Y | N | |
| 12 | 49 M, OD | 12 | 20/30 | 0.2 | Y | — | 259 | Y | Y | Y | N |
| 49 M, OS | Asymptomatic | 20/20 | 0 | Y | — | 791 | Y | N | Y | Y | |
| 13 | 49 M, OD | 2 | 20/80 | 0.6 | Y | Y | 300 | Y | N | Y | N |
| 49 M, OS | Asymptomatic | 20/20 | 0 | Y | — | 306 | Y | N | Y | N | |
| 14 | 54 F, OS | Asymptomatic | 20/20 | 0 | Y | — | 409 | N | Y | N | N |
| 15 | 60 F, OD | 40 | 20/30 | 0.2 | Y | — | 380 | Y | Y | Y | N |
| 16 | 39 M, OD | 12 | 20/20 | 0 | Y | — | 140 | Y | N | Y | Y |
| 17 | 38 M, OD | Asymptomatic | 20/25 | 0.1 | Y | Y | 291 | N | Y | Y | Y |
| 38 M, OS | Asymptomatic | 20/40 | 0.3 | Y | Y | 105 | N | N | Y | Y | |
| 18 | 47 M, OS | Asymptomatic | 20/25 | 0.1 | Y | — | 521 | N | N | Y | Y |
| 19 | 41 M, OD | Asymptomatic | 20/25 | 0.1 | Y | — | 394 | N | N | Y | Y |
| 41 M, OS | Asymptomatic | 20/25 | 0.1 | Y | — | 410 | N | N | Y | Y | |
| 20 | 54 M, OD | 31 | 20/25 | 0.1 | Y | Y | 365 | Y | Y | Y | N |
| 54 M, OS | 4 | 20/20 | 0 | Y | Y | 472 | Y | Y | Y | N | |
CNV, choroidal neovascular; ELM, external limiting membrane; F, female; M, male; N, no; No., number; SRF, subretinal fluid; VA, visual acuity; Y, yes.
All patients underwent a comprehensive eye examination including dilated fundus evaluation. The exclusion criteria included diagnosis other than CSC such as macular dystrophy or age-related macular degeneration or intake of medications known to cause pigmentary changes. Based on SD-OCT and en face fundus images, subjects were assigned to groups based on the lesion location: macular cases wherein the lesion was located within two disc diameters from the fovea; peripapillary cases wherein the lesion presented within one disc diameter from the optic disc head, or combined cases if there was evidence of both macular and peripapillary lesions with foveal involvement. Patients had their fellow contralateral eye described as CSC-free if there was no evidence of a CSC lesion.
The study was approved by the Institutional Review Board of the Columbia University and complied with the Health Insurance Portability and Accountability Act of 1996. Written informed consent was obtained from all subjects after full explanation of the study procedures, and all procedures were adhered to the tenets of the Declaration of Helsinki.
Image Acquisition
We have previously described the protocol for the acquisition of SW-AF images that meet the quality standard necessary for quantification.15 Briefly, pupils were dilated with topical 1% tropicamide and 2.5% phenylephrine. SW-AF images (30° × 30° field, 488 nm excitation) were acquired using a confocal scanning laser ophthalmoscope (cSLO, Spectralis HRA+OCT; Heidelberg Engineering, Heidelberg, Germany) that had been modified by the insertion of an internal fluorescent reference to account for variation in laser power and detector gain.15 First, an infrared-reflectance image was recorded, and then the fundus was exposed to blue light to bleach rhodopsin (using AF mode, 488 nm excitation, beam power <260 µW). For an imaging session, two videos were recorded to generate the AF images for analysis. By using indocyanine-green angiography mode, NIR-AF images (30° × 30° field, 787 nm excitation, >830 nm emission; HRA2-SLO, Heidelberg Engineering) were also acquired. In addition, SD-OCT images were acquired with Spectralis HRA+OCT (Heidelberg Engineering, Heidelberg, Germany) by using a 6 x 6-mm grid and a resolution of 512 × 128 (A-scans × B-scans) centered on the fovea. Two patients had SD-OCT images performed with Cirrus HD-OCT (Cirrus 4000, Carl Zeiss Meditec Inc, Dublin, California, USA).
Image Analysis
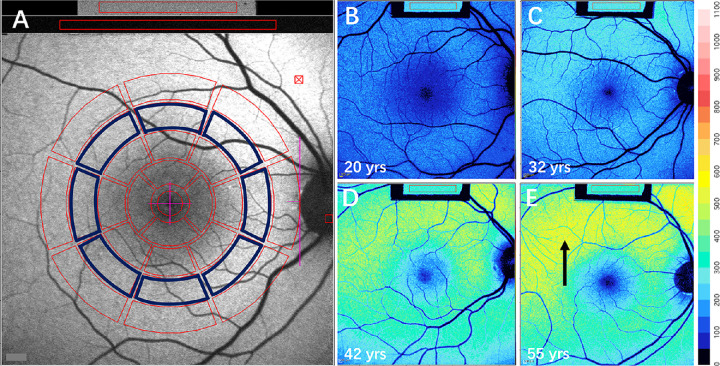
Images were captured and analyzed by an experienced ophthalmologist (LH) using dedicated image analysis software written in IGOR (WaveMetrics, Lake Oswego, OR, USA) to determine qAF values.6 The software recorded the mean gray levels (GLs) within the internal reference and within a standardized measurement area consisting of 8 preset circularly arranged segments positioned at an eccentricity of about 7° to 9° (qAF8) (Fig. 1A). The qAF value for each segment was calculated by considering the reference calibration factor, the internal reference GL, zero GL, magnification, and optical media density from normative data on lens transmission spectra.6,7 Additional analysis was performed in which only segments overlapping the CSC lesion were averaged. The mean qAF8 of study subjects, as well as the segmental qAF, were compared with previously published healthy controls (374 eyes; age range 5–60 years).6
Figure 1.
Quantitative measurement of short-wavelength autofluorescence. (A) To analyze qAF, mean GLs are recorded from eight circularly arranged segments (outlined in blue) at 7° to 8° eccentricity and centered on the fovea. The average of qAF values of the eight segments is defined as qAF8. GL was also measured in the internal fluorescence reference (gray rectangle box, top of image). (B–E) Color-coded qAF images acquired from healthy eyes. Ages (20, 32, 42, and 55 years) are indicated. Lower qAF values are coded in blue and higher values in red. Typically the highest levels are observed superotemporally (arrow in E). A color scale of qAF units (0–1100) is provided on the right margin.
Statistical Analysis
Prism 8.4 (GraphPad Software) was used to determine statistical significance.
Results
Demographic and Clinical Characteristics
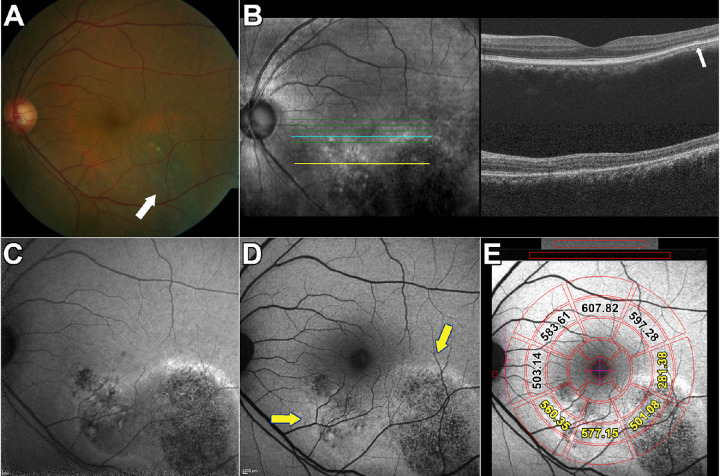
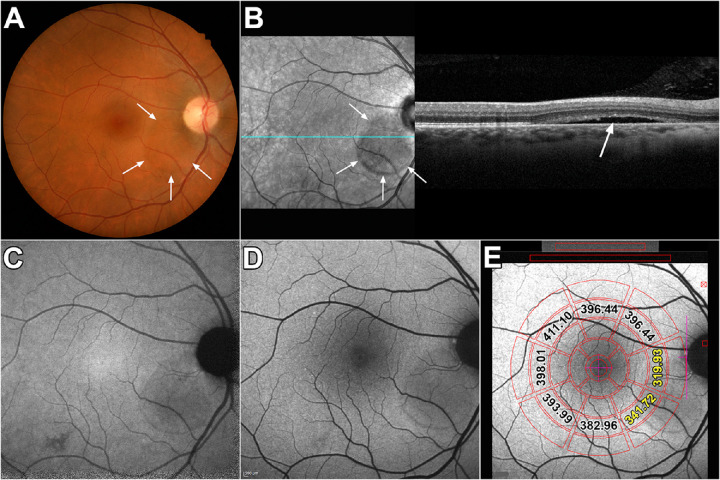
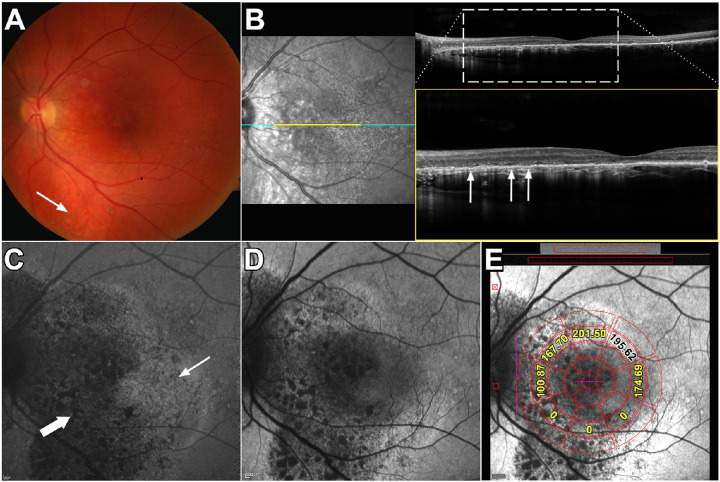
For the 20 enrolled patients (36 eyes, Table) the mean age was 48.7 ± 8.5 years (range 36–64 years), and four were females (P6, P9, P14, P15). Snellen's visual acuity range was 20/20-20/50, and mean LogMAR was 0.08 ± 0.14 (range 0–0.6). Four eyes were excluded from the analysis because of ungradable images (three eyes, P1 OS, P10 OS, and P16 OS) and a diagnosis other than CSC (one eye, P4 OD). Of the remaining 36 eyes, 22 lesions were located in the macula (macular lesion) (Fig. 2); one lesion was located in the peripapillary area (peripapillary lesion) (Fig. 3), and 10 lesions involved both the macula and peripapillary region (combined lesion) (Fig. 4). In three patients no lesions were present in the fellow eye (CSC-free). Thirteen patients presented with bilateral CSC. Identification numbers (ID) were randomly assigned to the patients.
Figure 2.
Multimodal images of central serous chorioretinopathy. Patient 3: Macular lesion. (A) Color fundus photographs demonstrate an RPE atrophic track extending inferotemporally (arrow) with a second smaller lesion inferior and nasal to fovea. (B) Infrared reflectance (IR-R) (left) and SD-OCT scan (right). Minimal retinal PED is visible temporal to the fovea (arrow) in the upper scan. The horizontal blue and yellow lines in the IR-R image indicate the axes of the SD-OCT scans. (C) NIR-AF image. The NIR-AF signal from melanin is reduced within the lesion. The superior edge of the lesion presented with hyperfluorescent signal. The normally elevated NIR-AF in the fovea is not visible. (D) Short wavelength fundus autofluorescence (SW-AF). The centers of the lesions are hypoautofluorescent while the margins are hyperautofluorescent (arrows). (E) SW-AF image with overlapping qAF grid. The numbers indicate qAF values in the specific segments. Yellow numbers indicate segments overlapping the CSC lesion.
Figure 3.
Multimodal images of peripapillary lesion. Patient 10: (A) Color fundus photograph reveals the edge of an area of subretinal fluid inferonasal to the optic disc (arrows). (B) Infrared reflectance (IR-R) (left) and SD-OCT scan (right). Subretinal fluid with detachment of neural retina from RPE is apparent in IR-R and SD-OCT images (arrows). The EZ line is discontinuous at the edge of the lesion. Outer segments extend posteriorly into the lesion. The horizontal line in the IR-R image indicates axis of the scan. (C) NIR-AF image reveals normal hyperautofluorescence in the fovea due to increased optical density of melanin. A region of attenuated NIR signal is seen in the area of the lesion. (D) SW-AF image reveals hypoautofluorescence in association with the lesion. (E) SW-AF image with overlapping qAF grid. The numbers indicate qAF values in the specific segments. Yellow numbers indicate segments overlapping the CSC lesion.
Figure 4.
Multimodal images of combined macular and peripapillary lesions. Patient 17: (A) Color fundus photograph. Lesion presents as a perifoveal mottled pigment nasal, superior and inferior to the fovea. The lesion also extends below the inferior arcade (arrow). (B) Infrared reflectance (IR-R) (left) and SD-OCT scan (right). The area in the SD-OCT indicated by the dashed rectangle is expanded below. Outer retinal atrophy with hypertransmission into the choroid is visible nasal to the fovea (arrows). The horizontal line in the IR-R image indicates axis of the SD-OCT scan. (C) NIR-AF image. The NIR-AF signal from melanin is reduced within the lesion (thick arrow). Other areas of the lesion appear to exhibit hyperautofluorescence (thin arrow). (D) Short wavelength/blue fundus autofluorescence image. Extensive signal mottling is apparent. (E) SW-AF image with overlapping qAF grid. The numbers indicate qAF values in the specific segments. Yellow numbers indicate segments overlapping the CSC lesion.
Fundus Autofluorescence Imaging: Qualitative Analysis
NIR-AF images (excitation 787 nm; emission >800 nm) obtained from healthy eyes presented with elevated foveal autofluorescence intensity that is indicative of increased melanin optical density in an area ∼8° in diameter.16,17 Outside of this central area, the signal is relatively uniform. In the cohort of CSC diagnosed patients, NIR-AF images were available in 16 eyes. The central elevation in NIR-AF typical of healthy eyes was not visible in seven eyes exhibiting a CSC lesion (Fig. 2C).
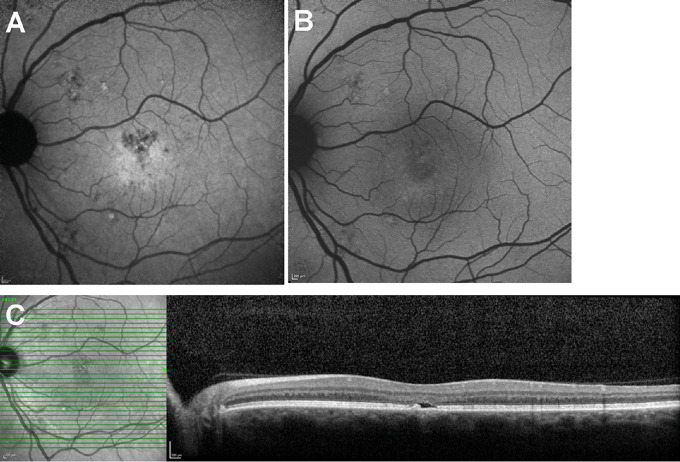
Patient 10 (Figs. 3B–3D and Fig. 6, P10) presented with acute CSC associated with a serous retinal detachment. The retinal detachment appeared as a slightly darkened lesion in NIR-R and in SW-AF and NIR-AF images (Fig. 3 C,D). The full extent of the CSC lesions were often visible in both SW-AF and NIR-AF images. An example of an exception to this is shown in Figure 2(P3) wherein the inferonasal edge of the lesion is resolved with greater clarity in the NIR-AF image. Dark SW-AF patches visible in SW-AF images often corresponded to darkness in NIR-AF and likely were indicative of loss of RPE at those locations. The latter supposition is supported by the presence of hypertransmission of SD-OCT signal in those areas (P17; Figs. 4B–4D). At some sites in the CSC lesions hyper-NIR-AF signal was present that corresponded to elevated SW-AF (P17; Fig. 4C). Small foveal and parafoveal lesions detected in the SD-OCT scan (Fig. 5C) were also readily visualized in the NIR-AF images because the darkness of the lesion contrasted with the central NIR-AF brightness (Fig. 5A); conversely in SW-AF images the macular pigment-associated reduction in SW-AF signal interfered with the detectability of the CSC lesions (Fig. 5B).
Figure 6.
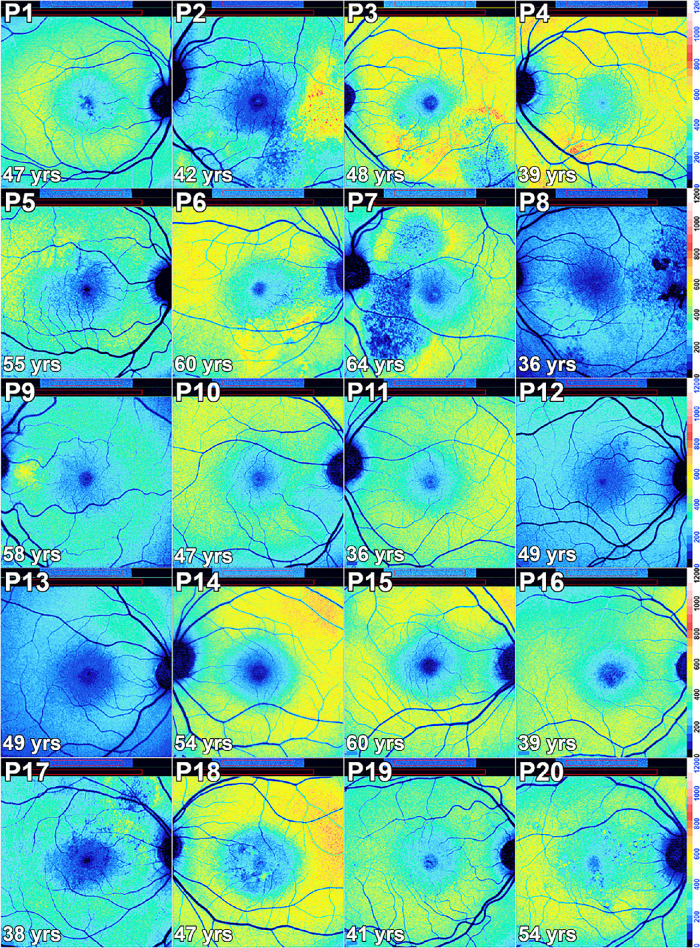
Color-coded qAF images of subjects with central serous chorioretinopathy in Patients (P) 1–20. In some eyes the lesion clearly presents as decreased qAF relative to the surrounding retina (P8, P10, P11, P13). In other patients (P1, P4, P5, P6, P9, P15, P18, P19, P20), the lesion presents with zones of increased qAF in comparison with qAF images of healthy eyes (Fig. 1). Some patients presented lesion with descreased qAF in the center with a surround of increased qAF (P2, P3, P7, P17). In yet other eyes (P12, P14, P16), abnormal distributions of autofluorescence were not observed. The perimeters of the lesions are often delineated by qAF color-coding.
Figure 5.
Central serous chorioretinopathy. (A) NIR-AF. (B) Short wavelength/blue fundus autofluorescence. (C) SD-OCT.
qAF Analysis
To gain an overall impression of qAF intensity in CSC, we generated a single qAF value for each CSC-diagnosed eye by measuring within a preset circular fundus ring at an eccentricity of 7° to 9° (Fig. 1A) regardless of overlap with lesion versus non-lesion retina. As shown in Figure 7, most eyes (27/33) presenting with CSC lesions exhibited qAF8 values that were within normal limits. Five eyes (P3 OS, P4 OS, P10 OD, P12 OS, P18 OS) had values that were outside the upper 95% confidence interval. One eye presented with qAF8 below the lower 95% confidence interval (P17, OS). Thus systematic differences in qAF intensity in patients presenting with CSC were not observed. It is important to note that although many eyes exhibited patches of hyperautofluorescence and hypoautofluorescence, averaging of high and low gray levels probably contributed to normal qAF measurements.
Figure 7.
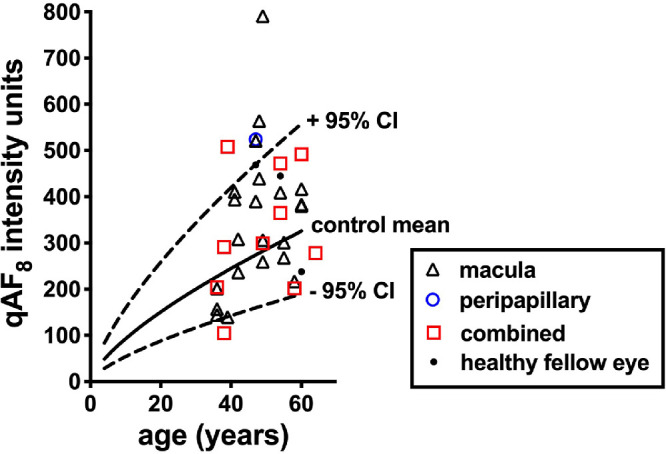
Quantitative fundus autofluorescence intensities in patients diagnosed with central serous chorioretinopathy and plotted as a function of age. Values for macular lesions, peripapillary lesions, combined (lesion located in both macula and peripapillary area) lesions and healthy fellow eyes are plotted. Values are the mean of the eight segments (qAF8) shown in Figure 1A. Mean (solid black line) and 95% confidence intervals (dashed black lines) are shown for healthy controls.
qAF-Color Coded Images of Healthy and CSC Eyes
Color-coded fundus maps were generated by assigning each pixel a color based on the associated qAF value. The spatial distribution of SW-AF in the fundus of a healthy eye exhibits a distinctive pattern in color-coded images generated according to the qAF unit scale (Figs. 1B–1E). The qAF is reduced at the fovea due to absorption of excitation light by macular pigment in the neural retina. In the parafoveal area, SW-AF is reduced because of increased melanin optical density in the RPE. Typically, qAF increases with increasing eccentricity up to ∼10° outside the fovea with the highest levels being situated superotemporally (Fig. 1E, arrow).
The qAF color-coded images acquired from CSC patients (Fig. 67) provided both quantitative and spatial information. Alterations in SW-AF topography presented as four different patterns. For instance, in some cases the lesions presented with decreased qAF (P2 OD, P8 OS, P9 OD, P10 OD, P11 OU, P13 OD, P17 OS, P20 OS) while in other eyes the lesions exhibited increased qAF (P1 OD, P4 OS, P5 OD, P6 OU, P9 OS, P13 OS, P15 OD, P18 OS, P19 OU, P20 OD). Some lesions presented with decreased qAF in the center with a surround of increased qAF (P2 OS, P3 OU, P7 OS, P17 OD). In yet other eyes, abnormal distributions of qAF were not observed (P5 OS, P7 OD, P8 OD, P12 OU, P14 OS, P16 OD), and three eyes (P14 OD, P15 OS, P18 OD) were healthy without evidence of eye disease.
Correlations Between qAF Color-Coded Patterns and SD-OCT
Analysis of SD-OCT scans through the CSC lesions revealed 12 eyes (Table 1) with serous detachment of neural retina only (Fig. 3B), six eyes with pigment epithelium detachment (PED) only (Fig. 2B), and six eyes presenting with both. Nine other eyes had neither a serous detachment nor PED. Outer retinal atrophy indicated by disruption or loss of photoreceptor-attributable reflectivity bands (interdigitation zone [IZ], ellipsoid zone [EZ], and external limiting membrane) presented in 30 eyes (Fig. 4B); and 16 eyes exhibited hypertransmission into the choroid indicative of RPE atrophy (Fig. 4B).
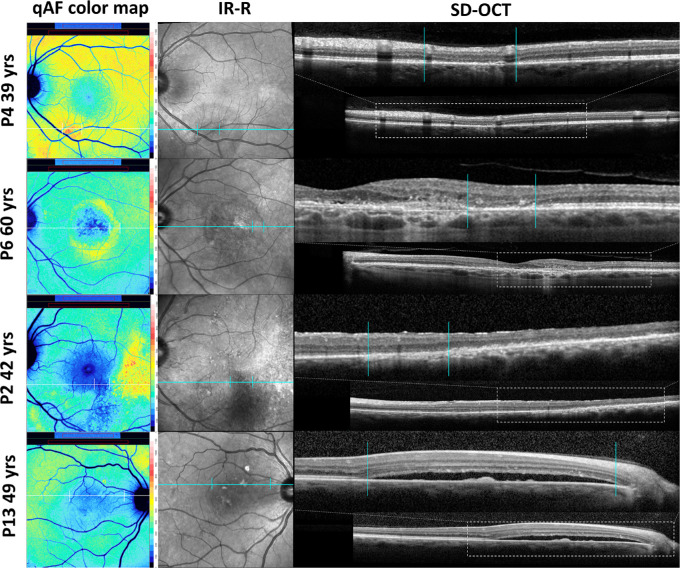
To evaluate the structural features underlying aberrant qAF levels, we correlated color-coding in qAF maps with abnormalities in SD-OCT scans. Elevations and reductions in qAF intensity corresponded spatially to changes in SD-OCT images. For instance, the leading edge of a PED that was minimally visible in the SD-OCT scan (Fig. 3C) presented with increased qAF (Fig. 6, P3, red-coding). As shown in Figure 9 (P4; red coding in qAF color map) a zone of elevated qAF was associated with a loss of IZ and EZ and thinning of outer nuclear layer (ONL) in the SD-OCT scan. In another patient an aberrant ring of elevated autofluorescence (Fig. 9, P6, yellow-coding,) correlated with outer retinal atrophy with absence of IZ and EZ and pronounced ONL thinning in the SD-OCT scan. In the same qAF color-coded image, the parafovea exhibited abnormally low qAF intensity (Fig. 9, P6, blue-coding) that corresponded in the SD-OCT scan with outer retinal atrophy and hypertransmission of signal into the choroid. Similarly in P2, an area of greatly reduced qAF (Fig. 9, P2, blue-coding) was associated with hypertransmission of SD-OCT signal into the choroid whereas an adjacent more temporal area of yellow coding corresponded to increased hyperreflectivity in the outer retina. P13 presented with a serous retinal detachment evident in the SD-OCT; this location in the qAF image exhibited reduced qAF (Fig. 9, blue coding).
Figure 9.
Spatial correspondence between qAF color-coded images and changes in SD-OCT images. P4: Loss of IZ and EZ together with ONL thinning (vertical lines) is associated with elevated qAF (red coding). P6: A parafoveal ring of elevated qAF (yellow coding) is associated with outer retinal atrophy (vertical lines). P2: An area of hypertransmission of SD-OCT signal into the choroid corresponds to abruptly reduced qAF (blue-coding) (vertical lines). P13: A zone of serous retinal detachment (vertical lines) presents with reduced qAF (blue coding).
Segmental Analysis of qAF
The spatial distribution of qAF deviated from normal in all CSC eyes. The locations of lesions overlapped spatially with the nasal (11 eyes), superonasal (11 eyes), inferonasal (11 eyes), superior (7 eyes) and inferior (11 eyes) segments of the qAF8 grid. Fewer lesions overlapped with superotemporal (n = 1), temporal (n = 3), and inferotemporal (n = 4) segments. Otherwise lesions also overlapped with regions outside the qAF8 grid. The qAF values acquired from segments of the measurement grid that overlapped with the CSC lesion were also compared to mean qAF and 95% confidence levels acquired from the corresponding segment in age-similar healthy eyes (55 eyes; age range 36–64; healthy control eyes were the age of the CSC patient ± 2 years) (Fig. 8). In nine eyes, the CSC lesion was outside the measurement grid and thus could not be measured. In eight of 24 eyes (5 macular lesions, 1 peripapillary lesion, and 2 combined lesions) the mean qAF in the CSC patient was higher than the upper 95% confidence interval determined for the healthy eyes (P < 0.05); in seven of 24 eyes (3 macular lesions, 4 combined lesions) the mean qAF of the CSC eye was within the confidence intervals (P > 0.05); and in nine of 24 eyes (5 macular lesions, 4 combined lesions) mean qAF of the CSC eye was lower than the confidence interval (P < 0.05).
Figure 8.
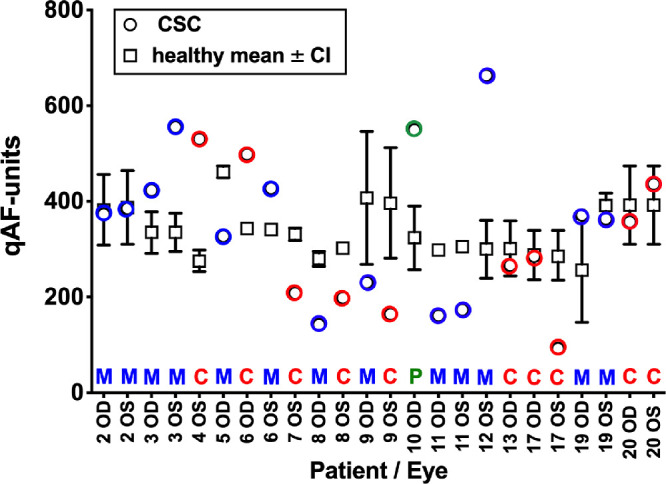
QAF in measurement segments overlapping the CSC lesion. For each patient (P) and eye (OD, OS) mean qAF in segments exhibiting macular lesions (M, blue circles), a peripapillary lesion (P, green circle) and combined macular and peripapillary lesions (C, red circles) are plotted together with the mean (black squares) and 95% confidence intervals (black lines) determined for the same segments in age-similar healthy eyes (total 55 eyes; age range 36–64). Absence of an error bar indicates that the bar was shorter than the size of the symbol.
Discussion
In CSC, SW-AF has advantages as a noninvasive tool aiding differential diagnosis.4,18 We observed here that the topography of SW-AF was altered in cases of CSC. Studies have shown that CSC lesions that are qualitatively judged as not exhibiting elevated SW-AF have better BCVA and shorter disease duration than eyes in which lesions exhibit elevated SW-AF.19 Indeed, some investigators consider heterogenous SW-AF brightness in the CSC lesions as a sign of longer disease duration and retinal damage.19 Our purpose here was to measure the variations in SW-AF intensity associated with CSC lesions and to correlate these levels with structural changes detected in SD-OCT scans.
We observed that sampling for retina-wide elevations in SW-AF intensity by measuring qAF8 in a concentric ring situated at an eccentricity of 7° to 9° did not indicate a generalizable relationship between SW-AF intensity and CSC-diagnosed eyes. On the other hand, all CSC lesions were associated with altered topographic distributions of SW-AF and with localized aberrant qAF intensities.
In the current study, qAF analysis contributed to an understanding of the natural history of CSC. For instance, in the color-coded image of P3 (Fig. 6), a zone of high qAF (coded red) formed the advancing front of the CSC lesion; trailing behind was an area of markedly reduced qAF (blue coding) that likely corresponded to longer-term disease. We also observed that areas of frank outer retinal degeneration with hypertransmission of SD-OCT signal into the choroid were associated with abnormally decreased qAF (e.g., Fig. 9, P2, P6). At other fundus locations areas of disrupted EZ, thinned ONL and hyperreflective debris in outer retina as in P2 (Fig. 9) were associated with abnormal elevations in qAF reflecting an actual increase in SW-AF intensity relative to corresponding areas in healthy retina. The latter observation indicates that the process of photoreceptor cell degeneration in CSC, at least in early stages, involves increased bisretinoid formation. This increase has also been documented in many cases of retinitis pigmentosa20 and in acute zonal occult outer retinopathy.21 Because bisretinoid accumulation is not benign,22 further studies may determine whether increased bisretinoid aggravates the disease process.
SW-AF in CSC is dynamic. For this reason, not all CSC lesions exhibited elevated or reduced qAF in tandem and the patterns of intensities in qAF color maps likely depend on the stage of disease.
One limitation of the study was that patients were not necessarily tested at the same interval after disease onset. Each qAF image acquired in this study provided qAF data at a single stage of the disease, whereas qAF values are likely to vary with disease progression. We note that bilateral cases of CSC in our study did not necessarily present with concordant features. This is to be expected because onset of disease in fellow eyes can occur months and years apart.23 Another limitation was the number of patients (n = 20; 36 eyes) comprising the cohort. Despite this, however, the study was comprehensive. Thus analysis involved multiple modalities; the CSC lesions involved both macula and peripapillary retina; and the lesions presented with RPE detachment, serous retinal detachment, and diverse stages of outer retinal degeneration. All CSC lesions were associated with altered SW-AF topography and with localized abnormalities in qAF intensities that depended on the stage of disease. Importantly, color-coded qAF maps enabled correlations with structural changes in the outer retina that were visible in SD-OCT scans.
If the increased SW-AF observed here represented a window defect one would expect AF at positions within the lesion to be consistently higher but this was not observed. The abnormal increases in SW-AF cannot be attributed to accelerated phagocytosis of photoreceptor outer segments as has been suggested24–26 because the fluorophores form in photoreceptor outer segments before outer segment shedding and phagocytosis. On the other hand, some cases of reduced qAF in the presence of an acute CSC with retinal detachment can be accounted for by blockage of signal by the subretinal fluid (P 10: Fig. 3 and Fig. 6).
SW-AF emitted by bisretinoid lipofuscin of retina and NIR-AF arising from melanin both originate, at least in part, from RPE cells yet the fundus distributions of these modalities are not necessarily the same. As shown in the current work, NIR-AF detection of CSC lesions was superior to SW-AF when the lesion occupied central retina. On the other hand, the RPE detachment visible in horizontal SD-OCT scans of P3 was hyperautofluorescent in en face images acquired by both the SW-AF and NIR-AF modalities. In the same eye, RPE loss presented as dark mottling in SW-AF, foci of hypoautofluorescence in NIR-AF images, and foci of hypertransmission of SD-OCT signal. Reduced qAF associated with a serous retinal detachment as observed in P10 (Fig. 6) is likely due to AF blockage by the fluid.27 Other spots presenting as hyperautofluorescence in SW-AF and NIR-AF images may represent locally displaced RPE. Alternatively, we have also shown by quantifying NIR-AF intensities that at elevated lipofuscin levels, as exist in ABCA4-disease, the bisretinoid lipofuscin fluorophores can modulate the NIR-AF signal.28
The advantage of measuring SW-AF intensity by qAF rather than relying on contrast within individual images is that apparent hyperautofluorescence in SW-AF images is not always indicative of an actual elevation of qAF. Specifically, with acquisition of conventional fundus AF images, processing adjusts image quality by spreading intensity values to within the full grayscale range (0–255) (histogram stretching). Although image contrast is increased by this normalization process, gray level intensities within the diseased fundus cannot be compared to gray levels in the healthy fundus nor to gray levels measured in other patients of the cohort. Conversely the qAF protocol uses cSLO images saved in the nonnormalized mode to prevent histogram stretch and calibrates images with an internal fluorescent reference. Thus investigators can differentiate between an actual increase in the bisretinoid fluorophores that are the source of SW-AF versus only an apparent increase in SW-AF caused by contrast differences in the image. These are measurements that can also be incorporated into clinical trials.
Acknowledgments
Supported by grants from the National Eye Institute EY024091 and P30EY019007; and a grant from Research to Prevent Blindness to the Department of Ophthalmology, Columbia University.
Disclosure: L. Han, None; J.R.L. de Carvalho, None; R. Parmann, None; T.H. Tezel, None; S. Chang, None; T. Sharma, None; J.R. Sparrow, None
References
- 1. Lim JI, Glassman AR, Aiello LP, et al.. Collaborative retrospective macula society study of photodynamic therapy for chronic central serous chorioretinopathy. Ophthalmology. 2014; 121: 1073–1078. [DOI] [PubMed] [Google Scholar]
- 2. Ho IV, Yannuzzi L.. Chronic central serous chorioretinopathy and fundus autofluorescence. Retin Cases Brief Rep. 2008; 2: 1–5. [DOI] [PubMed] [Google Scholar]
- 3. Spaide RF, Campeas L, Haas A, et al.. Central serous chorioretinopathy in younger and older adults. Ophthalmology. 1996; 103: 2070–2079. [DOI] [PubMed] [Google Scholar]
- 4. Framme C, Walter A, Gabler B, Roider J, Sachs HG, Gabel VP.. Fundus autofluorescence in acute and chronic-recurrent central serous chorioretinopathy. Acta Ophthalmol Scand. 2005; 83: 161–167. [DOI] [PubMed] [Google Scholar]
- 5. Tittl MK, Spaide RF, Wong D, et al.. Systemic findings associated with central serous chorioretinopathy. Am J Ophthalmol. 1999; 128: 63–68. [DOI] [PubMed] [Google Scholar]
- 6. Daruich A, Matet A, Dirani A, et al.. Central serous chorioretinopathy: Recent findings and new physiopathology hypothesis. Prog Retin Eye Res. 2015; 48: 82–118. [DOI] [PubMed] [Google Scholar]
- 7. van Rijssen TJ, van Dijk EHC, Yzer S, et al.. Central serous chorioretinopathy: Towards an evidence-based treatment guideline. Prog Retin Eye Res. 2019; 73: 100770. [DOI] [PubMed] [Google Scholar]
- 8. Dinc UA, Tatlipinar S, Yenerel M, Gorgun E, Ciftci F.. Fundus autofluorescence in acute and chronic central serous chorioretinopathy. Clin Exp Optom. 2011; 94: 452–457. [DOI] [PubMed] [Google Scholar]
- 9. Sekiryu T, Iida T, Maruko I, Saito K, Kondo T.. Infrared fundus autofluorescence and central serous chorioretinopathy. Invest Ophthalmol Vis Sci. 2010; 51: 4956–4962. [DOI] [PubMed] [Google Scholar]
- 10. Ayata A, Tatlipinar S, Kar T, Unal M, Ersanli D, Bilge AH.. Near-infrared and short-wavelength autofluorescence imaging in central serous chorioretinopathy. Br J Ophthalmol. 2009; 93: 79–82. [DOI] [PubMed] [Google Scholar]
- 11. Iacono P, Battaglia PM, Papayannis A, La Spina C, Varano M, Bandello F. Acute central serous chorioretinopathy: a correlation study between fundus autofluorescence and spectral-domain OCT. Graef Arch Clin Exp. 2015; 253: 1889–1897. [DOI] [PubMed] [Google Scholar]
- 12. Eandi CM, Ober M, Iranmanesh R, Peiretti E, Yannuzzi LA.. Acute central serous chorioretinopathy and fundus autofluorescence. Retina-J Ret Vit Dis. 2005; 25: 989–993. [DOI] [PubMed] [Google Scholar]
- 13. Matsumoto H, Kishi S, Sato T, Mukai R.. Fundus autofluorescence of elongated photoreceptor outer segments in central serous chorioretinopathy. Am J Ophthalmol. 2011; 151: 617–623. [DOI] [PubMed] [Google Scholar]
- 14. Sparrow JR, Duncker T, Schuerch K, Paavo M, de Carvalho JRL Jr. Lessons learned from quantitative fundus autofluorescence. Prog Retin Eye Res. 2020; 74: 100774. [DOI] [PMC free article] [PubMed] [Google Scholar]
- 15. Duncker T, Greenberg JP, Ramachandran R, et al.. Quantitative fundus autofluorescence and optical coherence tomography in Best vitelliform macular dystrophy. Invest Ophthalmol Vis Sci. 2014; 55: 1471–1482. [DOI] [PMC free article] [PubMed] [Google Scholar]
- 16. Keilhauer CN, Delori FC.. Near-infrared autofluorescence imaging of the fundus: visualization of ocular melanin. Invest Ophthalmol Vis Sci. 2006; 47: 3556–3564. [DOI] [PubMed] [Google Scholar]
- 17. Duncker T, Marsiglia M, Lee W, et al.. Correlations Amongst Near-Infrared and Short-Wavelength Autofluorescence and Spectral Domain Optical Coherence Tomography in Recessive Stargardt Disease. Invest Ophthalmol Vis Sci. 2014; 55: 8134–8143. [DOI] [PMC free article] [PubMed] [Google Scholar]
- 18. Lee WJ, Lee JH, Lee BR.. Fundus autofluorescence imaging patterns in central serous chorioretinopathy according to chronicity. Eye (Lond). 2016; 30: 1336–1342. [DOI] [PMC free article] [PubMed] [Google Scholar]
- 19. Choi KE, Yun C, Kim YH, Kim SW, Oh J, Huh K.. The effect of photopigment bleaching on fundus autofluorescence in acute central serous chorioretinopathy. Retina. 2017; 37(3): 568–577. [DOI] [PubMed] [Google Scholar]
- 20. Schuerch K, Woods RL, Lee W, et al.. Quantifying fundus autofluorescence in patients with retinitis pigmentosa. Invest Ophthalmol Vis Sci. 2017; 58: 1843–1855. [DOI] [PMC free article] [PubMed] [Google Scholar]
- 21. Boudreault K, Schuerch K, Zhao J, et al.. Quantitative autofluorescence intensities in acute zonal occult outer retinopathy vs healthy eyes. JAMA Ophthalmology. 2017; 135: 1330–1338. [DOI] [PMC free article] [PubMed] [Google Scholar]
- 22. Lima de Carvalho JR Jr, Kim HJ, Ueda K, et al.. Effects of deficiency in the RLBP1-encoded visual cycle protein CRALBP on visual dysfunction in humans and mice. J Biol Chem. 2020; 295: 6767–6780. [DOI] [PMC free article] [PubMed] [Google Scholar]
- 23. Shinojima A, Mehanna C, Lavia CA, Gaudric A, Tadayoni R, Bousquet E.. Central serous chorioretinopathy: risk factors for serous retinal detachment in fellow eyes. Br J Ophthalmol. 2020; 104: 852–856. [DOI] [PubMed] [Google Scholar]
- 24. Lima LH, Burke T, Greenstein VC, et al.. Progressive constriction of the hyperautofluorescent ring in retinitis pigmentosa. Am J Ophthalmol. 2012; 153: 718–727. [DOI] [PMC free article] [PubMed] [Google Scholar]
- 25. Aizawa S, Mitamura Y, Hagiwara A, Sugawara T, Yamamoto S.. Changes of fundus autofluorescence, photoreceptor inner and outer segment junction line, and visual function in patients with retinitis pigmentosa. Clin Experiment Ophthalmol. 2010; 38: 597–604. [DOI] [PubMed] [Google Scholar]
- 26. Robson AG, Saihan Z, Jenkins SA, et al.. Functional characterisation and serial imaging of abnormal fundus autofluorescence in patients with retinitis pigmentosa and normal visual acuity. Br J Ophthalmol. 2006; 90: 472–479. [DOI] [PMC free article] [PubMed] [Google Scholar]
- 27. Salvanos P, Navaratnam J, Ma J, Bragadottir R, Moe MC.. Ultra-widefield autofluorescence imaging in the evaluation of scleral buckling surgery for retinal detachment. Retina. 2013; 33: 1421–1427. [DOI] [PubMed] [Google Scholar]
- 28. Paavo M, Zhao J, Kim HJ, et al.. Mutations in GPR143/OA1 and ABCA4 inform interpretations of short-wavelength and near-infrared fundus autofluorescence. Invest Ophthalmol Vis Sci. 2018; 59: 2459–2469. [DOI] [PMC free article] [PubMed] [Google Scholar]


